| Param | Original file | Final file |
|---|---|---|
| Filename | modeM0/AS1A04_022T04_9000001666_11405cztM0_level2.evt | modeM0/AS1A04_022T04_9000001666_11405cztM0_level2_quad_clean.evt |
| Size (bytes) | 153,564,480 | 41,313,600 |
| Size | 146.5 MB | 39.4 MB |
| Events in quadrant A | 1,162,173 | 277,071 |
| Events in quadrant B | 1,232,139 | 274,612 |
| Events in quadrant C | 943,134 | 291,040 |
| Events in quadrant D | 1,184,807 | 272,611 |
| Mode SS | |||
|---|---|---|---|
| Quadrant | BADHDUFLAG | Total packets | Discarded packets |
| A | 0 | 36 | 0 |
| B | 0 | 36 | 0 |
| C | 0 | 36 | 0 |
| D | 0 | 36 | 0 |
| Mode M0 | |||
|---|---|---|---|
| Quadrant | BADHDUFLAG | Total packets | Discarded packets |
| A | 0 | 4631 | 0 |
| B | 0 | 4841 | 0 |
| C | 0 | 3858 | 0 |
| D | 0 | 4696 | 0 |
| Quadrant | Total seconds | Saturated seconds | Saturation percentage |
|---|---|---|---|
| A | 1860 | 32 | 1.720430% |
| B | 1860 | 69 | 3.709677% |
| C | 1860 | 1 | 0.053763% |
| D | 1860 | 18 | 0.967742% |
Noise dominated data is calculated using 1-second bins in cleaned event files. If a bin has >2000 counts, and if more than 50% of those come from <1% of pixels, then it is considered to be noise-dominated and hence unusable.
| Quadrant | # 1 sec bins | Bins with >0 counts | Bins with >2000 counts | High rate bins dominated by noise | Noise dominated (total time) | Noise dominated (detector-on time) | Marked lightcurve |
|---|---|---|---|---|---|---|---|
| A | 1860 | 1860 | 25 | 25 | 1.34% | 1.34% | 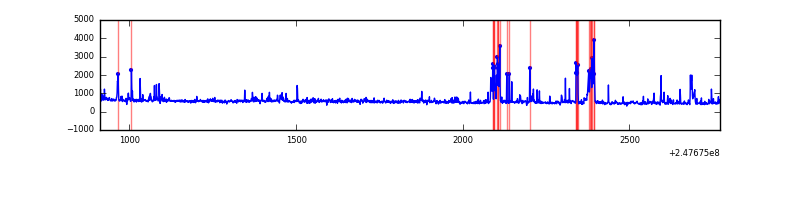 |
| B | 1860 | 1860 | 45 | 45 | 2.42% | 2.42% | 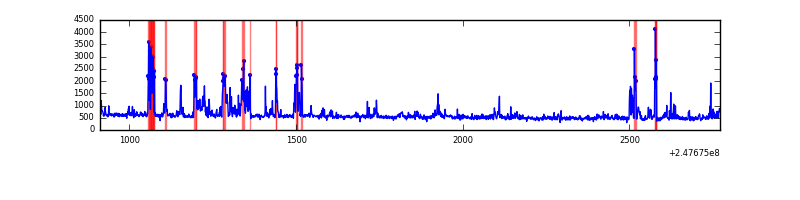 |
| C | 1860 | 1860 | 0 | 0 | 0.00% | 0.00% | 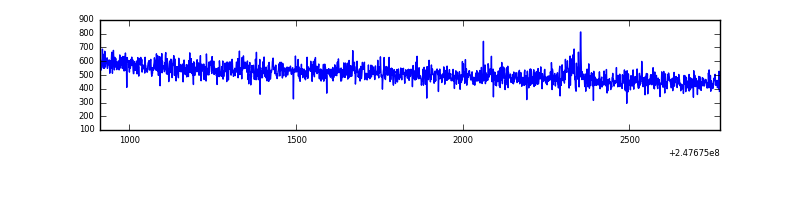 |
| D | 1860 | 1860 | 14 | 14 | 0.75% | 0.75% | 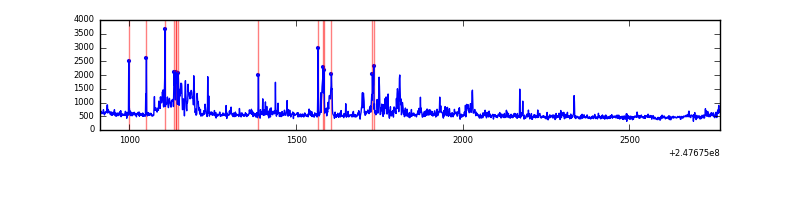 |
Top three noisy pixels from each quadrant. If the there are fewer than three noisy pixels in the level2.evt file, extra rows are filled as -1
| Pixel properties | Quadrant properties | ||||||
|---|---|---|---|---|---|---|---|
| Quadrant | DetID | PixID | Counts | Sigma | Mean | Median | Sigma |
| A | 8 | 5 | 161929 | 3215.27 | 245 | 240 | 50.3 |
| A | 13 | 210 | 34090 | 673.12 | 245 | 240 | 50.3 |
| A | 11 | 29 | 6187 | 118.26 | 245 | 240 | 50.3 |
| B | 4 | 239 | 246566 | 5402.09 | 236 | 231 | 45.6 |
| B | 15 | 204 | 33943 | 739.3 | 236 | 231 | 45.6 |
| B | 3 | 189 | 18013 | 389.96 | 236 | 231 | 45.6 |
| C | 14 | 234 | 5304 | 89.09 | 240 | 241 | 56.8 |
| C | 13 | 61 | 1835 | 28.05 | 240 | 241 | 56.8 |
| C | 3 | 202 | 644 | 7.09 | 240 | 241 | 56.8 |
| D | 1 | 52 | 106301 | 1835.3 | 241 | 235 | 57.8 |
| D | 2 | 120 | 67420 | 1162.53 | 241 | 235 | 57.8 |
| D | 10 | 199 | 41508 | 714.16 | 241 | 235 | 57.8 |
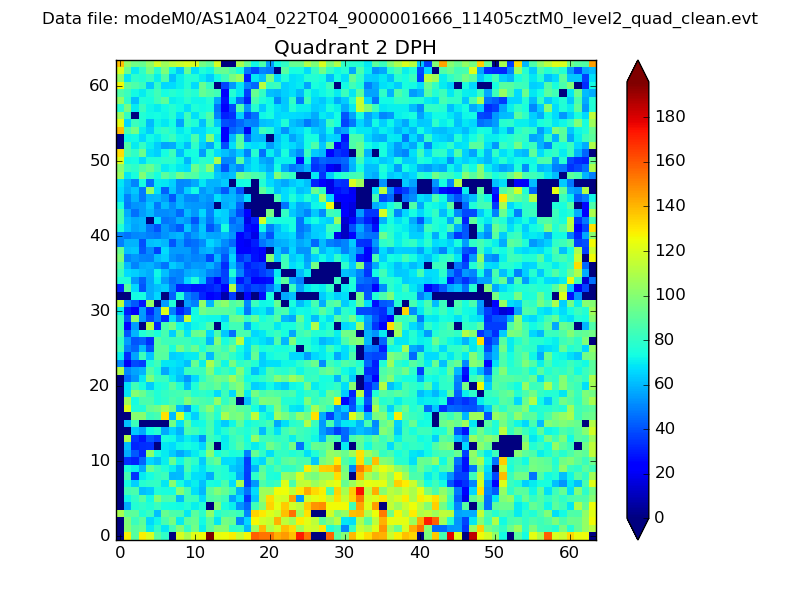
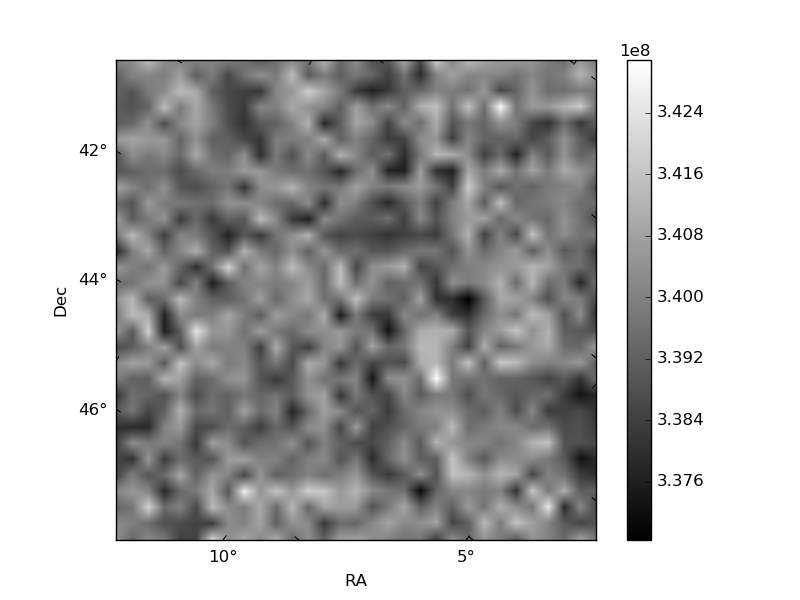
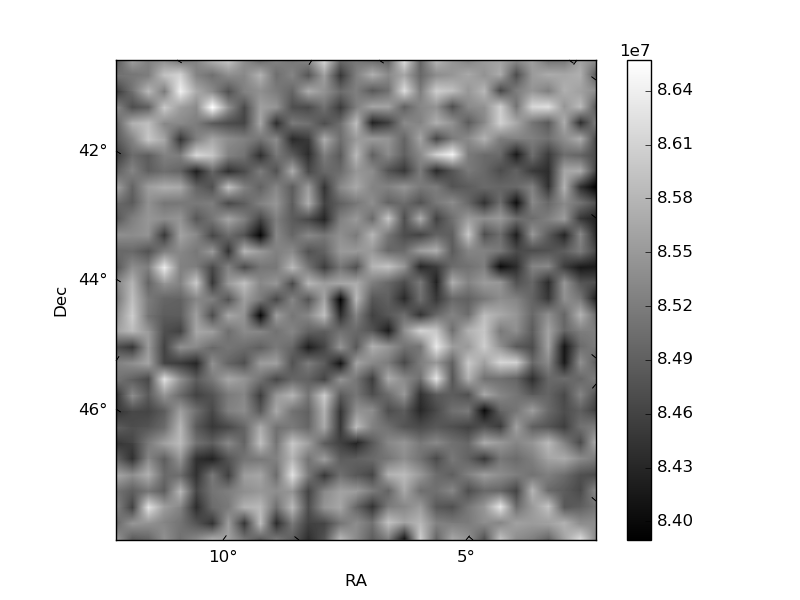
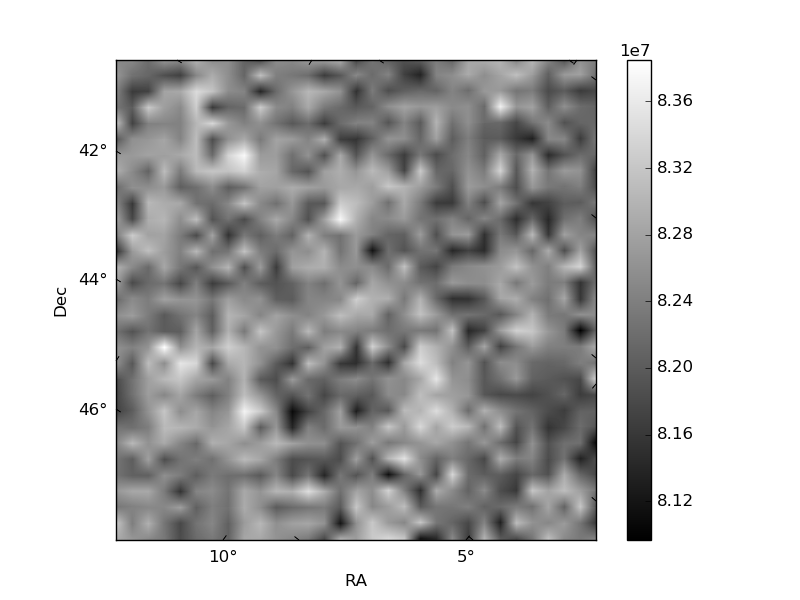
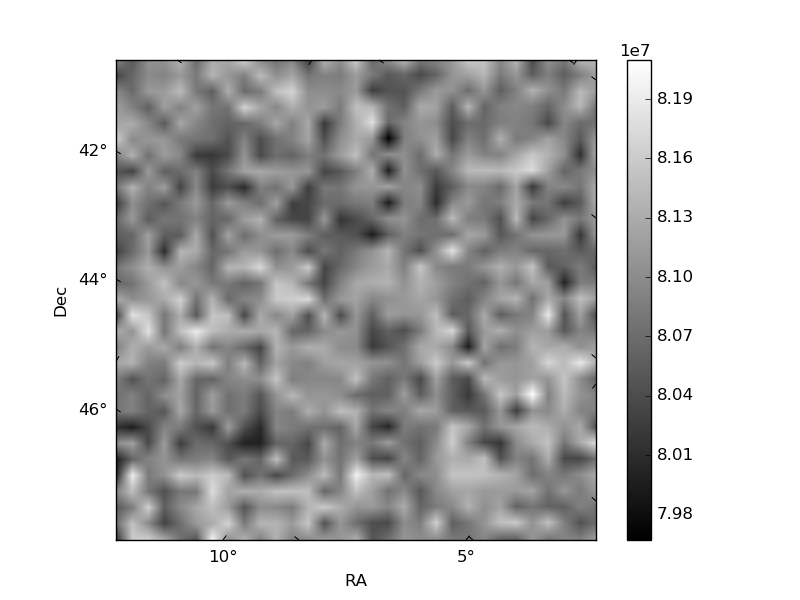
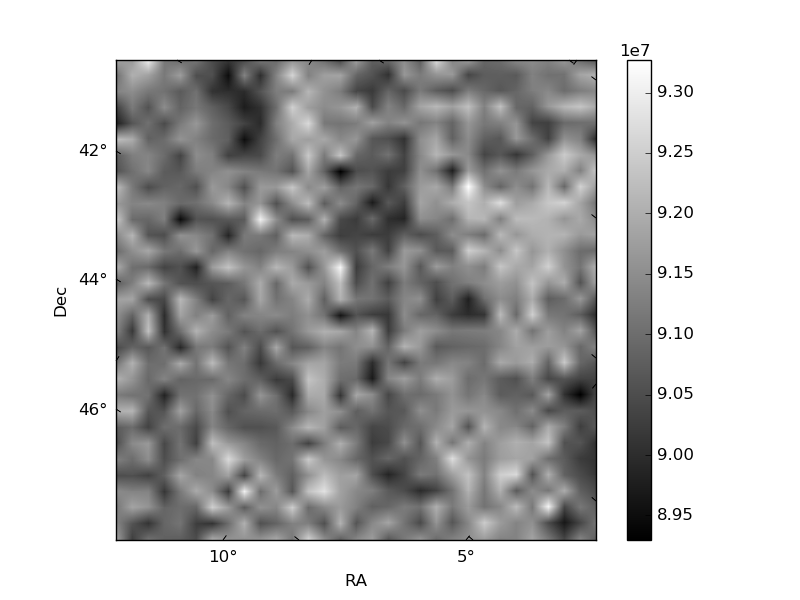
Histogram calculated using DETX and DETY for each event in the final _common_clean file
| Quadrant A | 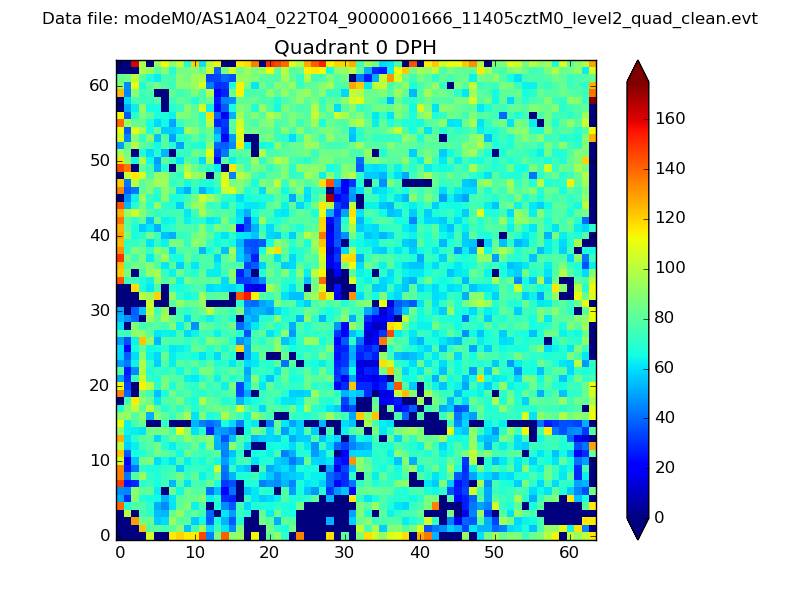 |
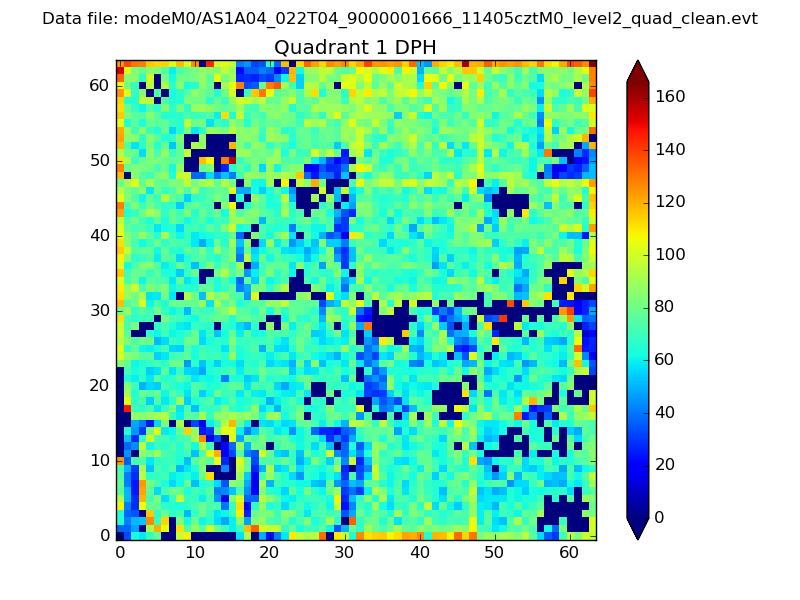 |
Quadrant B |
|---|---|---|---|
| Quadrant D | 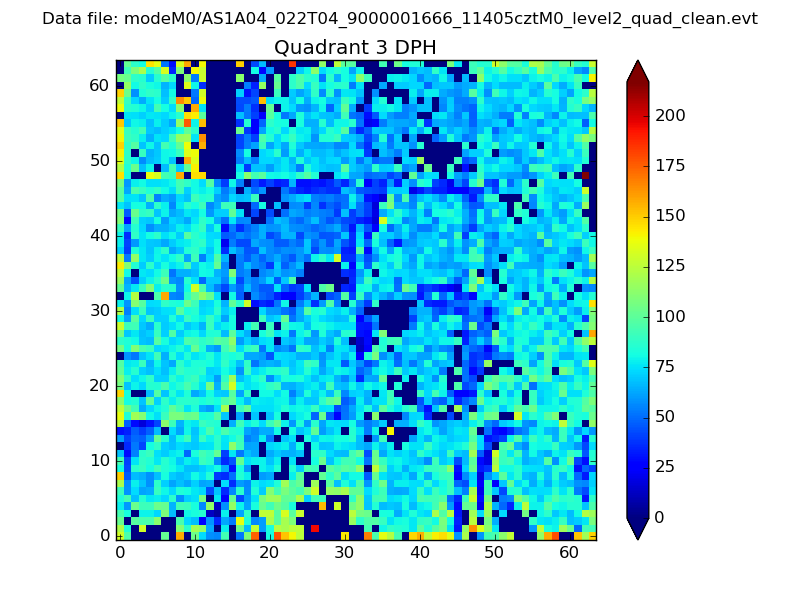 |
 |
Quadrant C |
| Plot type | Count rate plots | Images |
|---|---|---|
| Comparison with Poisson distribution Blue bars denote a histogram of data divided into 1 sec bins. Red curve is a Poisson curve with rate = median count rate of data. |
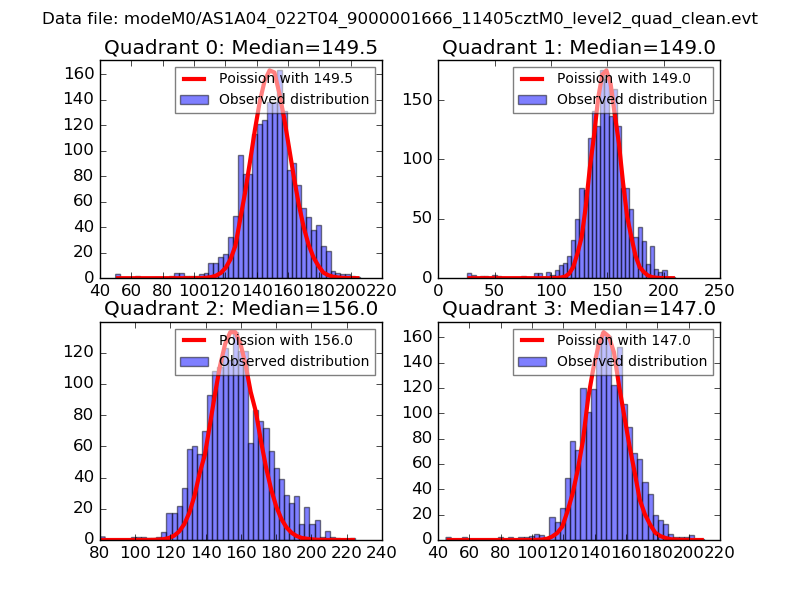 |
 |
| Quadrant-wise count rates Data is divided into 100 sec bins |
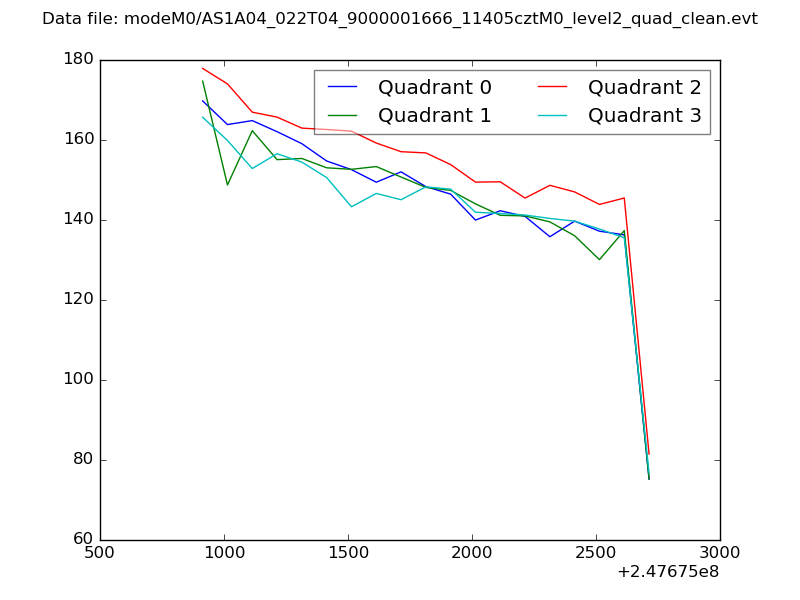 |
|
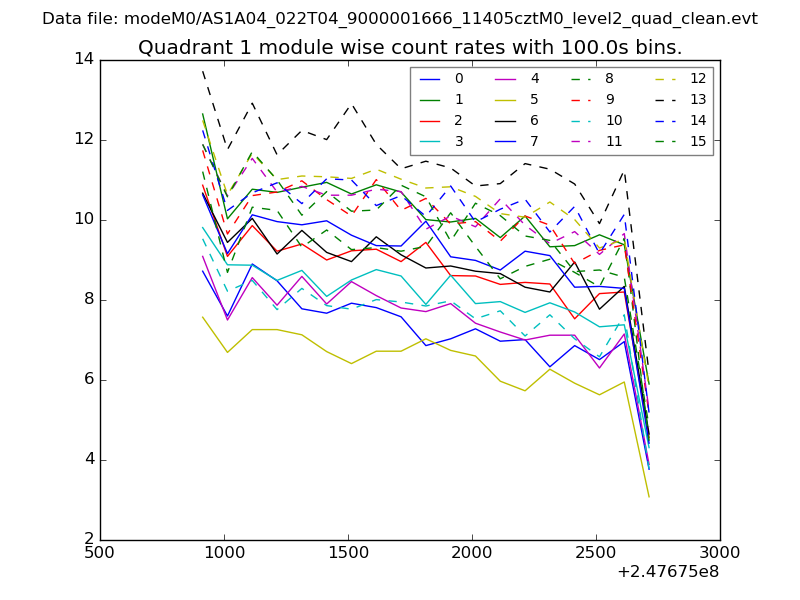
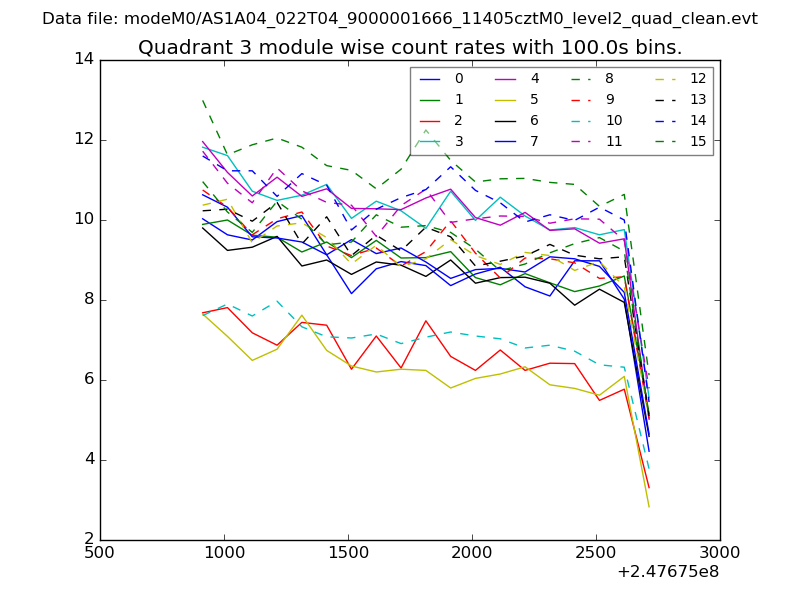
| Module-wise count rates for Quadrant A Data is divided into 100 sec bins |
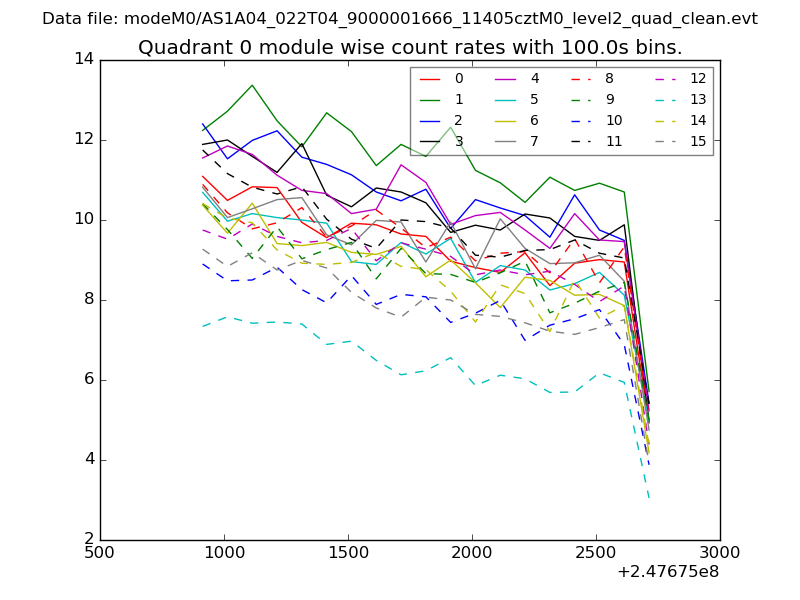 |
 |
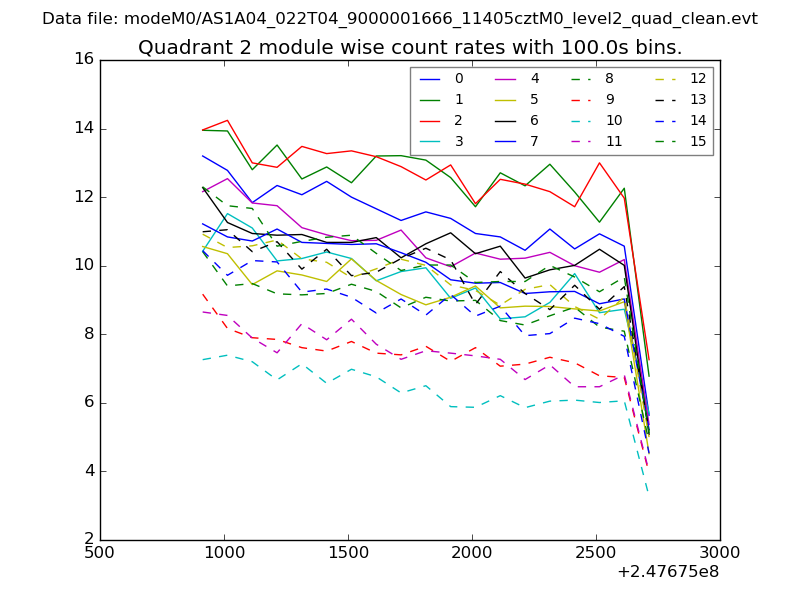
| Module-wise count rates for Quadrant B Data is divided into 100 sec bins |
 |
 |
| Module-wise count rates for Quadrant C Data is divided into 100 sec bins |
 |
 |
| Module-wise count rates for Quadrant D Data is divided into 100 sec bins |
 |
 |
| Parameter | Plot |
|---|---|
| CZT HV Monitor | 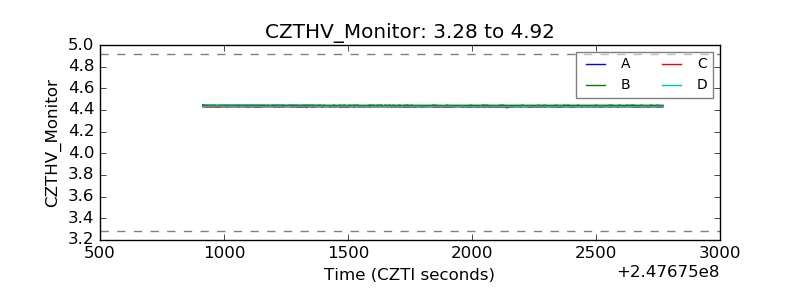 |
| D_VDD | 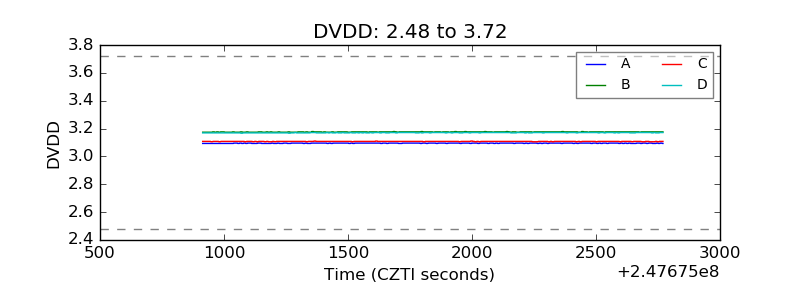 |
| Temperature 1 | 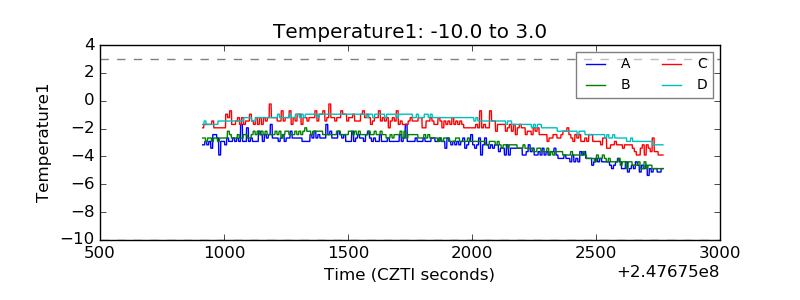 |
| Veto HV Monitor | 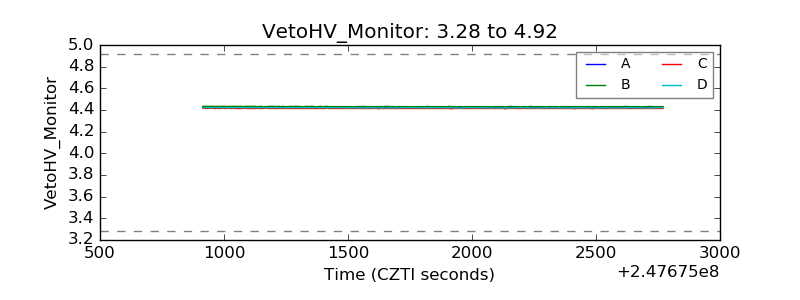 |
| Veto LLD |  |
| Alpha Counter | 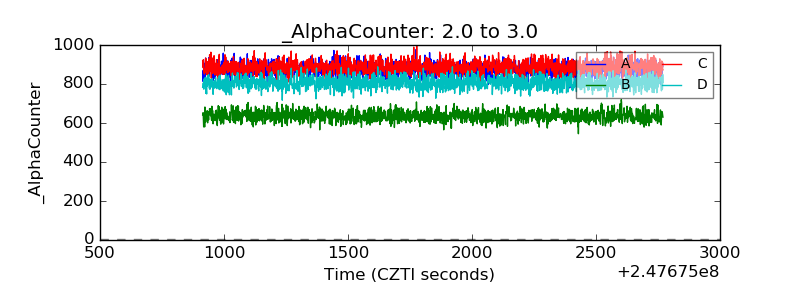 |
| _CPM_Rate | 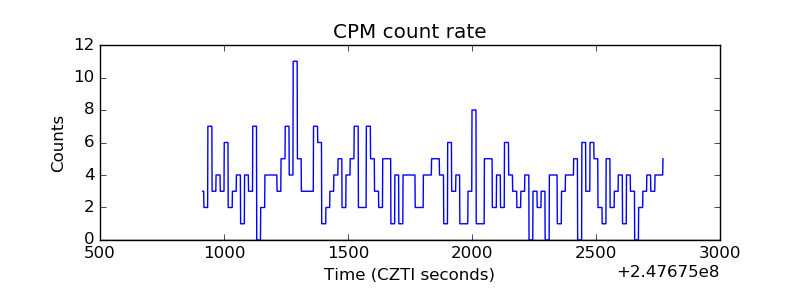 |
| CZT Counter | 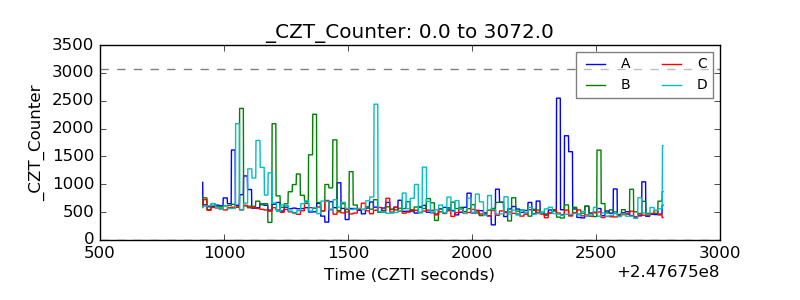 |
| +2.5 Volts monitor |  |
| +5 Volts monitor |  |
| _ROLL_ROT | 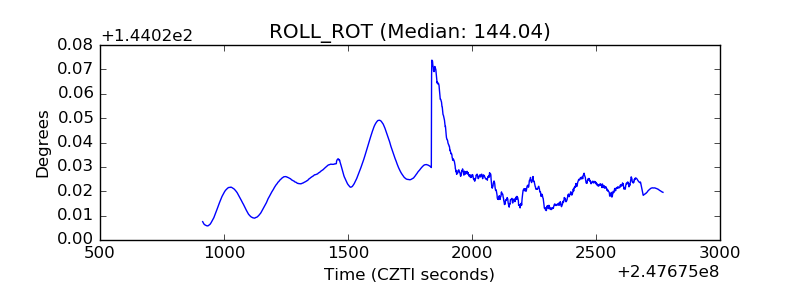 |
| _Roll_DEC | 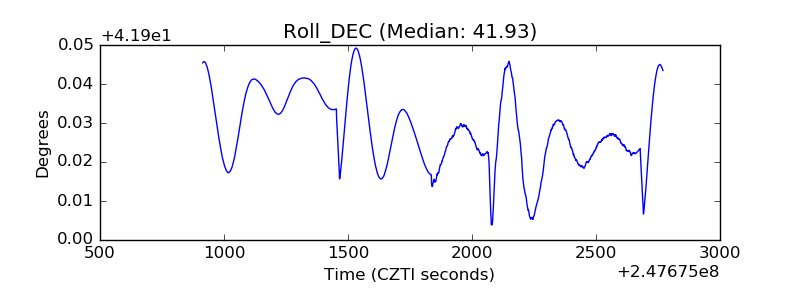 |
| _Roll_RA | 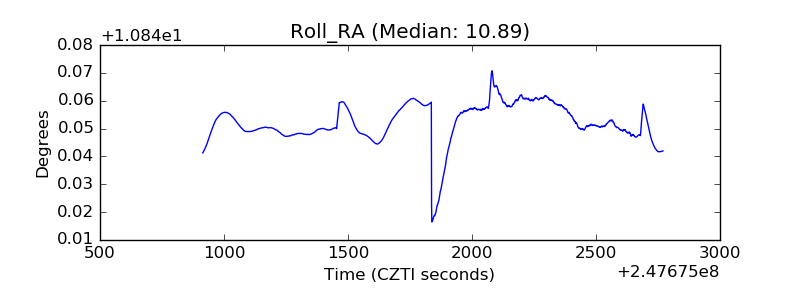 |
| Veto Counter | 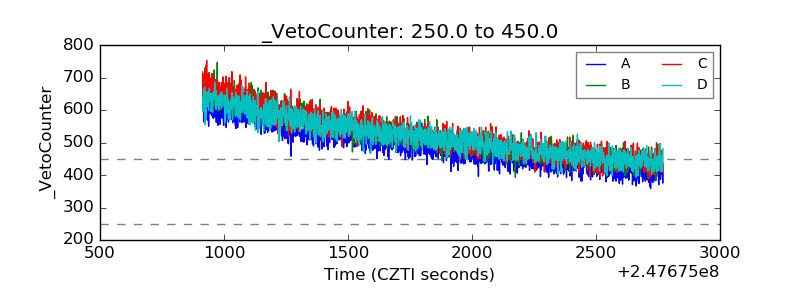 |