| Param | Original file | Final file |
|---|---|---|
| Filename | modeM0/AS1G08_066T01_9000001668_11406cztM0_level2.evt | modeM0/AS1G08_066T01_9000001668_11406cztM0_level2_quad_clean.evt |
| Size (bytes) | 487,618,560 | 105,390,720 |
| Size | 465.0 MB | 100.5 MB |
| Events in quadrant A | 3,251,481 | 705,507 |
| Events in quadrant B | 4,381,904 | 696,051 |
| Events in quadrant C | 3,057,296 | 683,253 |
| Events in quadrant D | 3,632,396 | 650,673 |
| Mode M0 | |||
|---|---|---|---|
| Quadrant | BADHDUFLAG | Total packets | Discarded packets |
| A | 0 | 13918 | 2 |
| B | 0 | 17248 | 1 |
| C | 0 | 13565 | 1 |
| D | 0 | 15224 | 1 |
| Mode SS | |||
|---|---|---|---|
| Quadrant | BADHDUFLAG | Total packets | Discarded packets |
| A | 0 | 132 | 0 |
| B | 0 | 132 | 0 |
| C | 0 | 132 | 0 |
| D | 0 | 132 | 0 |
| Mode M9 | |||
|---|---|---|---|
| Quadrant | BADHDUFLAG | Total packets | Discarded packets |
| A | 0 | 13 | 0 |
| B | 0 | 13 | 0 |
| C | 0 | 13 | 0 |
| D | 0 | 13 | 0 |
| Quadrant | Total seconds | Saturated seconds | Saturation percentage |
|---|---|---|---|
| A | 6548 | 65 | 0.992670% |
| B | 6548 | 332 | 5.070250% |
| C | 6548 | 29 | 0.442883% |
| D | 6548 | 136 | 2.076970% |
Noise dominated data is calculated using 1-second bins in cleaned event files. If a bin has >2000 counts, and if more than 50% of those come from <1% of pixels, then it is considered to be noise-dominated and hence unusable.
| Quadrant | # 1 sec bins | Bins with >0 counts | Bins with >2000 counts | High rate bins dominated by noise | Noise dominated (total time) | Noise dominated (detector-on time) | Marked lightcurve |
|---|---|---|---|---|---|---|---|
| A | 7858 | 6550 | 0 | 0 | 0.00% | 0.00% |  |
| B | 7858 | 6550 | 148 | 148 | 1.88% | 2.26% |  |
| C | 7858 | 6550 | 0 | 0 | 0.00% | 0.00% |  |
| D | 7858 | 6550 | 78 | 78 | 0.99% | 1.19% |  |
Top three noisy pixels from each quadrant. If the there are fewer than three noisy pixels in the level2.evt file, extra rows are filled as -1
| Pixel properties | Quadrant properties | ||||||
|---|---|---|---|---|---|---|---|
| Quadrant | DetID | PixID | Counts | Sigma | Mean | Median | Sigma |
| A | 8 | 5 | 35252 | 207.27 | 825 | 808 | 166.2 |
| A | 11 | 29 | 18796 | 108.24 | 825 | 808 | 166.2 |
| A | 0 | 226 | 7519 | 40.38 | 825 | 808 | 166.2 |
| B | 4 | 239 | 1004963 | 6529.17 | 815 | 796 | 153.8 |
| B | 15 | 204 | 53409 | 342.09 | 815 | 796 | 153.8 |
| B | 0 | 218 | 37733 | 240.16 | 815 | 796 | 153.8 |
| C | 13 | 61 | 5718 | 27.3 | 784 | 787 | 180.6 |
| C | 14 | 234 | 2292 | 8.33 | 784 | 787 | 180.6 |
| C | 3 | 202 | 1901 | 6.17 | 784 | 787 | 180.6 |
| D | 2 | 14 | 158100 | 846.12 | 776 | 756 | 186.0 |
| D | 10 | 253 | 117730 | 629.03 | 776 | 756 | 186.0 |
| D | 13 | 172 | 103745 | 553.82 | 776 | 756 | 186.0 |
Histogram calculated using DETX and DETY for each event in the final _common_clean file
| Quadrant A |  |
 |
Quadrant B |
|---|---|---|---|
| Quadrant D |  |
 |
Quadrant C |
| Plot type | Count rate plots | Images |
|---|---|---|
| Comparison with Poisson distribution Blue bars denote a histogram of data divided into 1 sec bins. Red curve is a Poisson curve with rate = median count rate of data. |
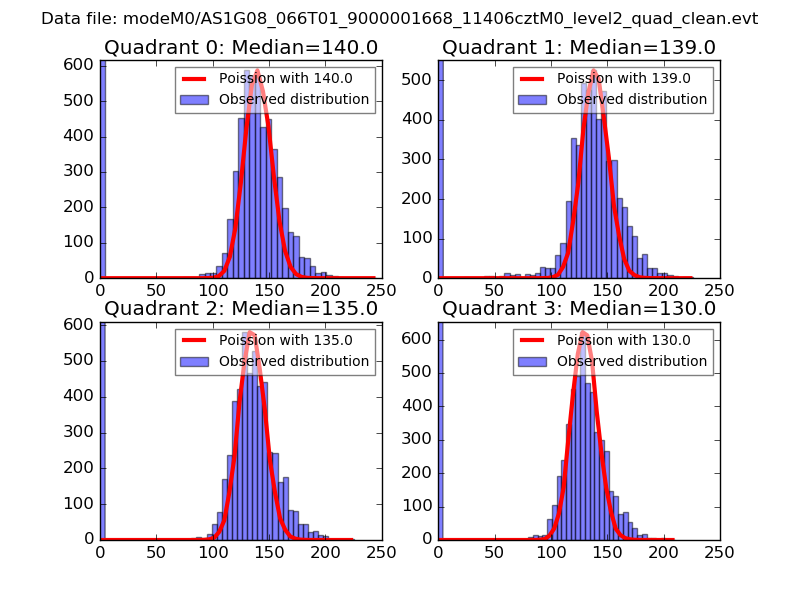 |
 |
| Quadrant-wise count rates Data is divided into 100 sec bins |
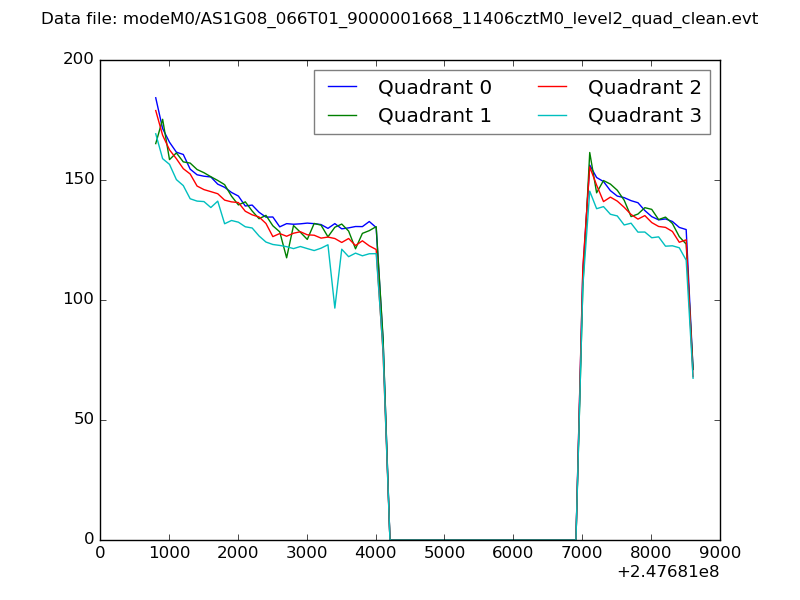 |
|
| Module-wise count rates for Quadrant A Data is divided into 100 sec bins |
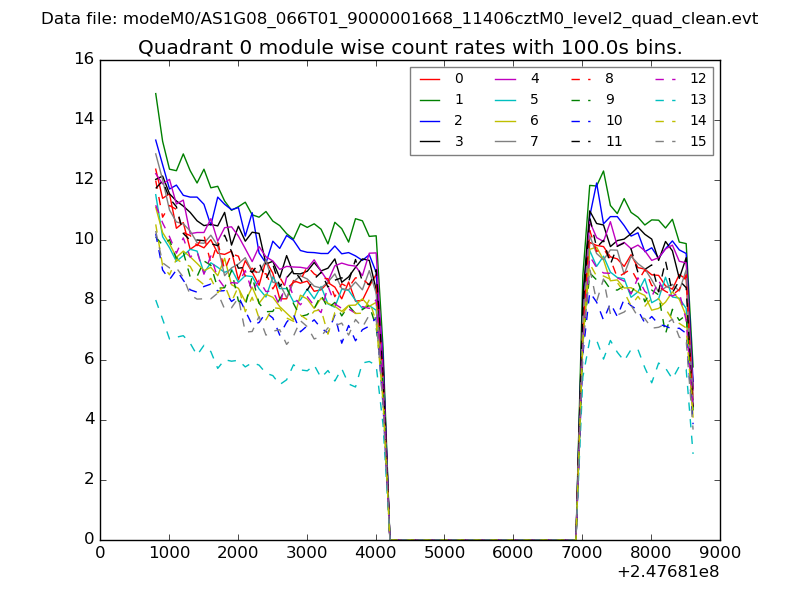 |
 |
| Module-wise count rates for Quadrant B Data is divided into 100 sec bins |
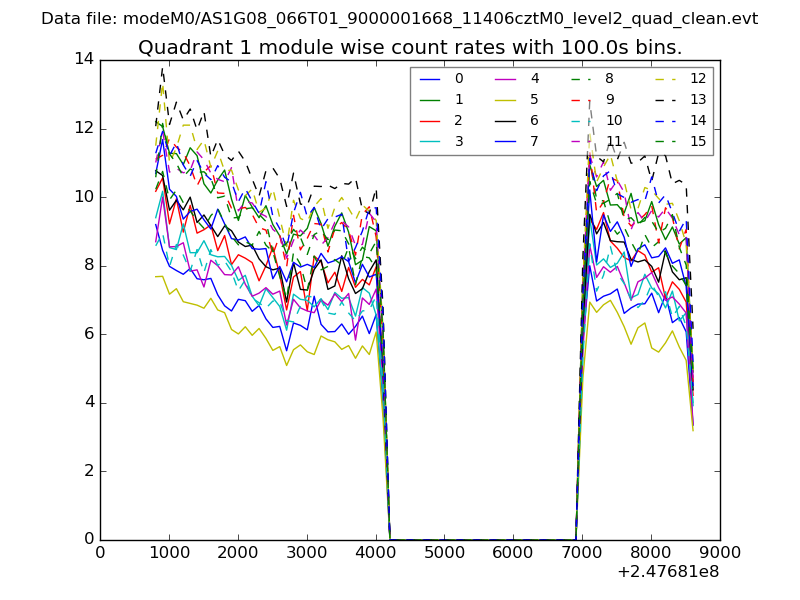 |
 |
| Module-wise count rates for Quadrant C Data is divided into 100 sec bins |
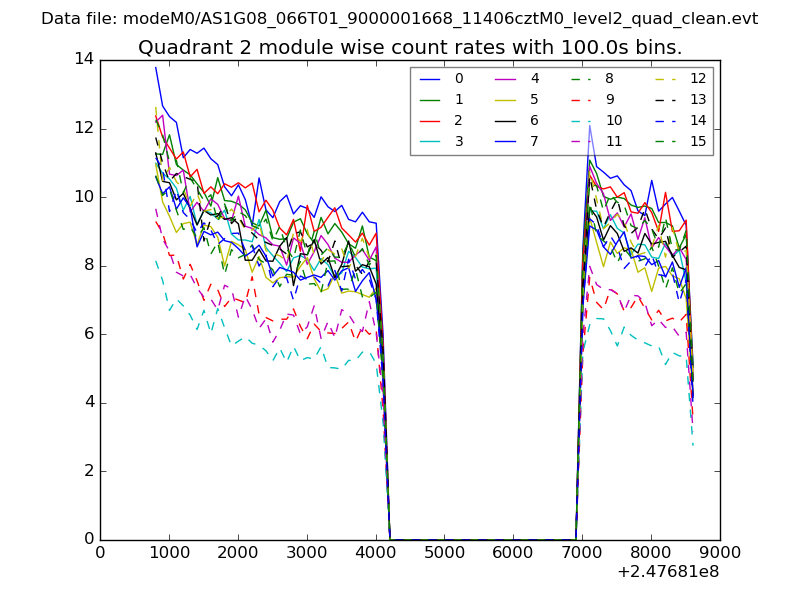 |
 |
| Module-wise count rates for Quadrant D Data is divided into 100 sec bins |
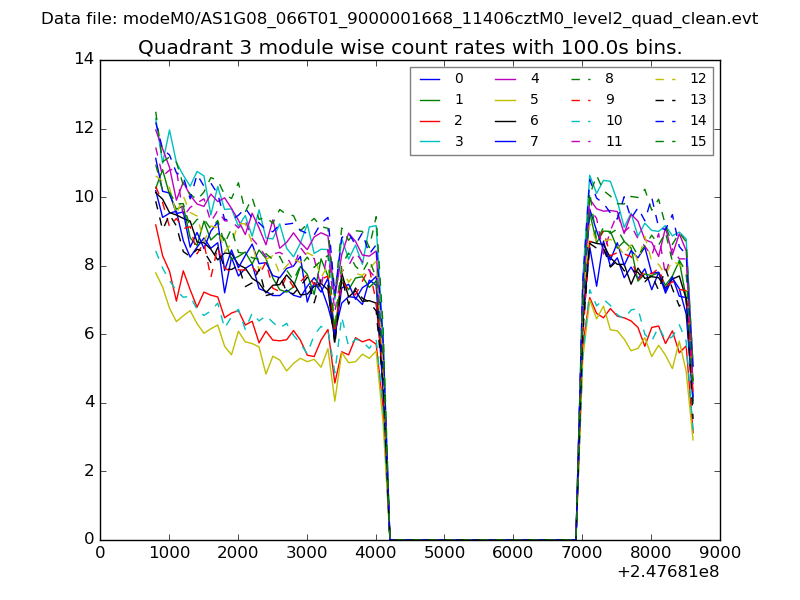 |
 |
| Parameter | Plot |
|---|---|
| CZT HV Monitor | 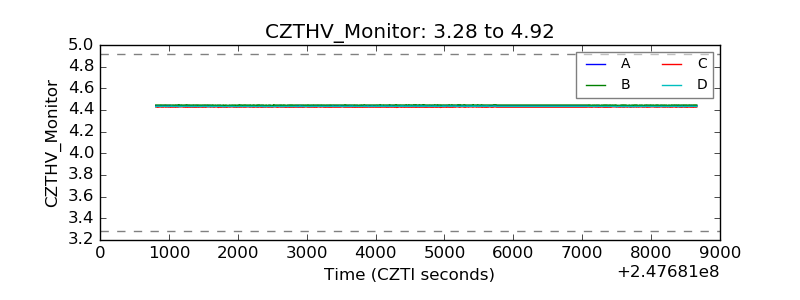 |
| D_VDD |  |
| Temperature 1 |  |
| Veto HV Monitor |  |
| Veto LLD |  |
| Alpha Counter | 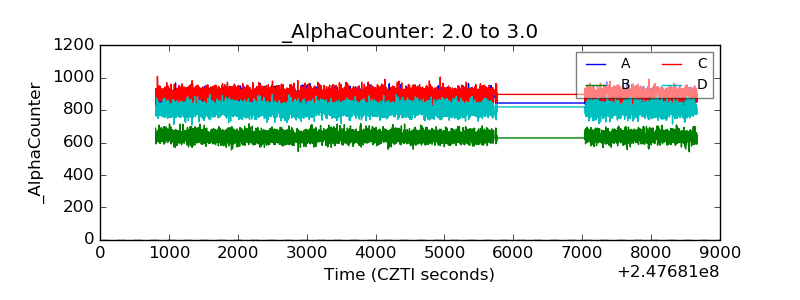 |
| _CPM_Rate | 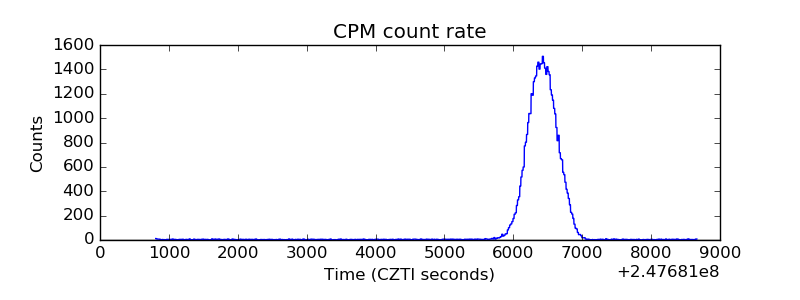 |
| CZT Counter |  |
| +2.5 Volts monitor |  |
| +5 Volts monitor |  |
| _ROLL_ROT | 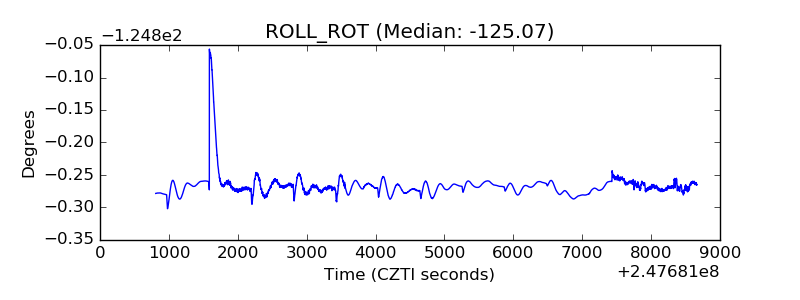 |
| _Roll_DEC | 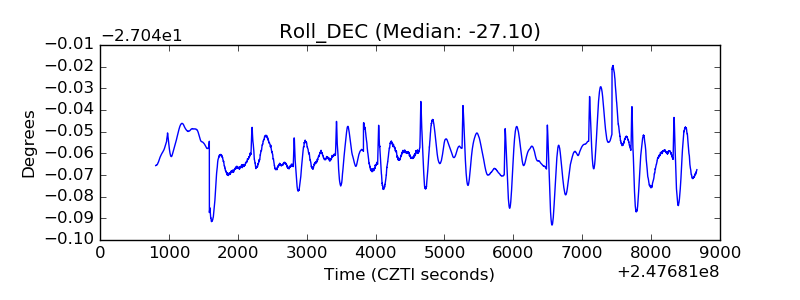 |
| _Roll_RA |  |
| Veto Counter | 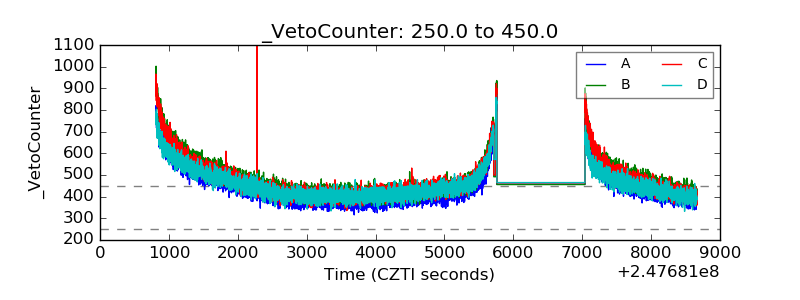 |