| Param | Original file | Final file |
|---|---|---|
| Filename | modeM0/AS1G08_066T01_9000001668_11407cztM0_level2.evt | modeM0/AS1G08_066T01_9000001668_11407cztM0_level2_quad_clean.evt |
| Size (bytes) | 473,558,400 | 90,118,080 |
| Size | 451.6 MB | 85.9 MB |
| Events in quadrant A | 3,283,528 | 584,290 |
| Events in quadrant B | 4,350,444 | 576,906 |
| Events in quadrant C | 2,984,275 | 569,689 |
| Events in quadrant D | 3,279,839 | 542,747 |
| Mode M0 | |||
|---|---|---|---|
| Quadrant | BADHDUFLAG | Total packets | Discarded packets |
| A | 0 | 14133 | 3 |
| B | 0 | 17214 | 2 |
| C | 0 | 13525 | 2 |
| D | 0 | 14457 | 2 |
| Mode SS | |||
|---|---|---|---|
| Quadrant | BADHDUFLAG | Total packets | Discarded packets |
| A | 0 | 134 | 0 |
| B | 0 | 134 | 0 |
| C | 0 | 134 | 0 |
| D | 0 | 134 | 0 |
| Mode M9 | |||
|---|---|---|---|
| Quadrant | BADHDUFLAG | Total packets | Discarded packets |
| A | 0 | 14 | 0 |
| B | 0 | 14 | 0 |
| C | 0 | 14 | 0 |
| D | 0 | 15 | 0 |
| Quadrant | Total seconds | Saturated seconds | Saturation percentage |
|---|---|---|---|
| A | 6526 | 97 | 1.486362% |
| B | 6526 | 368 | 5.638983% |
| C | 6526 | 17 | 0.260496% |
| D | 6526 | 103 | 1.578302% |
Noise dominated data is calculated using 1-second bins in cleaned event files. If a bin has >2000 counts, and if more than 50% of those come from <1% of pixels, then it is considered to be noise-dominated and hence unusable.
| Quadrant | # 1 sec bins | Bins with >0 counts | Bins with >2000 counts | High rate bins dominated by noise | Noise dominated (total time) | Noise dominated (detector-on time) | Marked lightcurve |
|---|---|---|---|---|---|---|---|
| A | 7657 | 6527 | 8 | 8 | 0.10% | 0.12% | 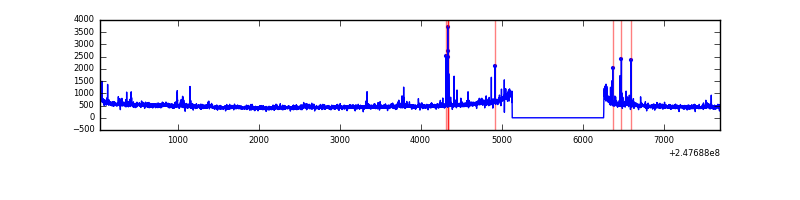 |
| B | 7657 | 6527 | 169 | 169 | 2.21% | 2.59% | 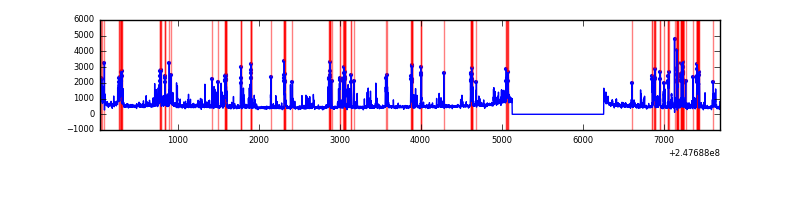 |
| C | 7657 | 6527 | 0 | 0 | 0.00% | 0.00% | 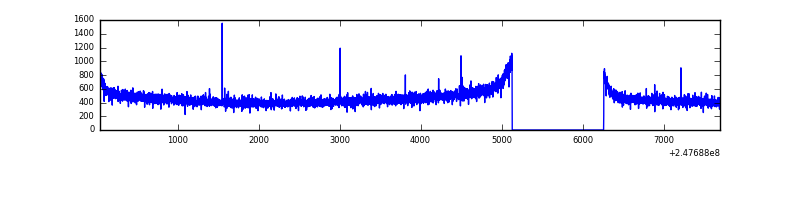 |
| D | 7657 | 6527 | 66 | 66 | 0.86% | 1.01% | 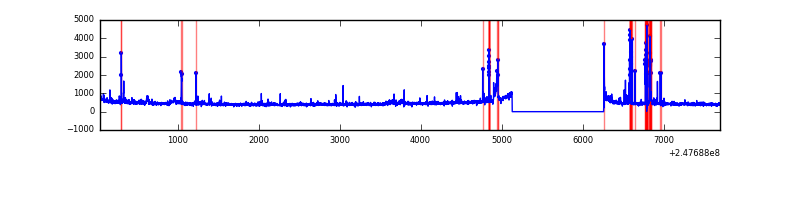 |
Top three noisy pixels from each quadrant. If the there are fewer than three noisy pixels in the level2.evt file, extra rows are filled as -1
| Pixel properties | Quadrant properties | ||||||
|---|---|---|---|---|---|---|---|
| Quadrant | DetID | PixID | Counts | Sigma | Mean | Median | Sigma |
| A | 8 | 5 | 111202 | 680.7 | 795 | 778 | 162.2 |
| A | 1 | 162 | 28030 | 167.99 | 795 | 778 | 162.2 |
| A | 11 | 29 | 27444 | 164.38 | 795 | 778 | 162.2 |
| B | 4 | 239 | 1119239 | 7475.37 | 786 | 769 | 149.6 |
| B | 15 | 204 | 54085 | 356.34 | 786 | 769 | 149.6 |
| B | 3 | 189 | 32788 | 214.0 | 786 | 769 | 149.6 |
| C | 13 | 61 | 5712 | 27.88 | 764 | 769 | 177.3 |
| C | 14 | 234 | 2721 | 11.01 | 764 | 769 | 177.3 |
| C | 3 | 202 | 1860 | 6.15 | 764 | 769 | 177.3 |
| D | 10 | 253 | 176793 | 965.94 | 756 | 733 | 182.3 |
| D | 2 | 120 | 94126 | 512.39 | 756 | 733 | 182.3 |
| D | 13 | 172 | 37126 | 199.67 | 756 | 733 | 182.3 |
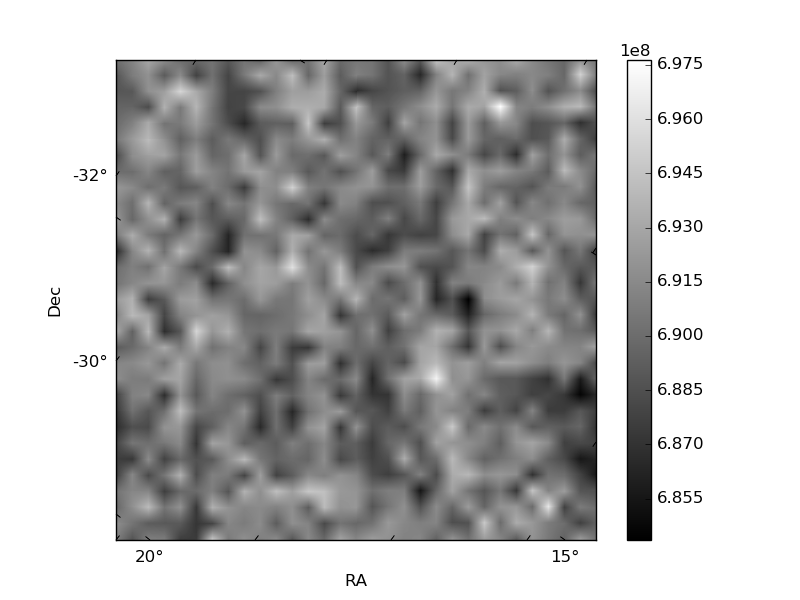
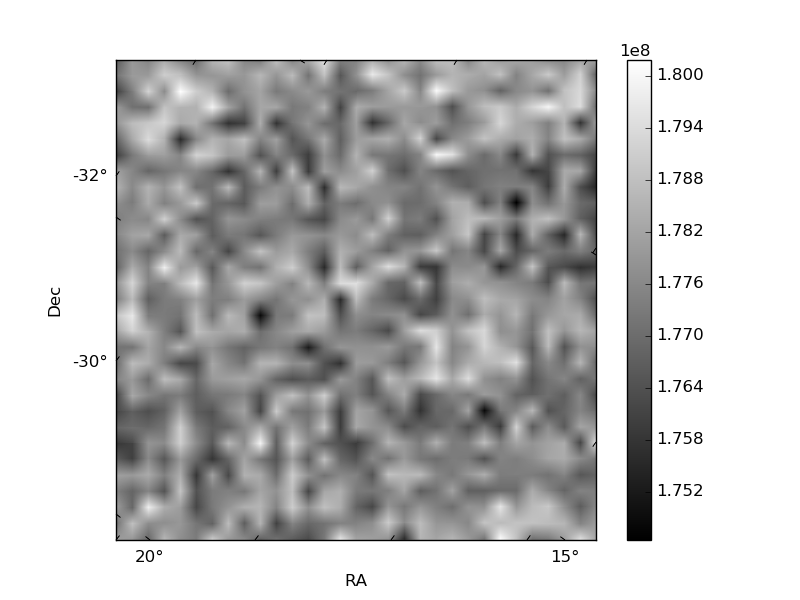
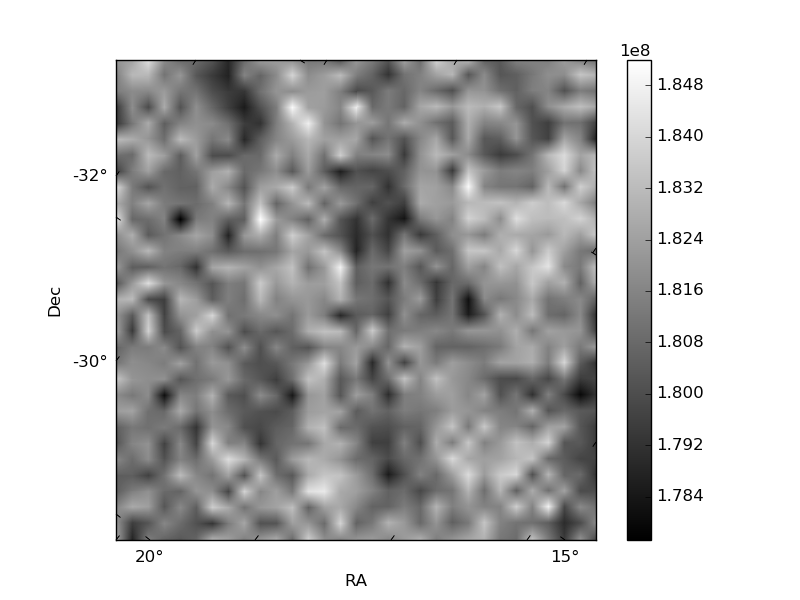
Histogram calculated using DETX and DETY for each event in the final _common_clean file
| Quadrant A | 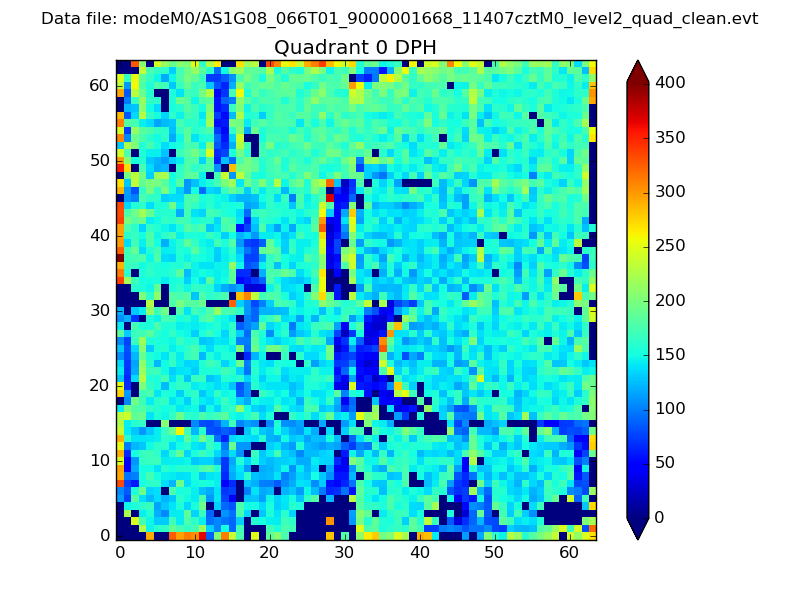 |
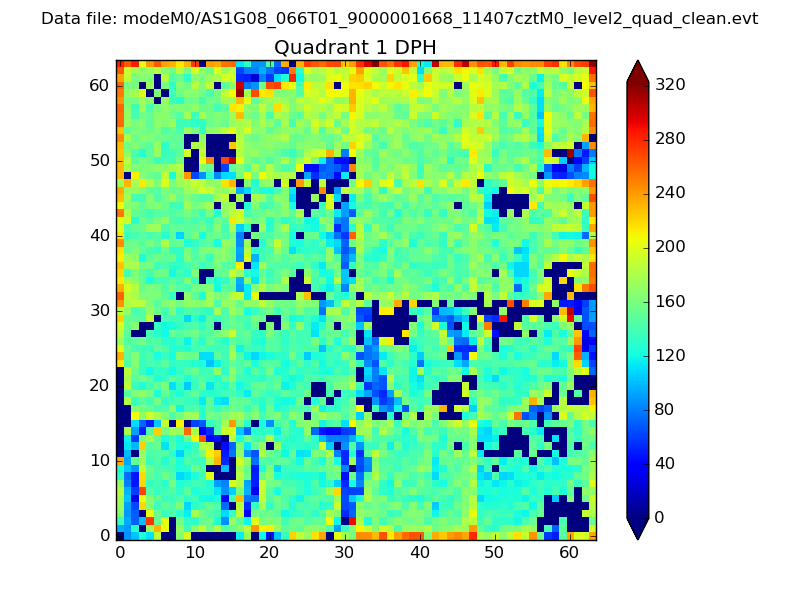 |
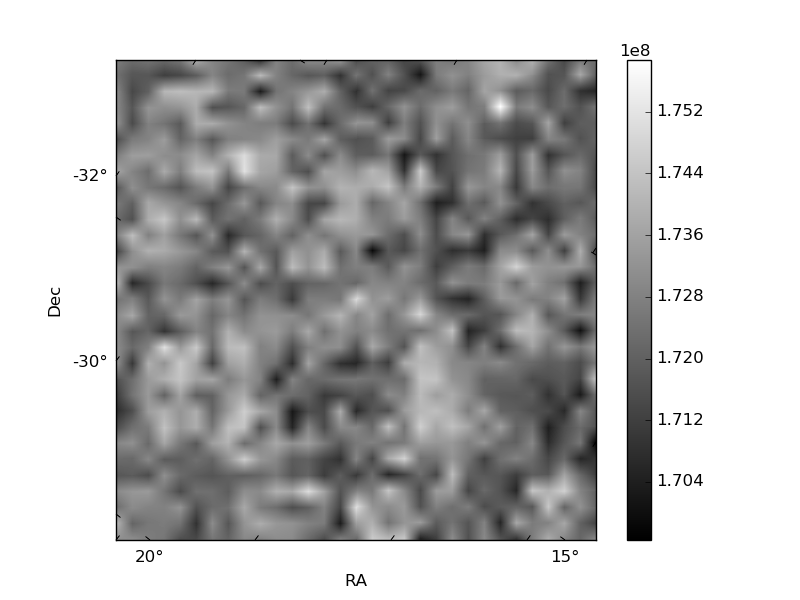
Quadrant B |
|---|---|---|---|
| Quadrant D | 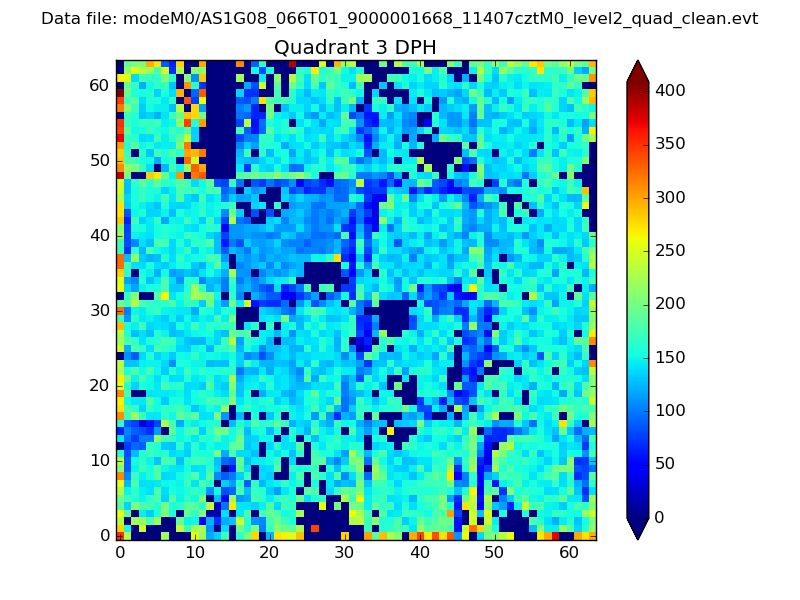 |
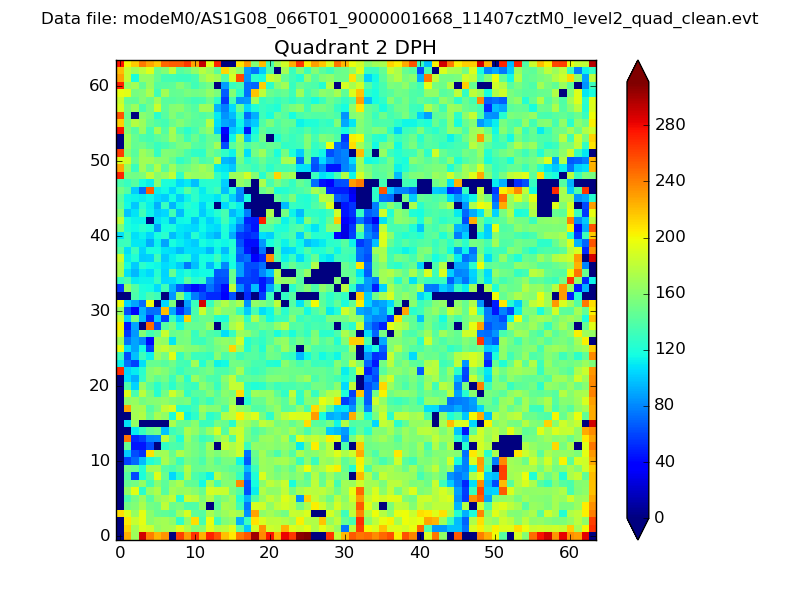 |
Quadrant C |
| Plot type | Count rate plots | Images |
|---|---|---|
| Comparison with Poisson distribution Blue bars denote a histogram of data divided into 1 sec bins. Red curve is a Poisson curve with rate = median count rate of data. |
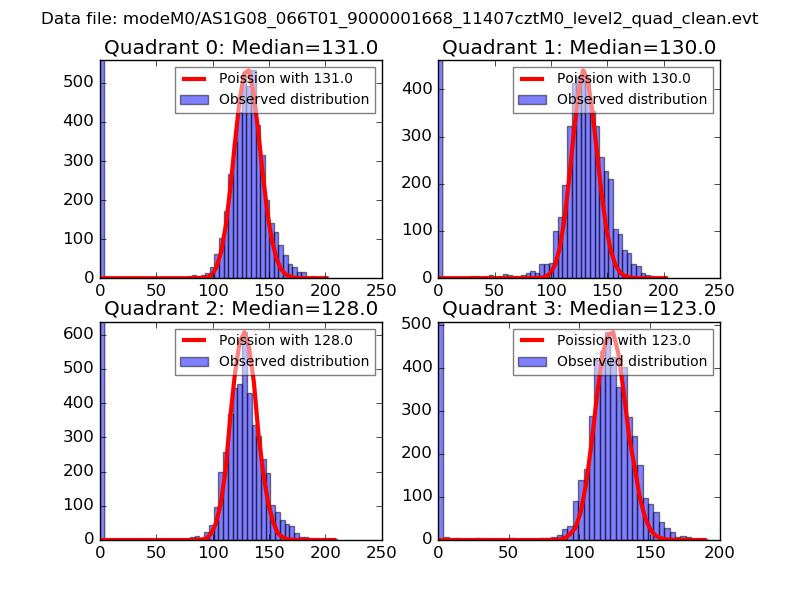 |
 |
| Quadrant-wise count rates Data is divided into 100 sec bins |
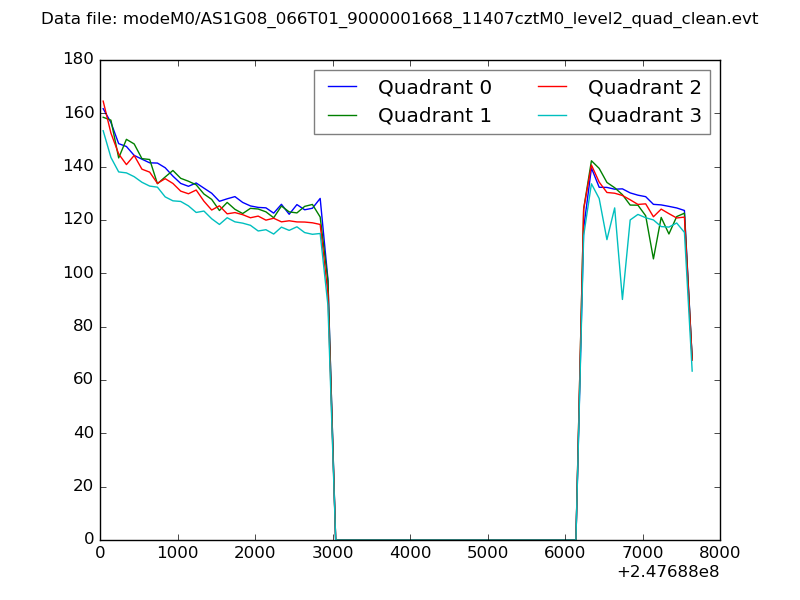 |
|
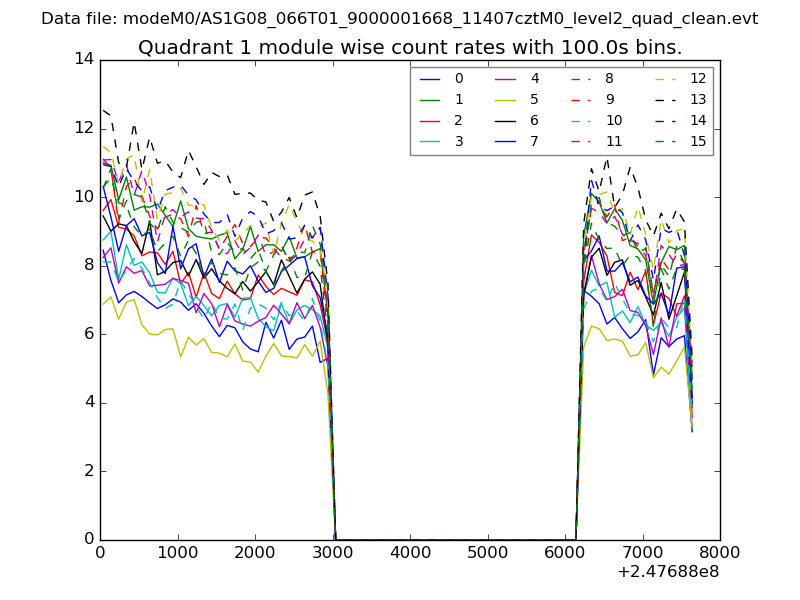
| Module-wise count rates for Quadrant A Data is divided into 100 sec bins |
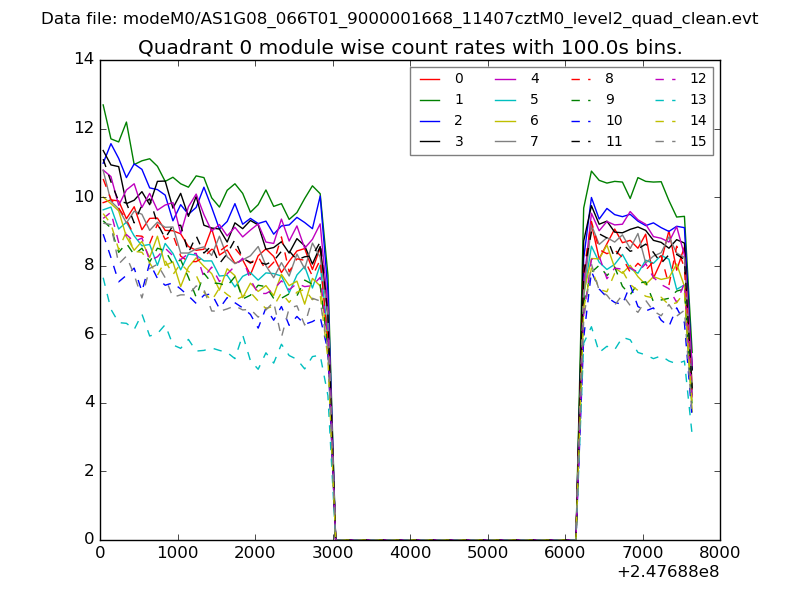 |
 |
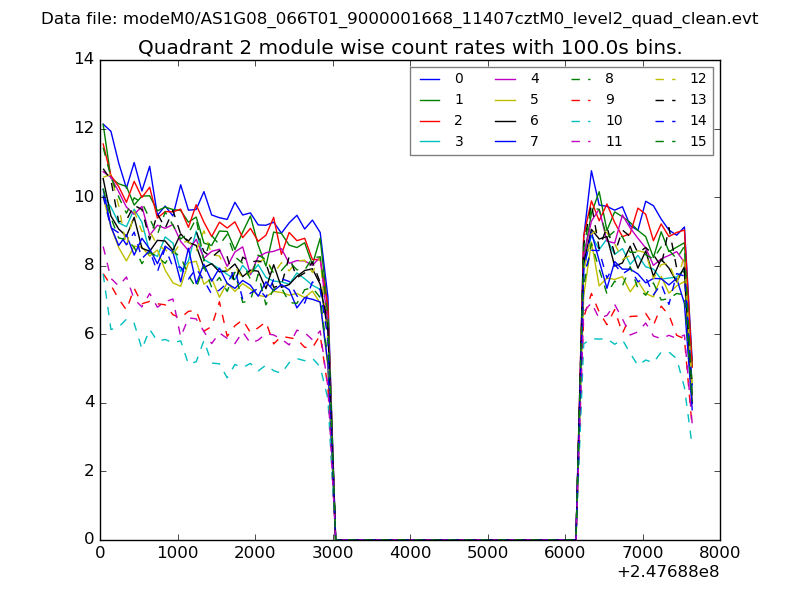
| Module-wise count rates for Quadrant B Data is divided into 100 sec bins |
 |
 |
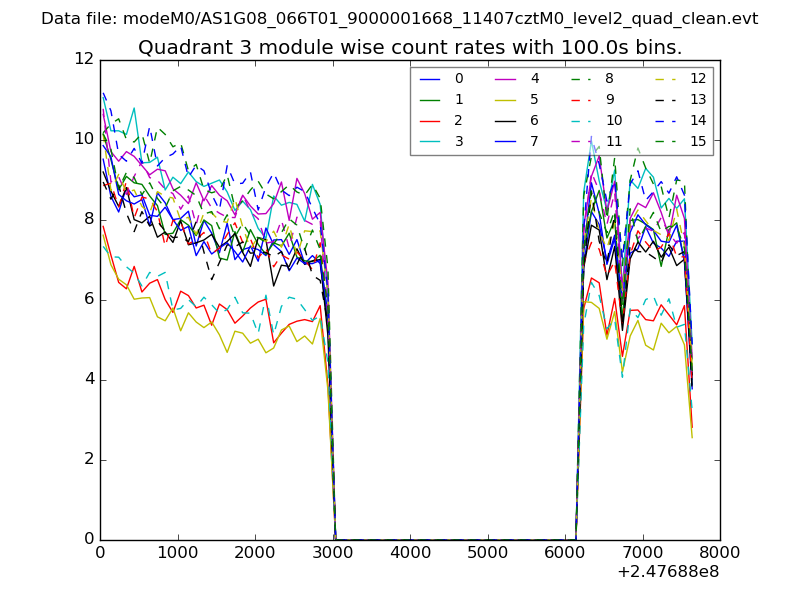
| Module-wise count rates for Quadrant C Data is divided into 100 sec bins |
 |
 |
| Module-wise count rates for Quadrant D Data is divided into 100 sec bins |
 |
 |
| Parameter | Plot |
|---|---|
| CZT HV Monitor | 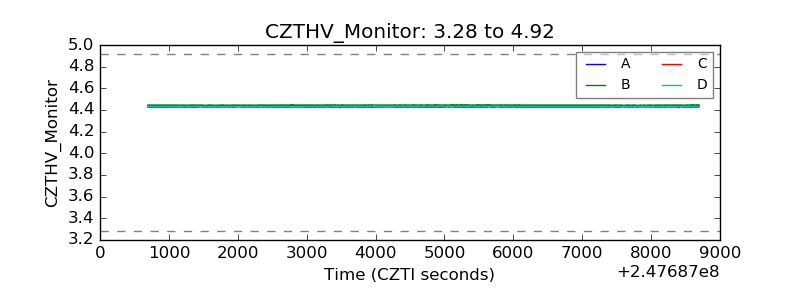 |
| D_VDD | 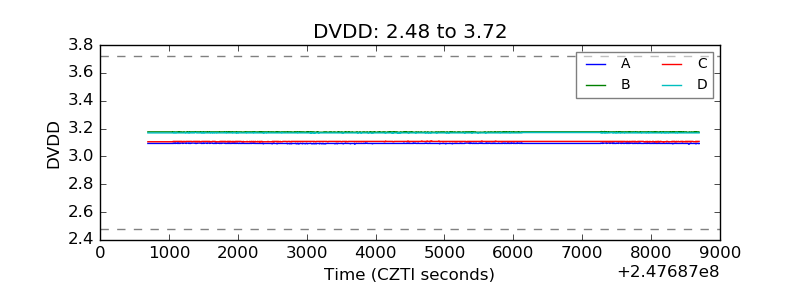 |
| Temperature 1 | 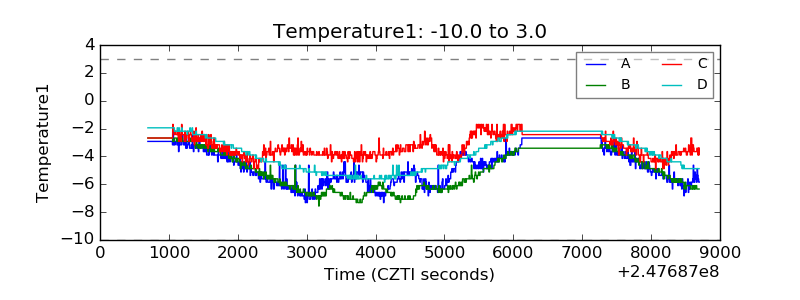 |
| Veto HV Monitor | 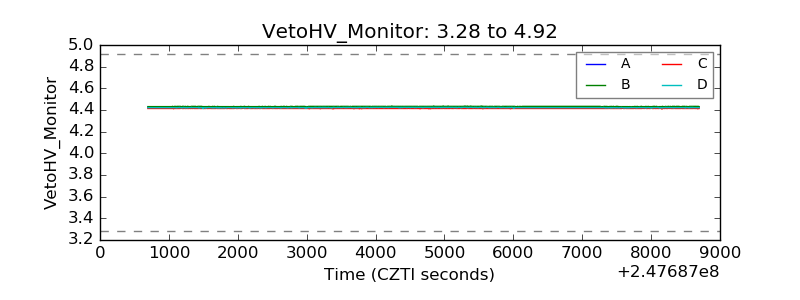 |
| Veto LLD |  |
| Alpha Counter | 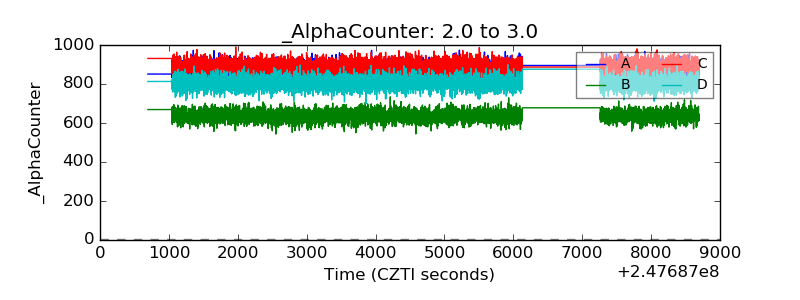 |
| _CPM_Rate | 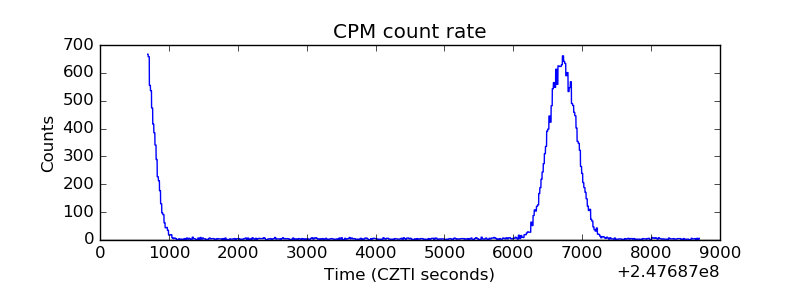 |
| CZT Counter | 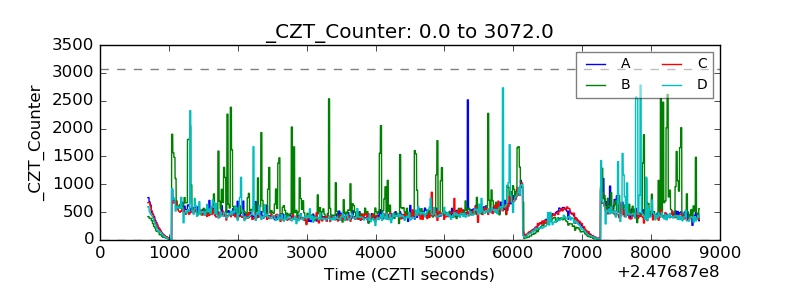 |
| +2.5 Volts monitor |  |
| +5 Volts monitor |  |
| _ROLL_ROT | 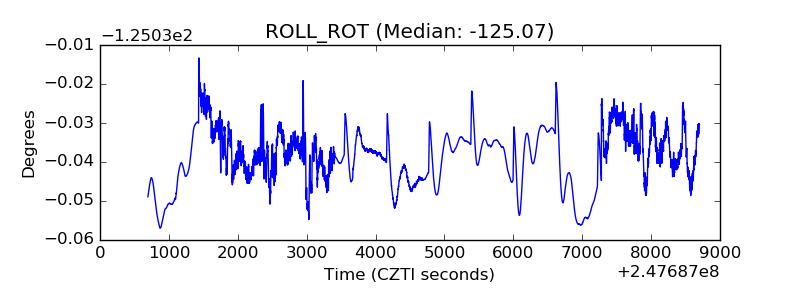 |
| _Roll_DEC | 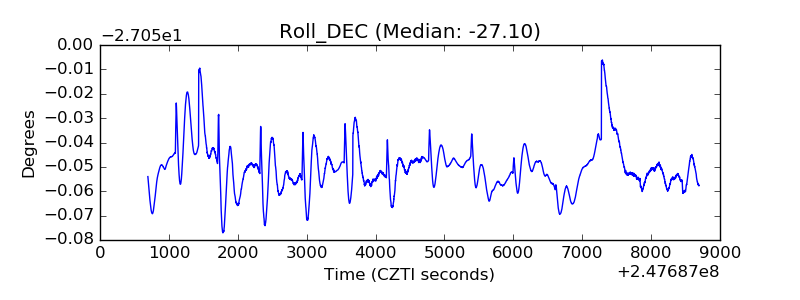 |
| _Roll_RA | 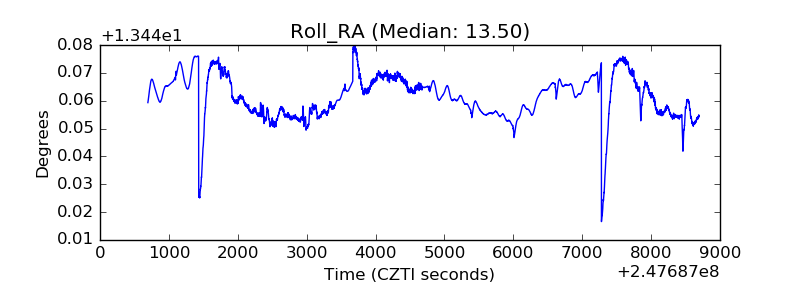 |
| Veto Counter | 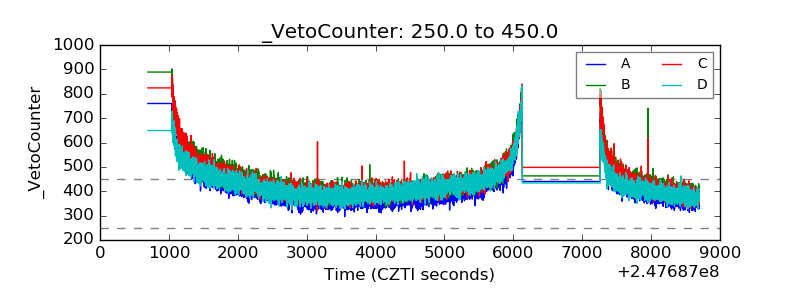 |