| Param | Original file | Final file |
|---|---|---|
| Filename | modeM0/AS1G08_066T01_9000001668_11408cztM0_level2.evt | modeM0/AS1G08_066T01_9000001668_11408cztM0_level2_quad_clean.evt |
| Size (bytes) | 488,329,920 | 93,205,440 |
| Size | 465.7 MB | 88.9 MB |
| Events in quadrant A | 3,379,944 | 598,443 |
| Events in quadrant B | 4,330,976 | 591,195 |
| Events in quadrant C | 3,060,775 | 589,093 |
| Events in quadrant D | 3,546,964 | 561,247 |
| Mode M0 | |||
|---|---|---|---|
| Quadrant | BADHDUFLAG | Total packets | Discarded packets |
| A | 0 | 14707 | 3 |
| B | 0 | 17502 | 2 |
| C | 0 | 14099 | 2 |
| D | 0 | 15569 | 2 |
| Mode SS | |||
|---|---|---|---|
| Quadrant | BADHDUFLAG | Total packets | Discarded packets |
| A | 0 | 140 | 0 |
| B | 0 | 140 | 0 |
| C | 0 | 140 | 0 |
| D | 0 | 140 | 0 |
| Mode M9 | |||
|---|---|---|---|
| Quadrant | BADHDUFLAG | Total packets | Discarded packets |
| A | 0 | 16 | 0 |
| B | 0 | 16 | 0 |
| C | 0 | 16 | 0 |
| D | 0 | 17 | 0 |
| Quadrant | Total seconds | Saturated seconds | Saturation percentage |
|---|---|---|---|
| A | 6927 | 44 | 0.635196% |
| B | 6927 | 284 | 4.099899% |
| C | 6927 | 10 | 0.144363% |
| D | 6927 | 155 | 2.237621% |
Noise dominated data is calculated using 1-second bins in cleaned event files. If a bin has >2000 counts, and if more than 50% of those come from <1% of pixels, then it is considered to be noise-dominated and hence unusable.
| Quadrant | # 1 sec bins | Bins with >0 counts | Bins with >2000 counts | High rate bins dominated by noise | Noise dominated (total time) | Noise dominated (detector-on time) | Marked lightcurve |
|---|---|---|---|---|---|---|---|
| A | 7777 | 6928 | 7 | 7 | 0.09% | 0.10% | 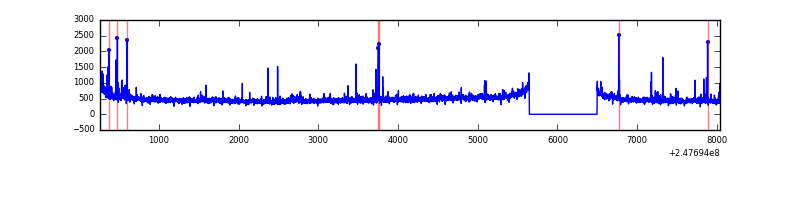 |
| B | 7777 | 6928 | 156 | 156 | 2.01% | 2.25% | 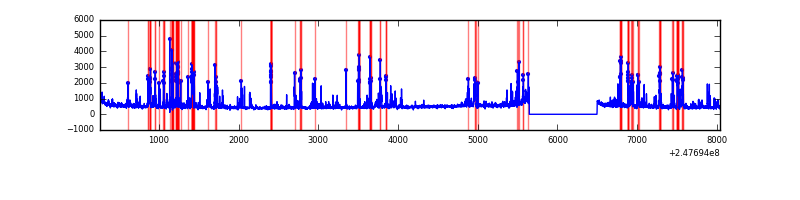 |
| C | 7777 | 6928 | 0 | 0 | 0.00% | 0.00% | 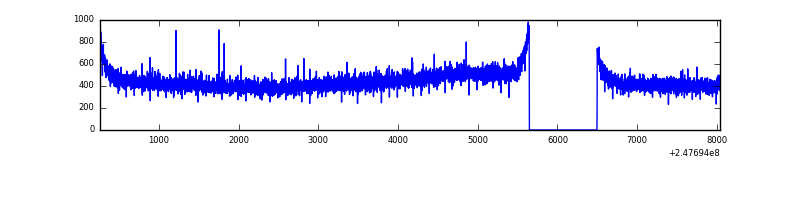 |
| D | 7777 | 6928 | 126 | 126 | 1.62% | 1.82% | 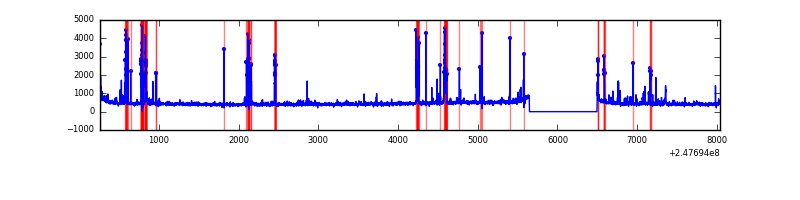 |
Top three noisy pixels from each quadrant. If the there are fewer than three noisy pixels in the level2.evt file, extra rows are filled as -1
| Pixel properties | Quadrant properties | ||||||
|---|---|---|---|---|---|---|---|
| Quadrant | DetID | PixID | Counts | Sigma | Mean | Median | Sigma |
| A | 8 | 5 | 119499 | 712.5 | 812 | 796 | 166.6 |
| A | 11 | 29 | 44427 | 261.89 | 812 | 796 | 166.6 |
| A | 1 | 162 | 34085 | 199.81 | 812 | 796 | 166.6 |
| B | 4 | 239 | 1042161 | 6801.03 | 806 | 786 | 153.1 |
| B | 3 | 189 | 37114 | 237.25 | 806 | 786 | 153.1 |
| B | 15 | 204 | 34876 | 222.64 | 806 | 786 | 153.1 |
| C | 13 | 61 | 5640 | 26.48 | 785 | 789 | 183.2 |
| C | 3 | 202 | 1958 | 6.38 | 785 | 789 | 183.2 |
| C | -1 | -1 | -1 | -1.0 | 785 | 789 | 183.2 |
| D | 10 | 253 | 396555 | 2160.31 | 766 | 746 | 183.2 |
| D | 1 | 52 | 59073 | 318.35 | 766 | 746 | 183.2 |
| D | 2 | 120 | 31955 | 170.34 | 766 | 746 | 183.2 |
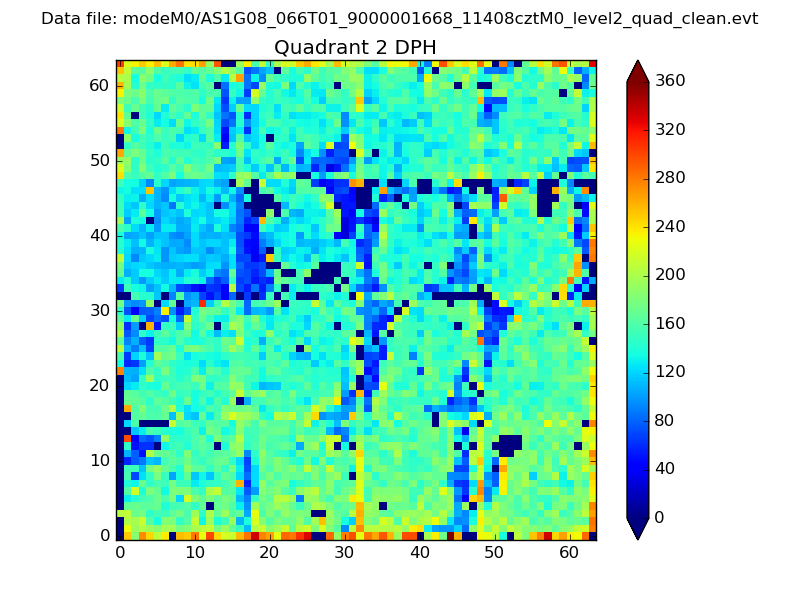
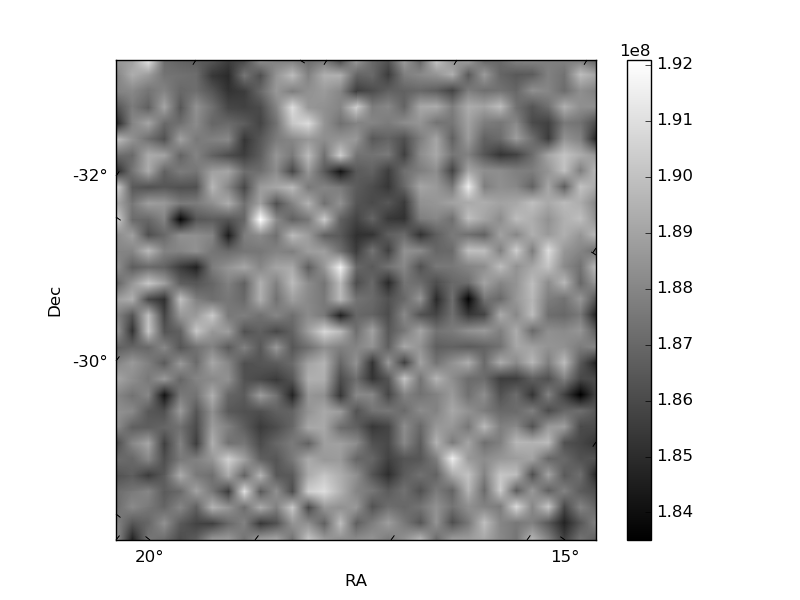
Histogram calculated using DETX and DETY for each event in the final _common_clean file
| Quadrant A | 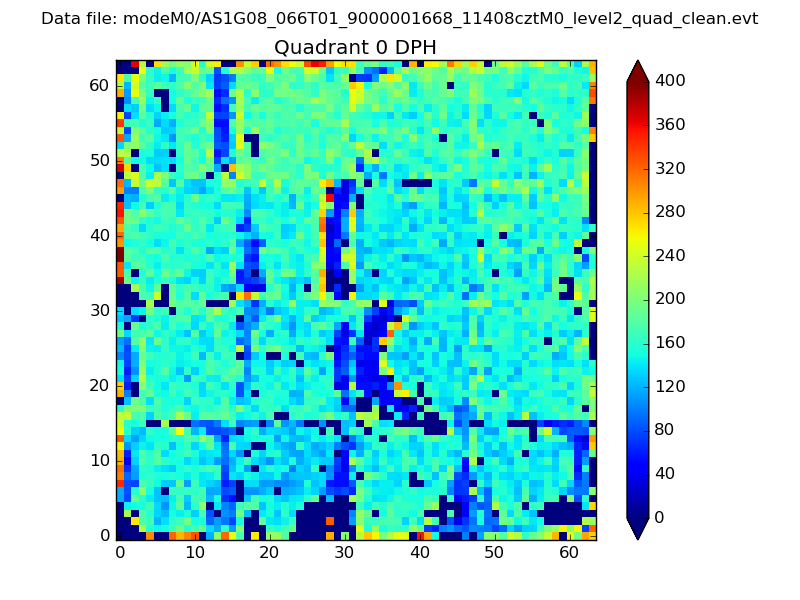 |
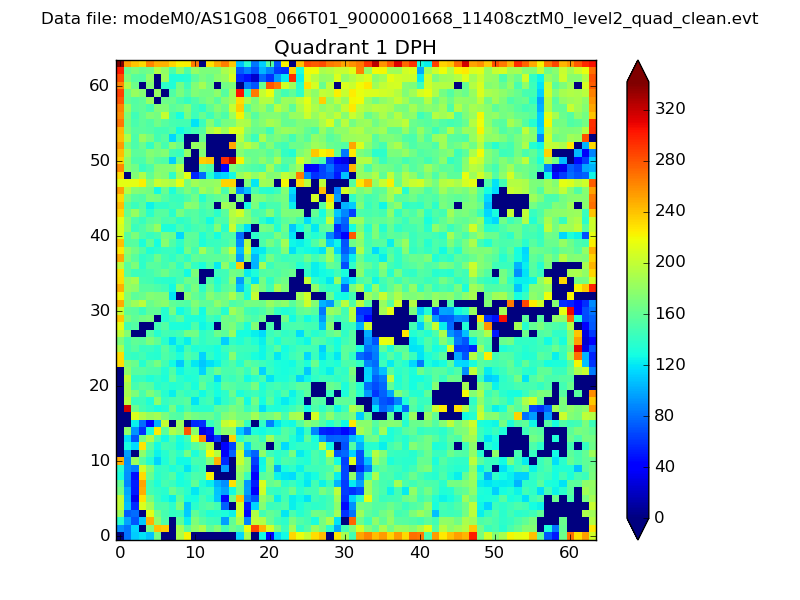 |
Quadrant B |
|---|---|---|---|
| Quadrant D | 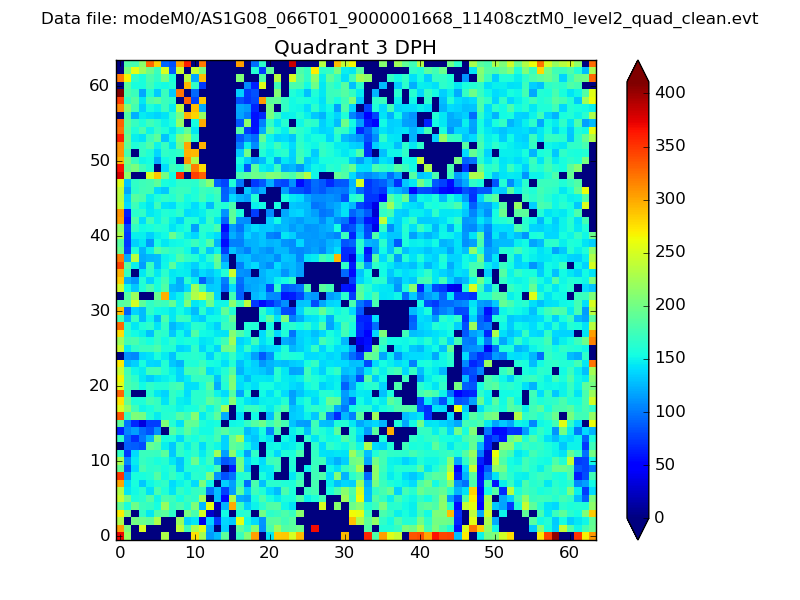 |
 |
Quadrant C |
| Plot type | Count rate plots | Images |
|---|---|---|
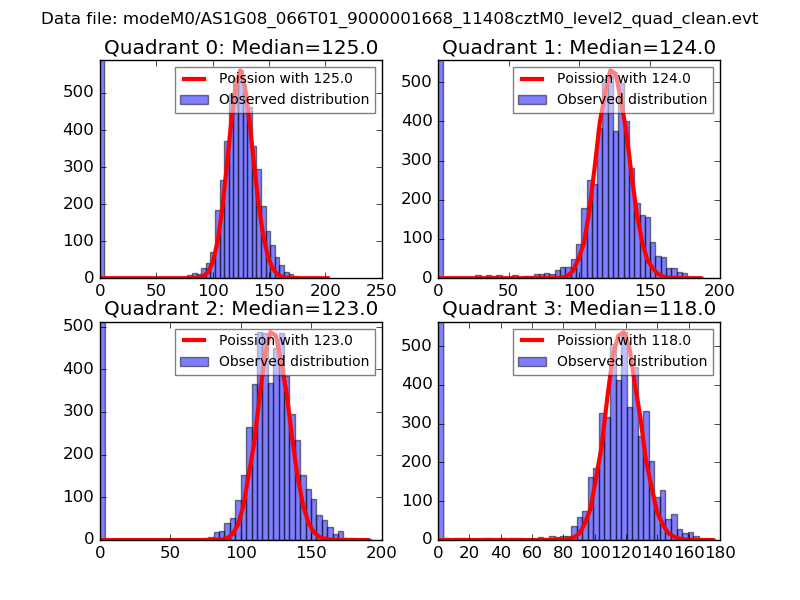
| Comparison with Poisson distribution Blue bars denote a histogram of data divided into 1 sec bins. Red curve is a Poisson curve with rate = median count rate of data. |
 |
 |
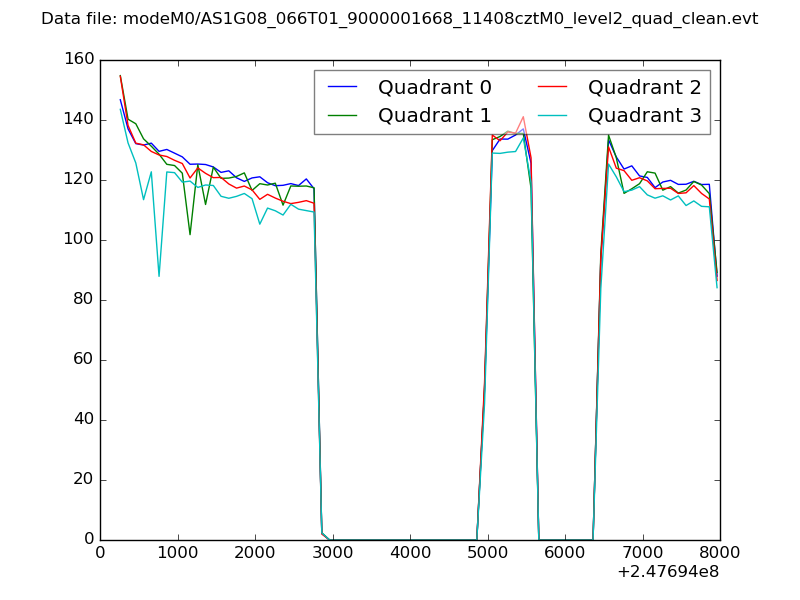
| Quadrant-wise count rates Data is divided into 100 sec bins |
 |
|
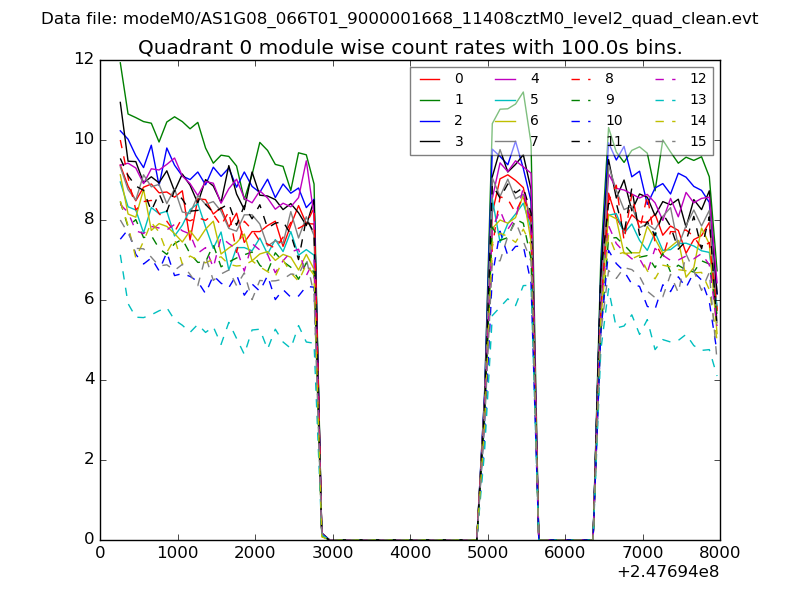
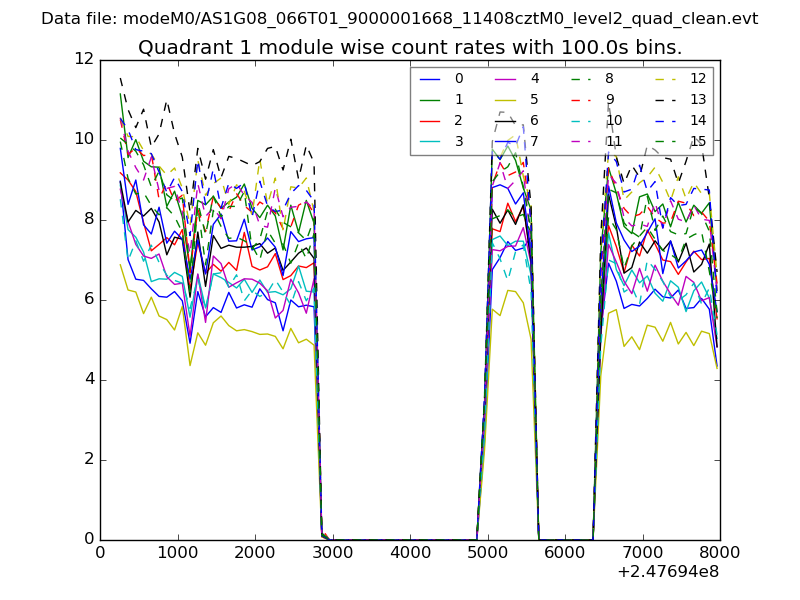
| Module-wise count rates for Quadrant A Data is divided into 100 sec bins |
 |
 |
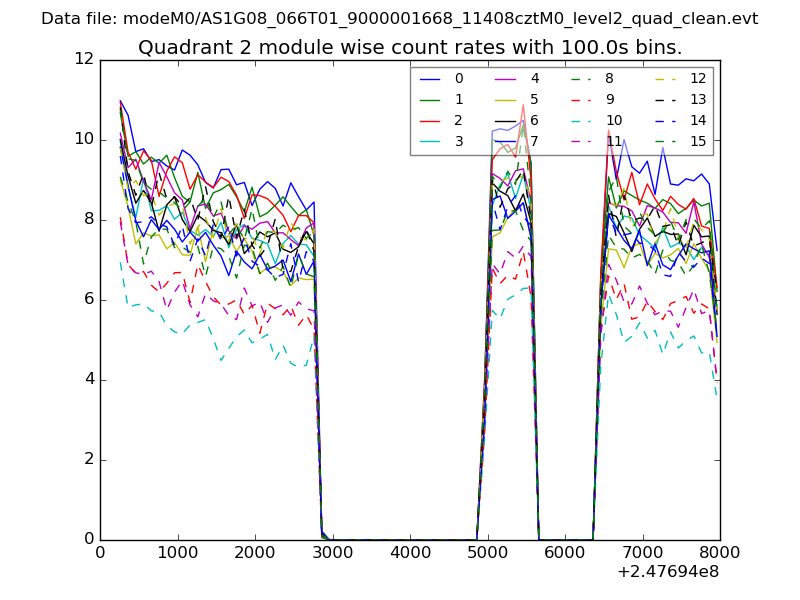
| Module-wise count rates for Quadrant B Data is divided into 100 sec bins |
 |
 |
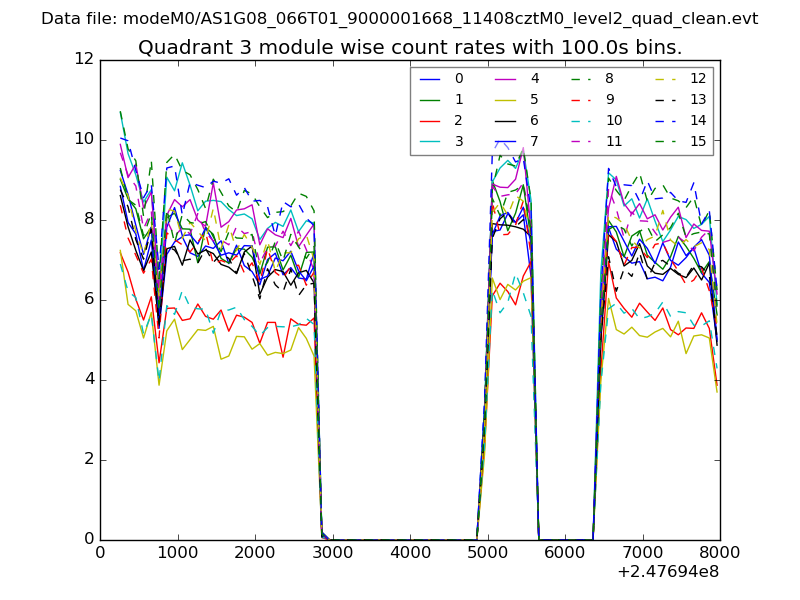
| Module-wise count rates for Quadrant C Data is divided into 100 sec bins |
 |
 |
| Module-wise count rates for Quadrant D Data is divided into 100 sec bins |
 |
 |
| Parameter | Plot |
|---|---|
| CZT HV Monitor | 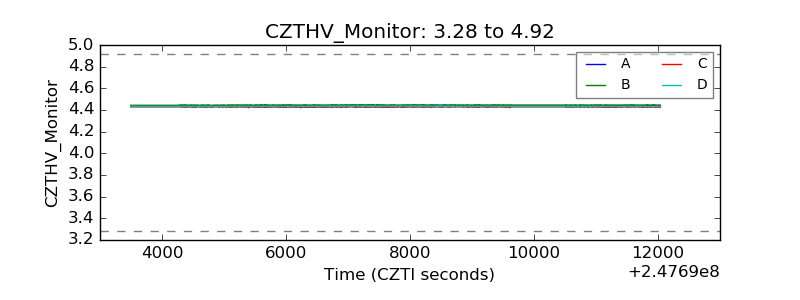 |
| D_VDD | 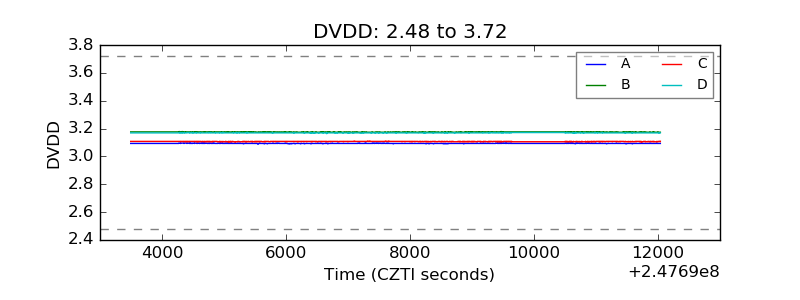 |
| Temperature 1 | 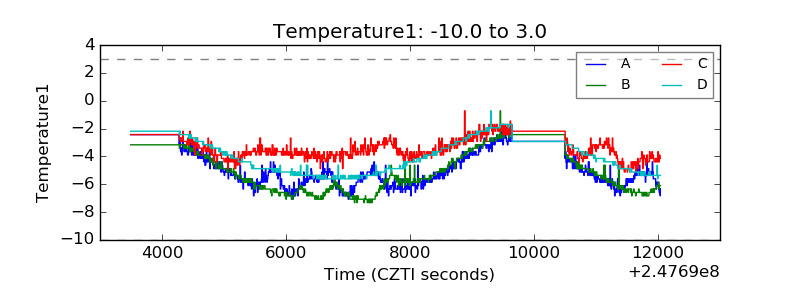 |
| Veto HV Monitor |  |
| Veto LLD | 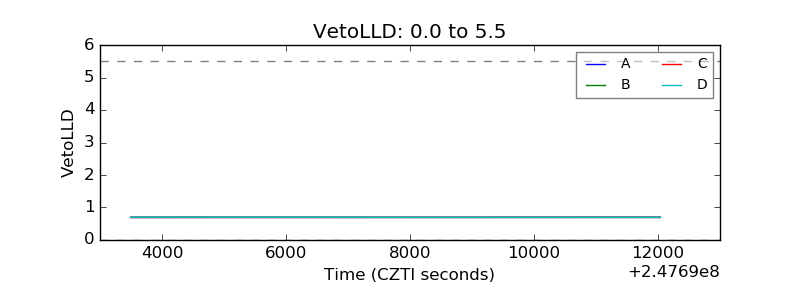 |
| Alpha Counter | 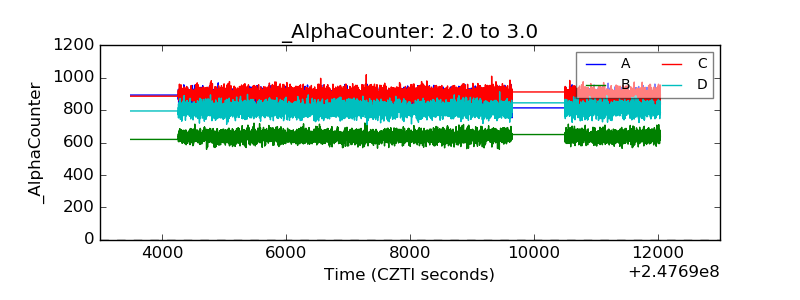 |
| _CPM_Rate | 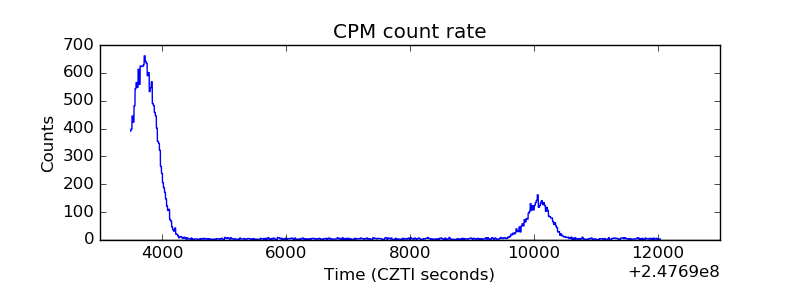 |
| CZT Counter | 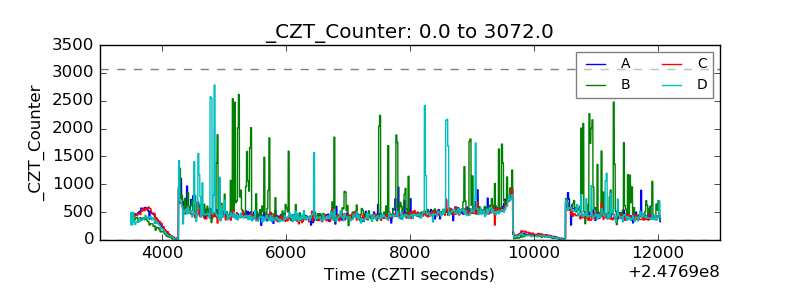 |
| +2.5 Volts monitor |  |
| +5 Volts monitor | 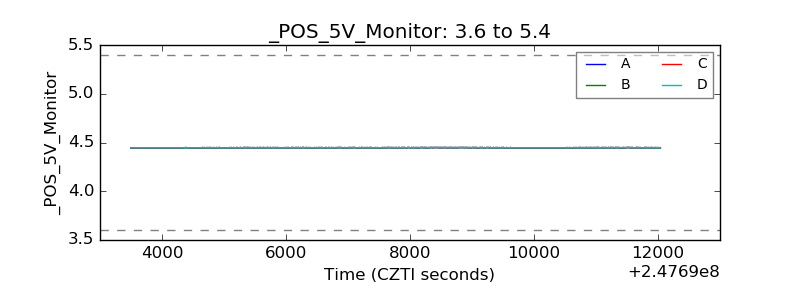 |
| _ROLL_ROT | 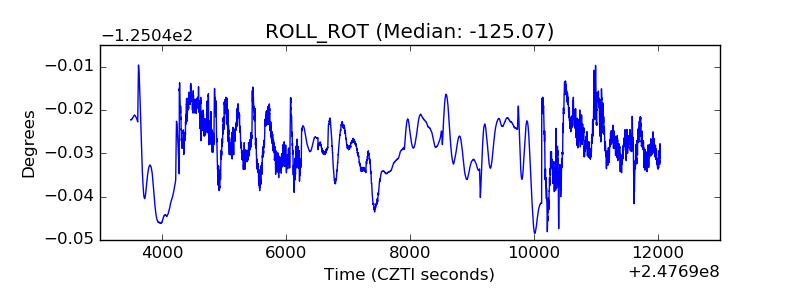 |
| _Roll_DEC | 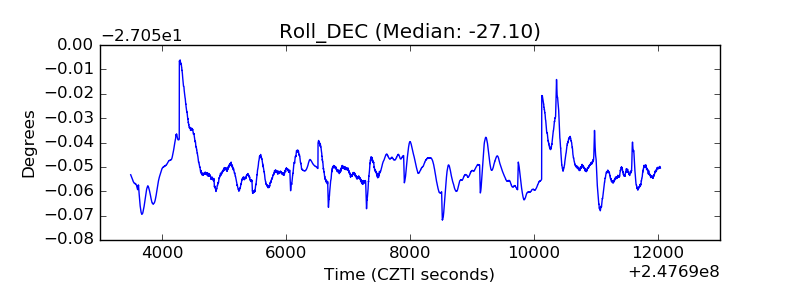 |
| _Roll_RA | 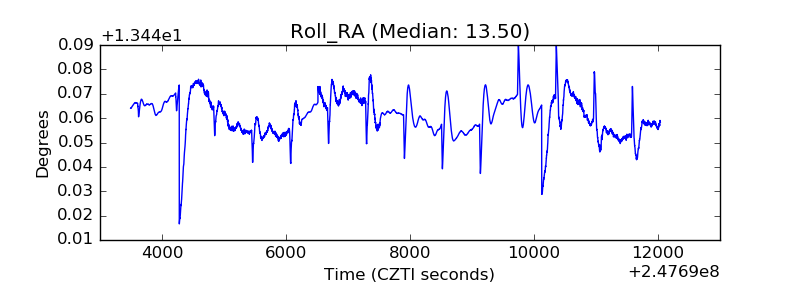 |
| Veto Counter | 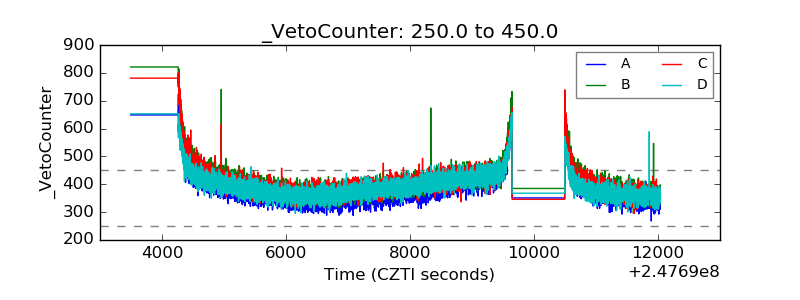 |