| Param | Original file | Final file |
|---|---|---|
| Filename | modeM0/AS1G08_066T01_9000001668_11410cztM0_level2.evt | modeM0/AS1G08_066T01_9000001668_11410cztM0_level2_quad_clean.evt |
| Size (bytes) | 590,411,520 | 105,076,800 |
| Size | 563.1 MB | 100.2 MB |
| Events in quadrant A | 3,842,974 | 677,147 |
| Events in quadrant B | 5,587,511 | 658,682 |
| Events in quadrant C | 3,470,256 | 668,130 |
| Events in quadrant D | 4,446,607 | 631,533 |
| Mode M0 | |||
|---|---|---|---|
| Quadrant | BADHDUFLAG | Total packets | Discarded packets |
| A | 0 | 16764 | 4 |
| B | 0 | 21967 | 3 |
| C | 0 | 16089 | 3 |
| D | 0 | 18957 | 3 |
| Mode SS | |||
|---|---|---|---|
| Quadrant | BADHDUFLAG | Total packets | Discarded packets |
| A | 0 | 162 | 0 |
| B | 0 | 162 | 0 |
| C | 0 | 162 | 0 |
| D | 0 | 162 | 0 |
| Mode M9 | |||
|---|---|---|---|
| Quadrant | BADHDUFLAG | Total packets | Discarded packets |
| A | 0 | 5 | 0 |
| B | 0 | 5 | 0 |
| C | 0 | 5 | 0 |
| D | 0 | 5 | 0 |
| Quadrant | Total seconds | Saturated seconds | Saturation percentage |
|---|---|---|---|
| A | 7858 | 75 | 0.954441% |
| B | 7858 | 608 | 7.737338% |
| C | 7858 | 31 | 0.394502% |
| D | 7858 | 310 | 3.945024% |
Noise dominated data is calculated using 1-second bins in cleaned event files. If a bin has >2000 counts, and if more than 50% of those come from <1% of pixels, then it is considered to be noise-dominated and hence unusable.
| Quadrant | # 1 sec bins | Bins with >0 counts | Bins with >2000 counts | High rate bins dominated by noise | Noise dominated (total time) | Noise dominated (detector-on time) | Marked lightcurve |
|---|---|---|---|---|---|---|---|
| A | 8438 | 7862 | 12 | 12 | 0.14% | 0.15% | 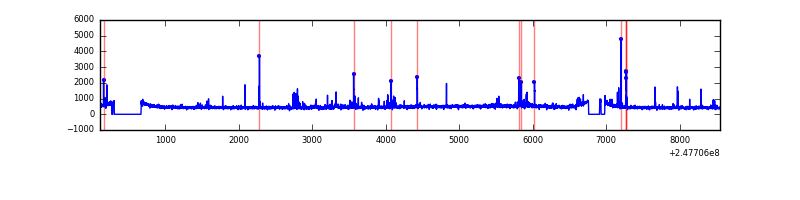 |
| B | 8438 | 7862 | 315 | 315 | 3.73% | 4.01% | 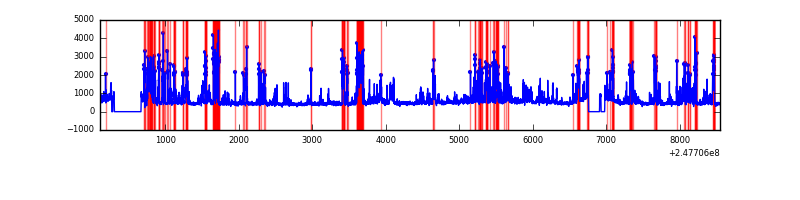 |
| C | 8438 | 7862 | 0 | 0 | 0.00% | 0.00% | 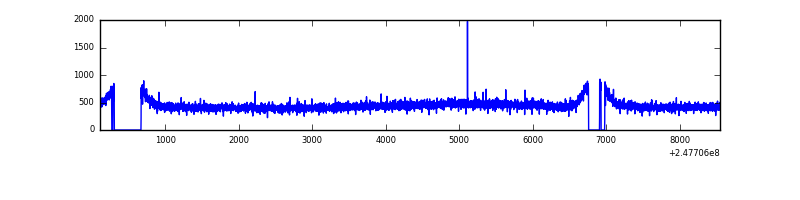 |
| D | 8438 | 7861 | 260 | 260 | 3.08% | 3.31% | 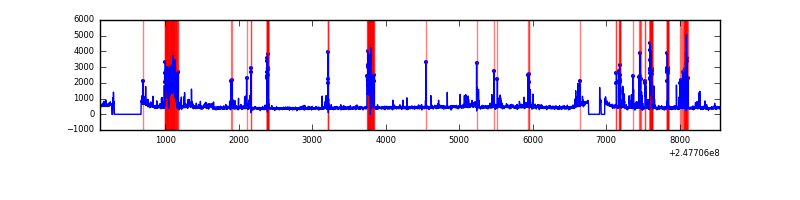 |
Top three noisy pixels from each quadrant. If the there are fewer than three noisy pixels in the level2.evt file, extra rows are filled as -1
| Pixel properties | Quadrant properties | ||||||
|---|---|---|---|---|---|---|---|
| Quadrant | DetID | PixID | Counts | Sigma | Mean | Median | Sigma |
| A | 8 | 5 | 198562 | 1053.05 | 914 | 891 | 187.7 |
| A | 11 | 29 | 35209 | 182.82 | 914 | 891 | 187.7 |
| A | 1 | 162 | 31526 | 163.2 | 914 | 891 | 187.7 |
| B | 4 | 239 | 1691670 | 9693.59 | 898 | 873 | 174.4 |
| B | 3 | 64 | 147495 | 840.61 | 898 | 873 | 174.4 |
| B | 3 | 189 | 125760 | 716.0 | 898 | 873 | 174.4 |
| C | 13 | 61 | 6510 | 27.19 | 889 | 892 | 206.6 |
| C | 14 | 234 | 4624 | 18.06 | 889 | 892 | 206.6 |
| C | 3 | 202 | 2152 | 6.1 | 889 | 892 | 206.6 |
| D | 10 | 253 | 624651 | 2958.33 | 866 | 840 | 210.9 |
| D | 13 | 152 | 350036 | 1656.01 | 866 | 840 | 210.9 |
| D | 2 | 120 | 64440 | 301.61 | 866 | 840 | 210.9 |
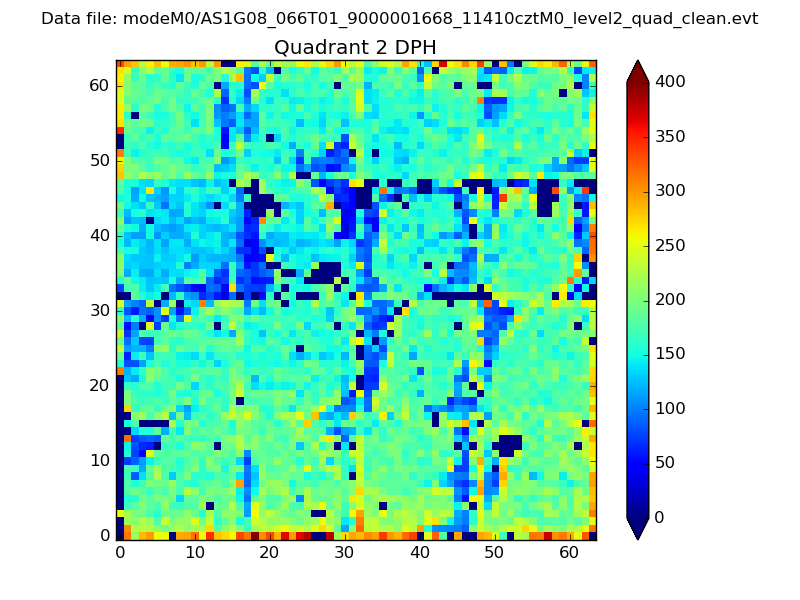
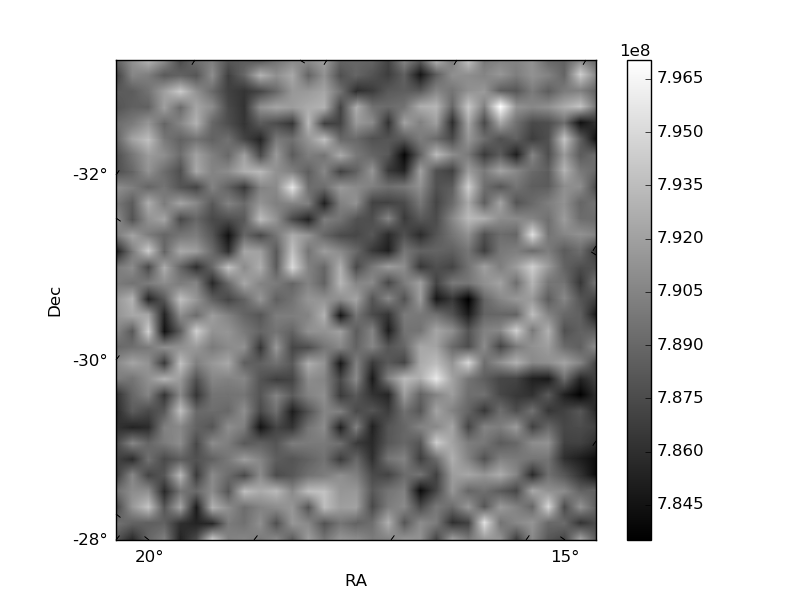
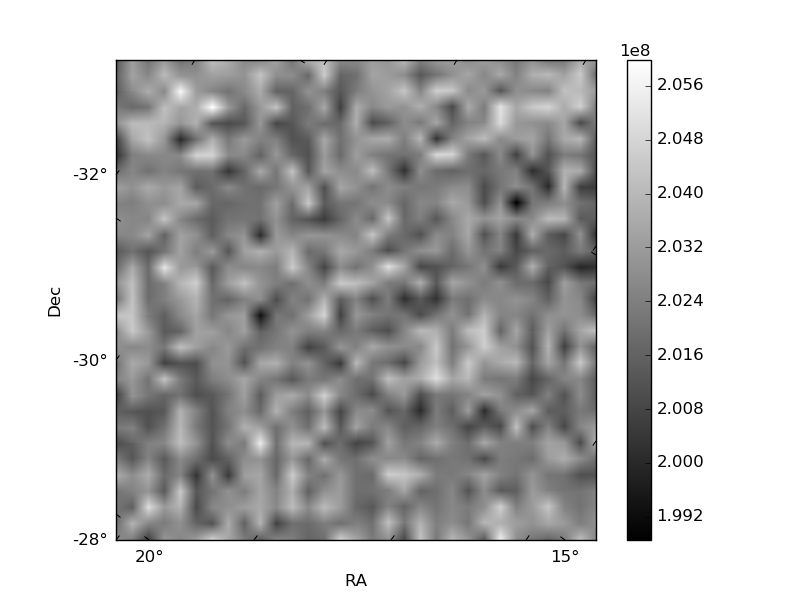
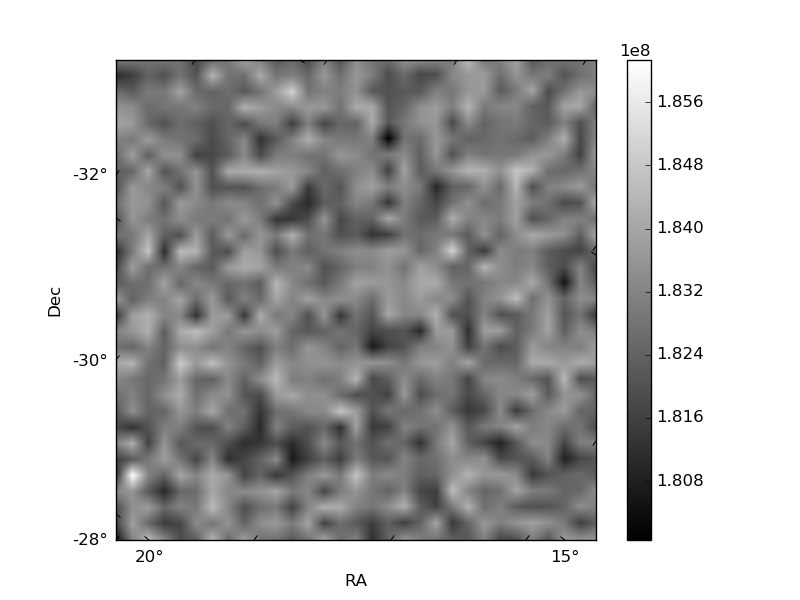
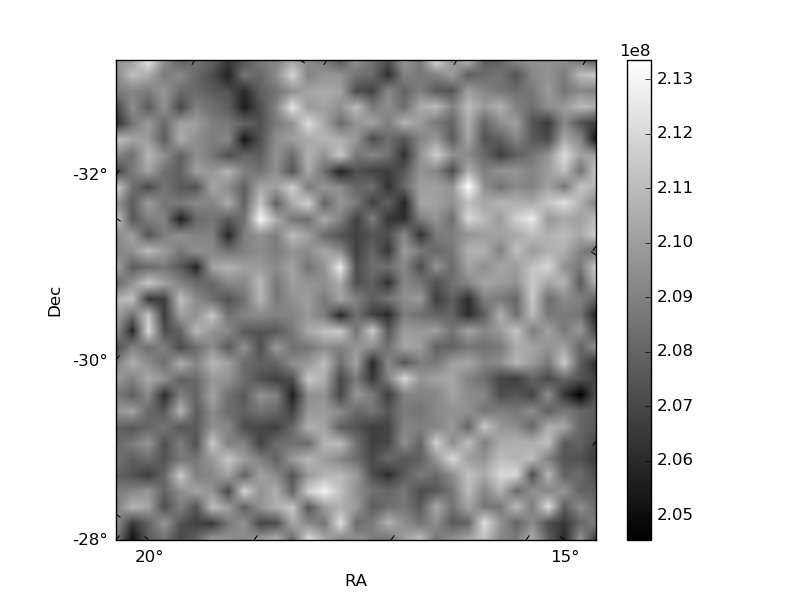
Histogram calculated using DETX and DETY for each event in the final _common_clean file
| Quadrant A | 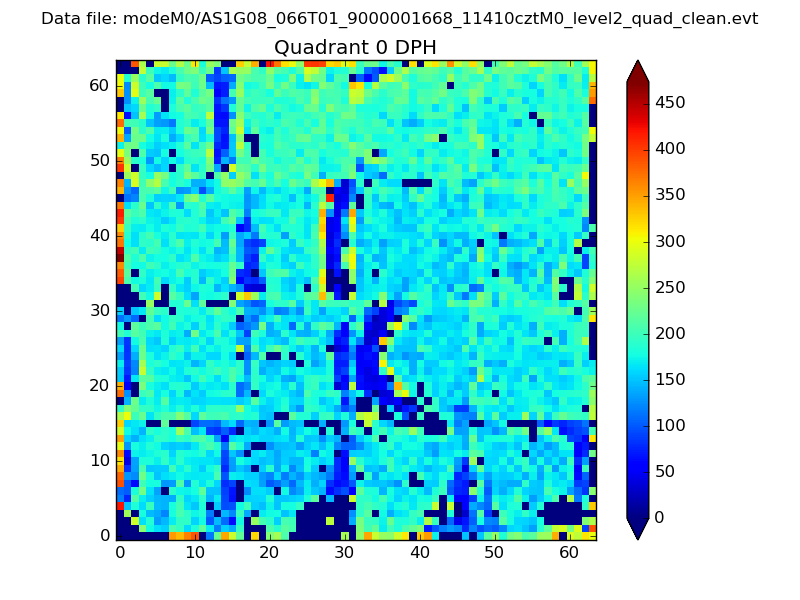 |
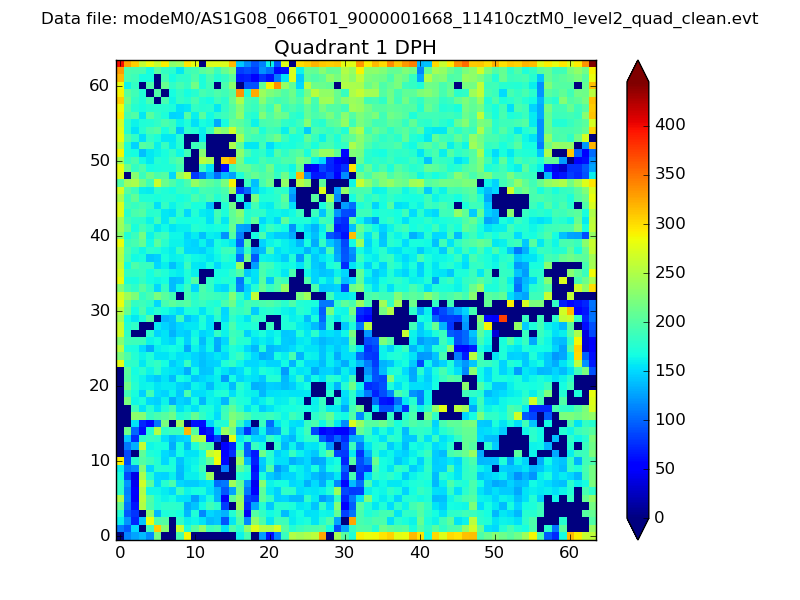 |
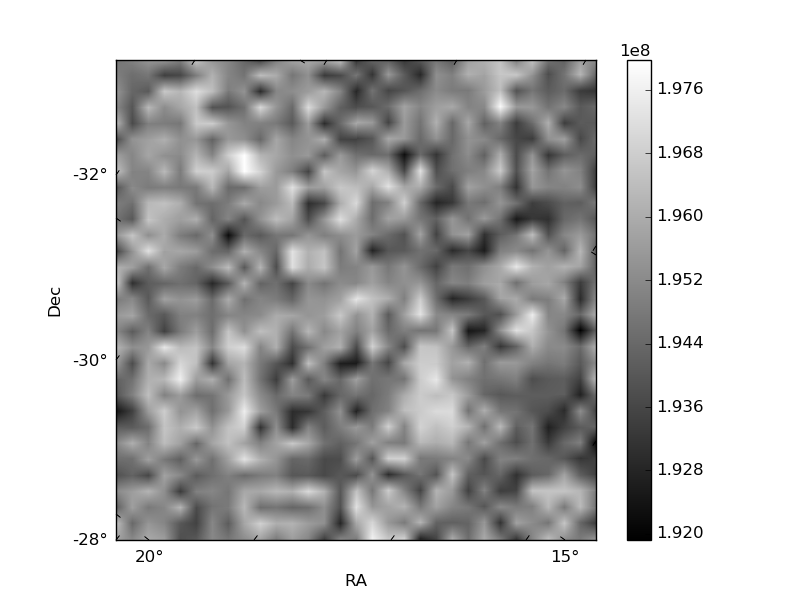
Quadrant B |
|---|---|---|---|
| Quadrant D | 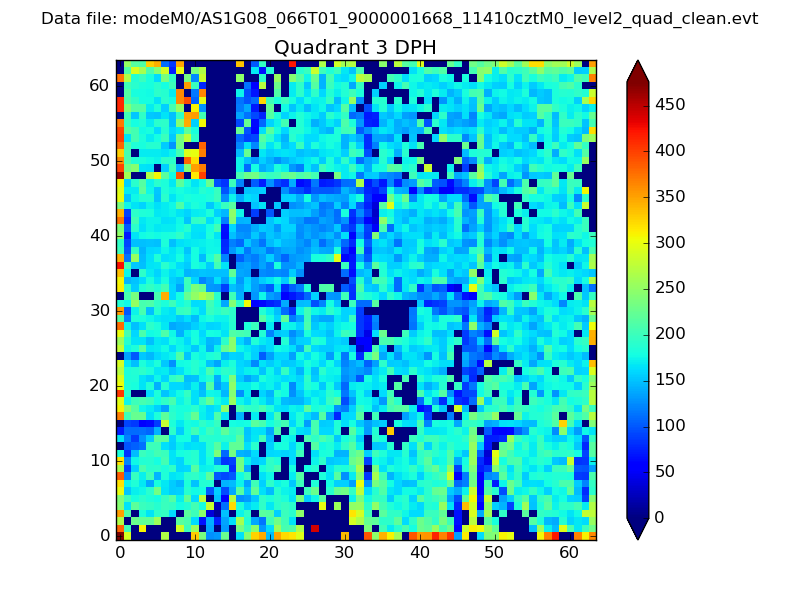 |
 |
Quadrant C |
| Plot type | Count rate plots | Images |
|---|---|---|
| Comparison with Poisson distribution Blue bars denote a histogram of data divided into 1 sec bins. Red curve is a Poisson curve with rate = median count rate of data. |
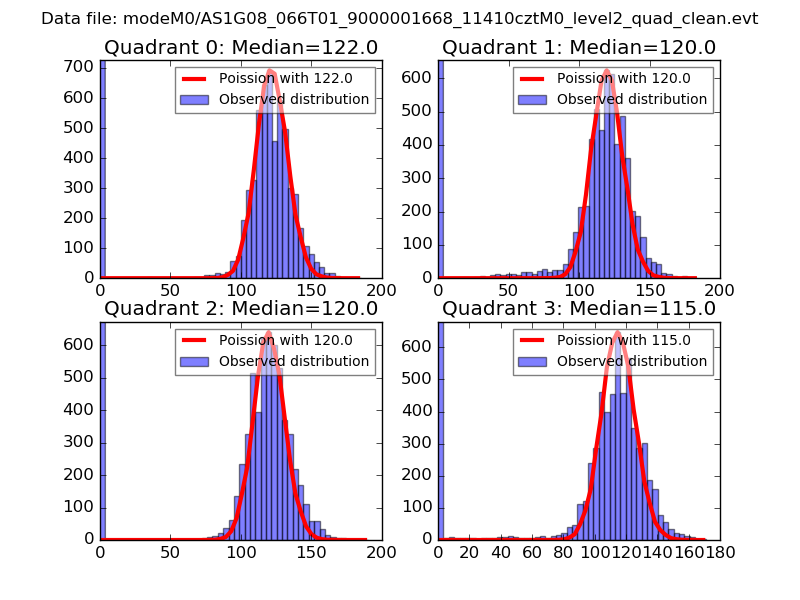 |
 |
| Quadrant-wise count rates Data is divided into 100 sec bins |
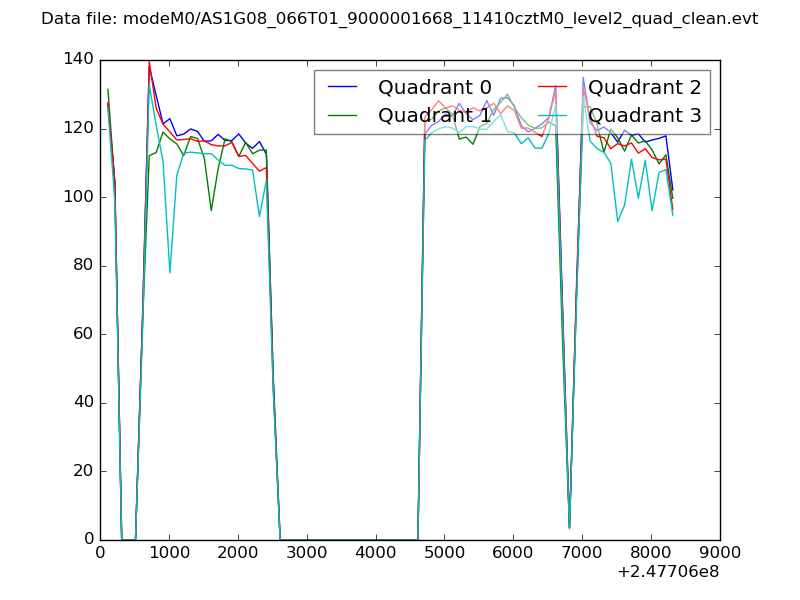 |
|
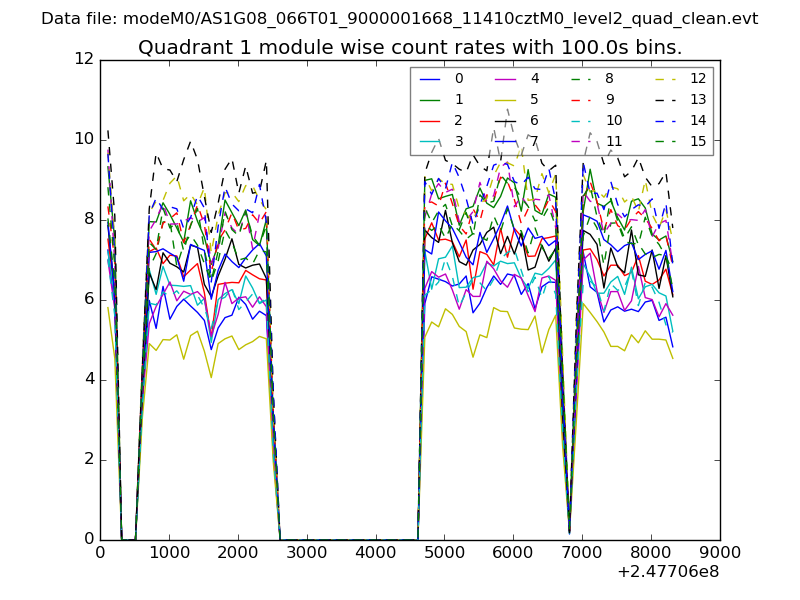
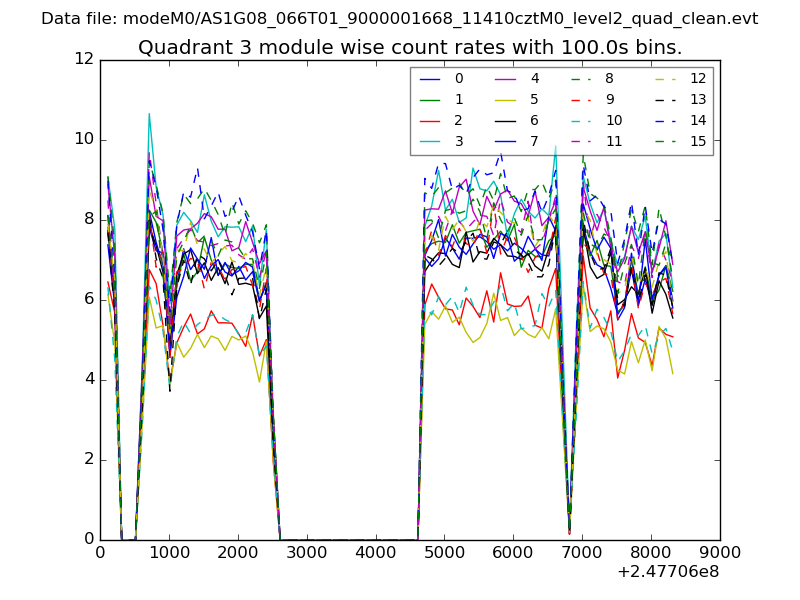
| Module-wise count rates for Quadrant A Data is divided into 100 sec bins |
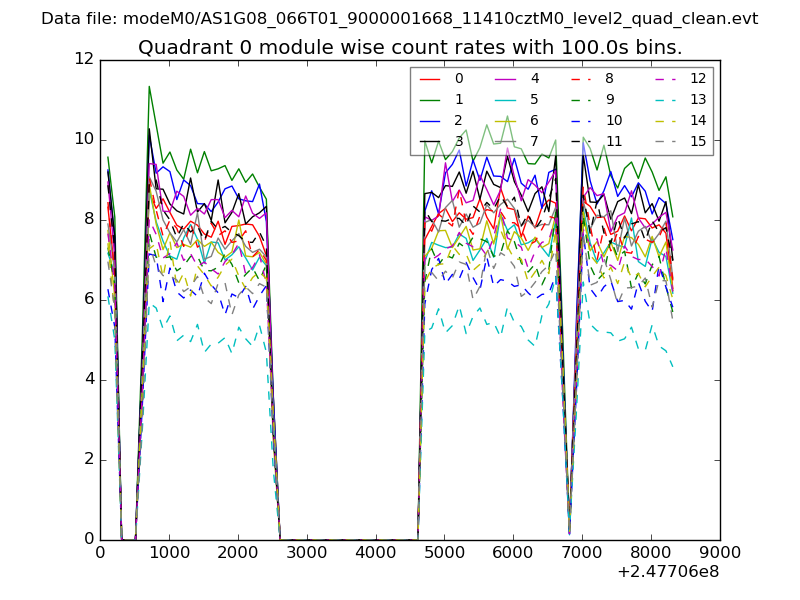 |
 |
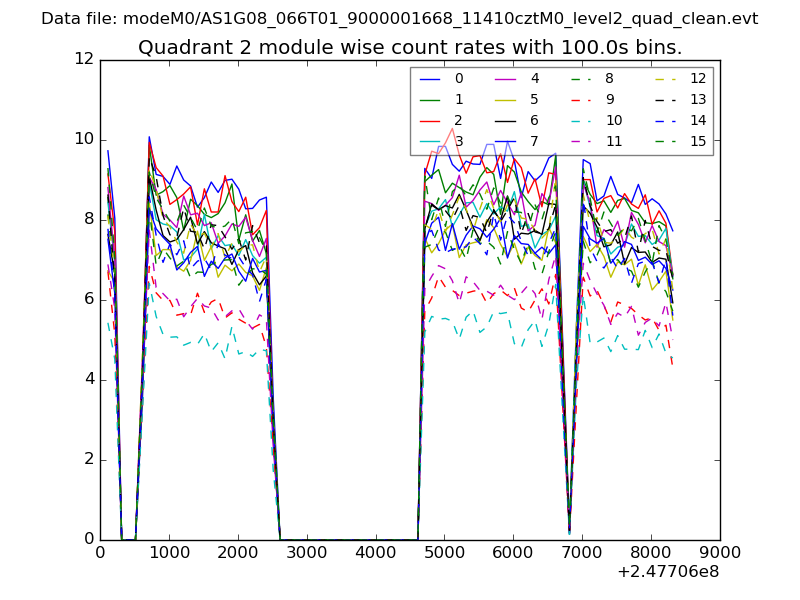
| Module-wise count rates for Quadrant B Data is divided into 100 sec bins |
 |
 |
| Module-wise count rates for Quadrant C Data is divided into 100 sec bins |
 |
 |
| Module-wise count rates for Quadrant D Data is divided into 100 sec bins |
 |
 |
| Parameter | Plot |
|---|---|
| CZT HV Monitor | 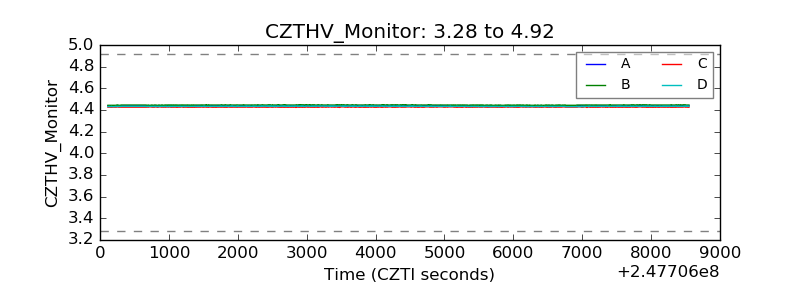 |
| D_VDD | 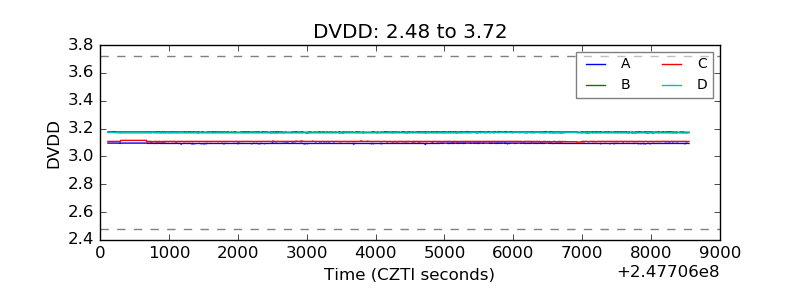 |
| Temperature 1 | 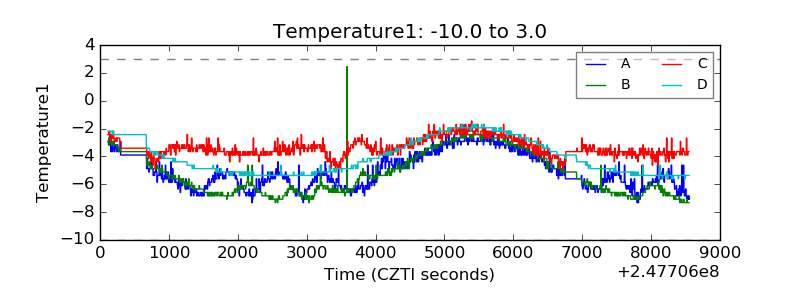 |
| Veto HV Monitor | 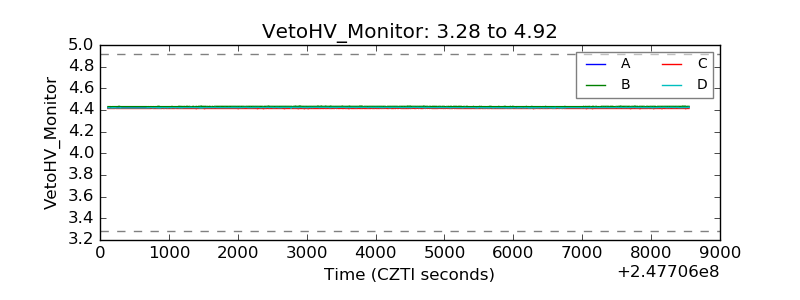 |
| Veto LLD | 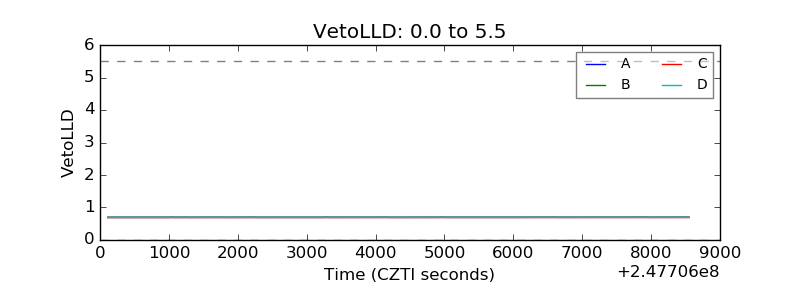 |
| Alpha Counter | 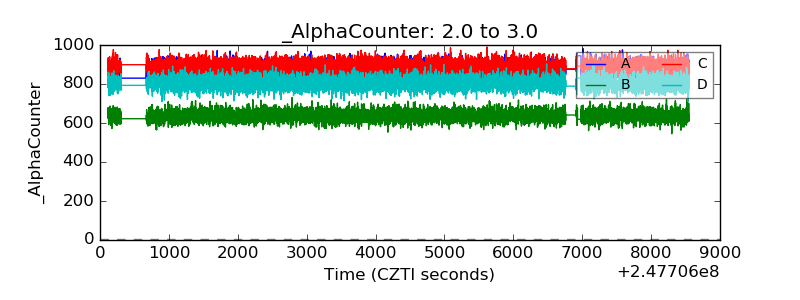 |
| _CPM_Rate | 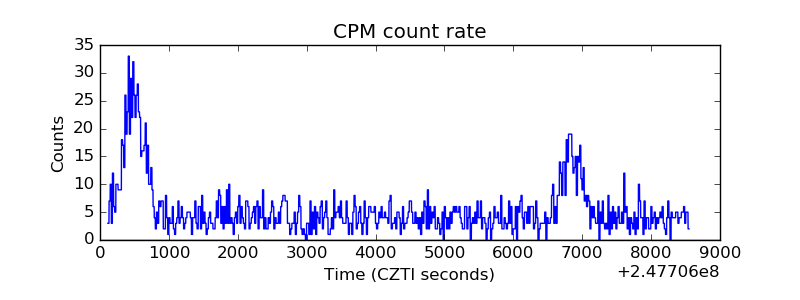 |
| CZT Counter | 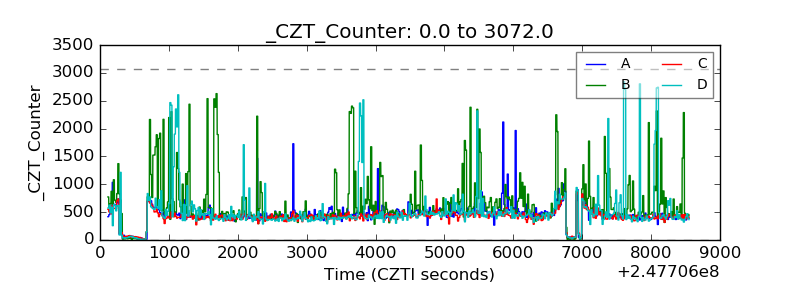 |
| +2.5 Volts monitor | 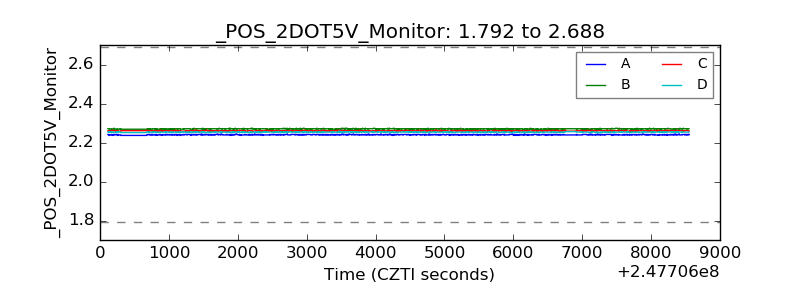 |
| +5 Volts monitor | 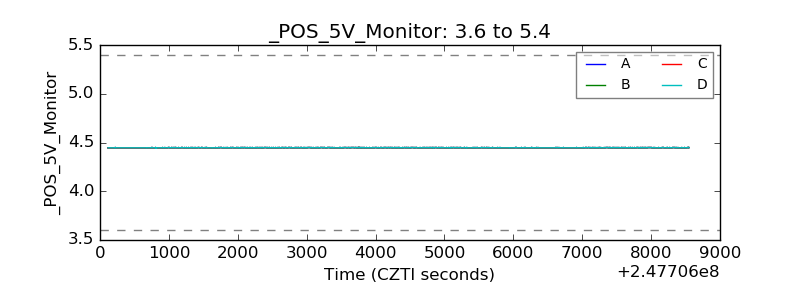 |
| _ROLL_ROT | 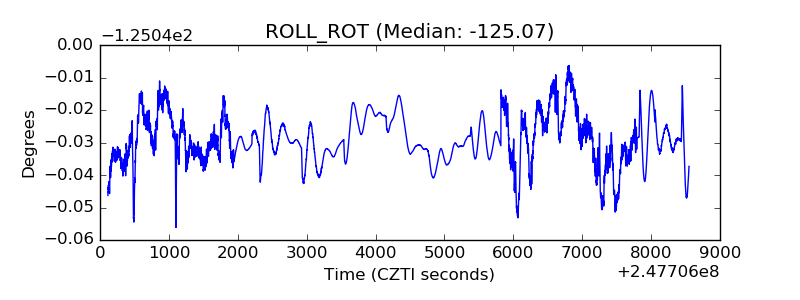 |
| _Roll_DEC | 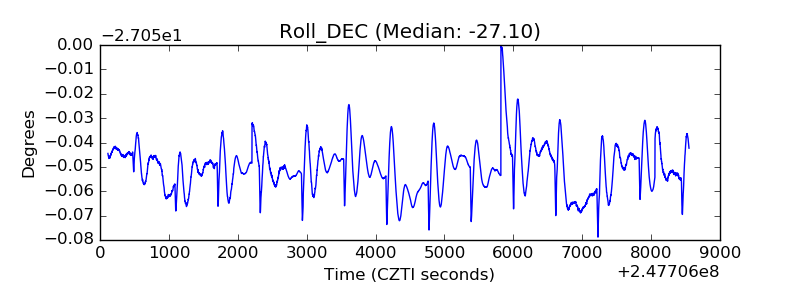 |
| _Roll_RA | 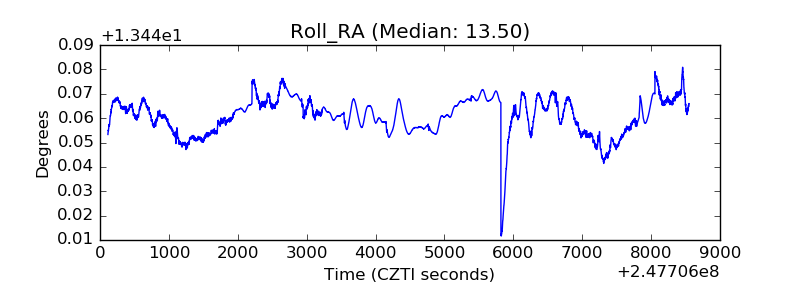 |
| Veto Counter | 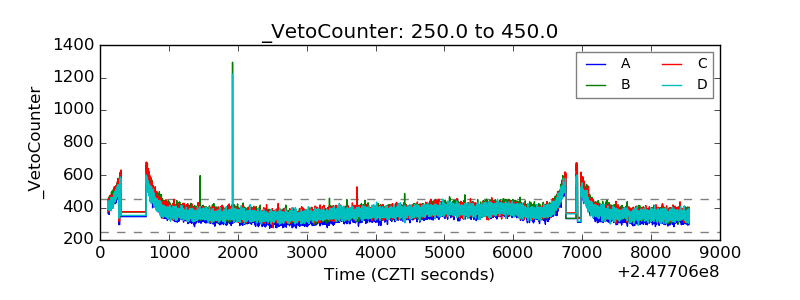 |