| Param | Original file | Final file |
|---|---|---|
| Filename | modeM0/AS1G08_066T01_9000001668_11411cztM0_level2.evt | modeM0/AS1G08_066T01_9000001668_11411cztM0_level2_quad_clean.evt |
| Size (bytes) | 636,379,200 | 113,520,960 |
| Size | 606.9 MB | 108.3 MB |
| Events in quadrant A | 4,134,670 | 728,430 |
| Events in quadrant B | 6,137,161 | 700,486 |
| Events in quadrant C | 3,905,966 | 715,709 |
| Events in quadrant D | 4,502,907 | 687,007 |
| Mode M0 | |||
|---|---|---|---|
| Quadrant | BADHDUFLAG | Total packets | Discarded packets |
| A | 0 | 18328 | 3 |
| B | 0 | 24111 | 2 |
| C | 0 | 17952 | 2 |
| D | 0 | 19643 | 2 |
| Mode SS | |||
|---|---|---|---|
| Quadrant | BADHDUFLAG | Total packets | Discarded packets |
| A | 0 | 178 | 0 |
| B | 0 | 178 | 0 |
| C | 0 | 178 | 0 |
| D | 0 | 178 | 0 |
| Mode M9 | |||
|---|---|---|---|
| Quadrant | BADHDUFLAG | Total packets | Discarded packets |
| A | 0 | 5 | 0 |
| B | 0 | 5 | 0 |
| C | 0 | 5 | 0 |
| D | 0 | 5 | 0 |
| Quadrant | Total seconds | Saturated seconds | Saturation percentage |
|---|---|---|---|
| A | 8733 | 79 | 0.904615% |
| B | 8733 | 652 | 7.465934% |
| C | 8733 | 64 | 0.732852% |
| D | 8733 | 180 | 2.061147% |
Noise dominated data is calculated using 1-second bins in cleaned event files. If a bin has >2000 counts, and if more than 50% of those come from <1% of pixels, then it is considered to be noise-dominated and hence unusable.
| Quadrant | # 1 sec bins | Bins with >0 counts | Bins with >2000 counts | High rate bins dominated by noise | Noise dominated (total time) | Noise dominated (detector-on time) | Marked lightcurve |
|---|---|---|---|---|---|---|---|
| A | 9243 | 8736 | 10 | 10 | 0.11% | 0.11% | 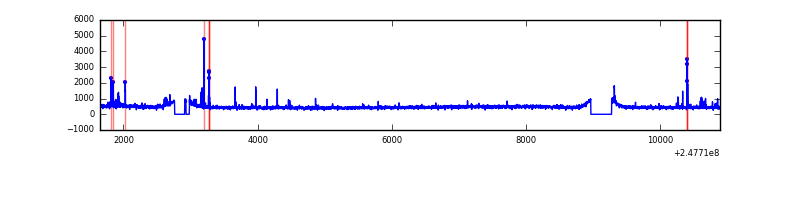 |
| B | 9243 | 8736 | 327 | 327 | 3.54% | 3.74% | 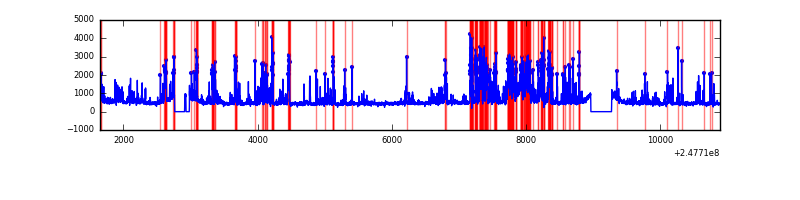 |
| C | 9243 | 8736 | 6 | 6 | 0.06% | 0.07% | 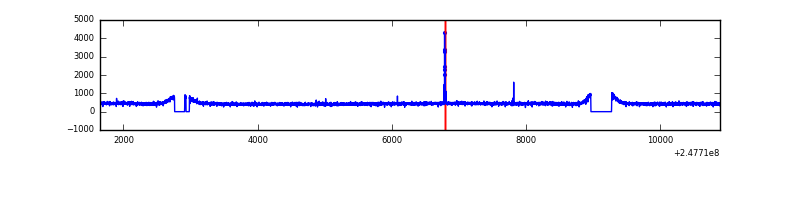 |
| D | 9243 | 8736 | 112 | 112 | 1.21% | 1.28% | 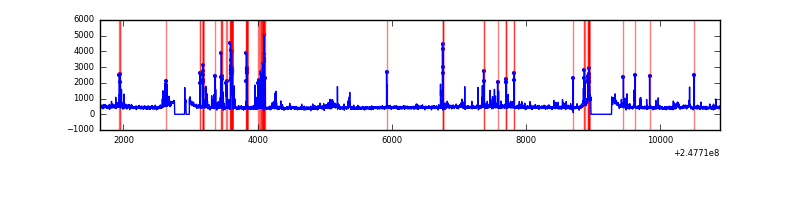 |
Top three noisy pixels from each quadrant. If the there are fewer than three noisy pixels in the level2.evt file, extra rows are filled as -1
| Pixel properties | Quadrant properties | ||||||
|---|---|---|---|---|---|---|---|
| Quadrant | DetID | PixID | Counts | Sigma | Mean | Median | Sigma |
| A | 8 | 5 | 140847 | 666.07 | 1024 | 1002 | 210.0 |
| A | 1 | 162 | 20559 | 93.15 | 1024 | 1002 | 210.0 |
| A | 1 | 178 | 11410 | 49.57 | 1024 | 1002 | 210.0 |
| B | 4 | 239 | 1881872 | 9708.8 | 1004 | 977 | 193.7 |
| B | 3 | 64 | 83167 | 424.25 | 1004 | 977 | 193.7 |
| B | 3 | 189 | 77915 | 397.14 | 1004 | 977 | 193.7 |
| C | 14 | 234 | 30246 | 127.0 | 994 | 997 | 230.3 |
| C | 13 | 61 | 7183 | 26.86 | 994 | 997 | 230.3 |
| C | 3 | 202 | 2487 | 6.47 | 994 | 997 | 230.3 |
| D | 10 | 253 | 437344 | 1819.46 | 981 | 950 | 239.8 |
| D | 2 | 120 | 72286 | 297.42 | 981 | 950 | 239.8 |
| D | 5 | 222 | 55652 | 228.07 | 981 | 950 | 239.8 |
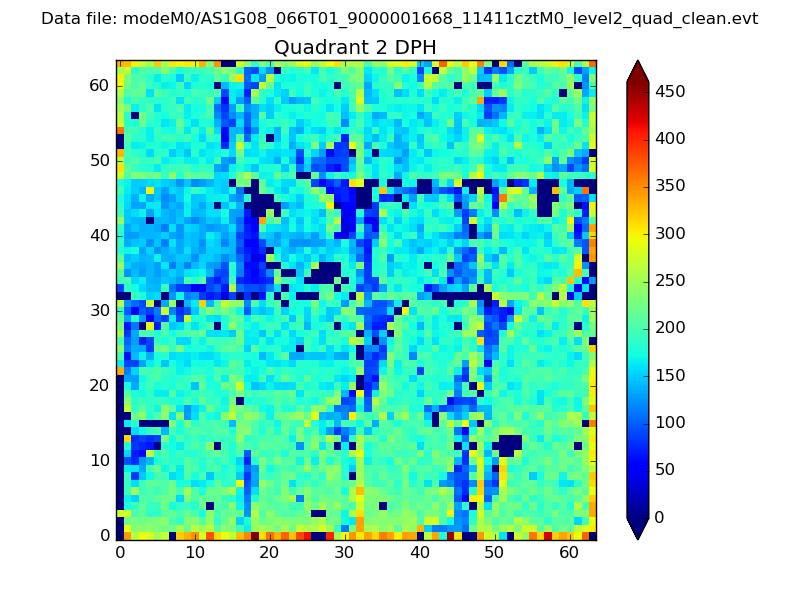
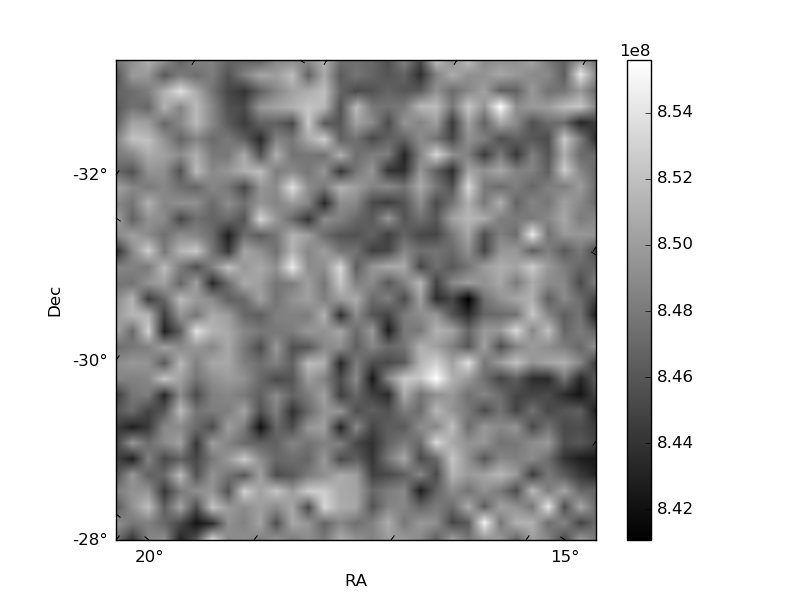
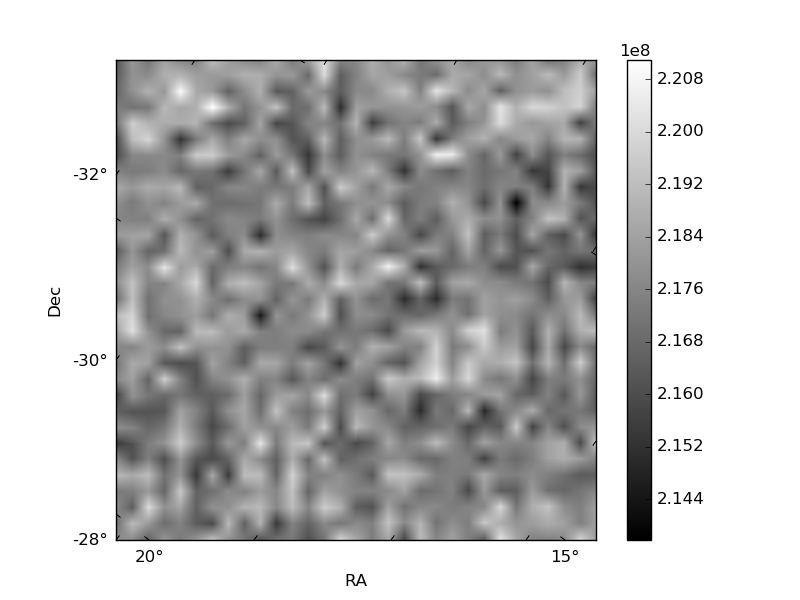
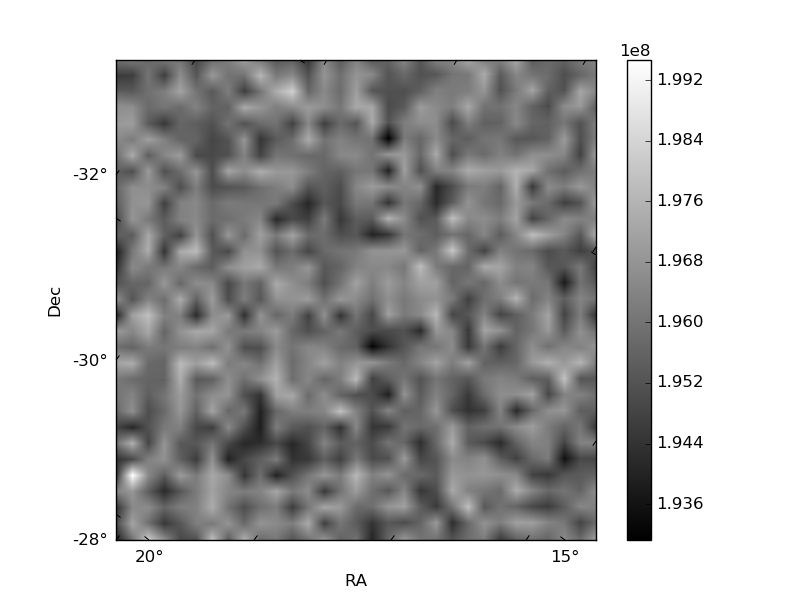
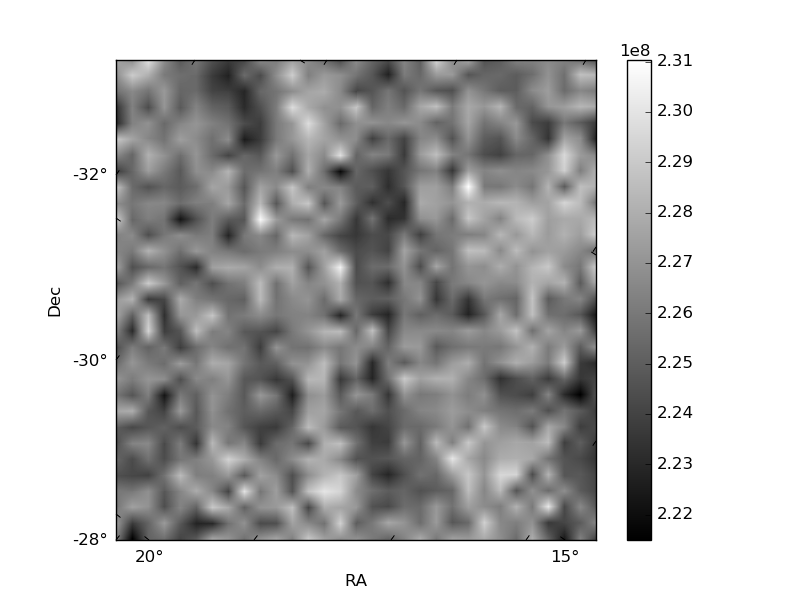
Histogram calculated using DETX and DETY for each event in the final _common_clean file
| Quadrant A | 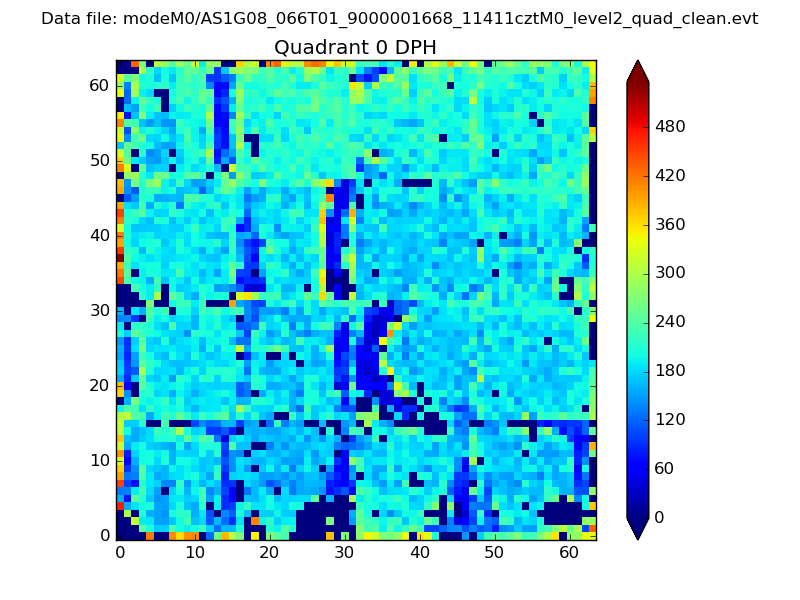 |
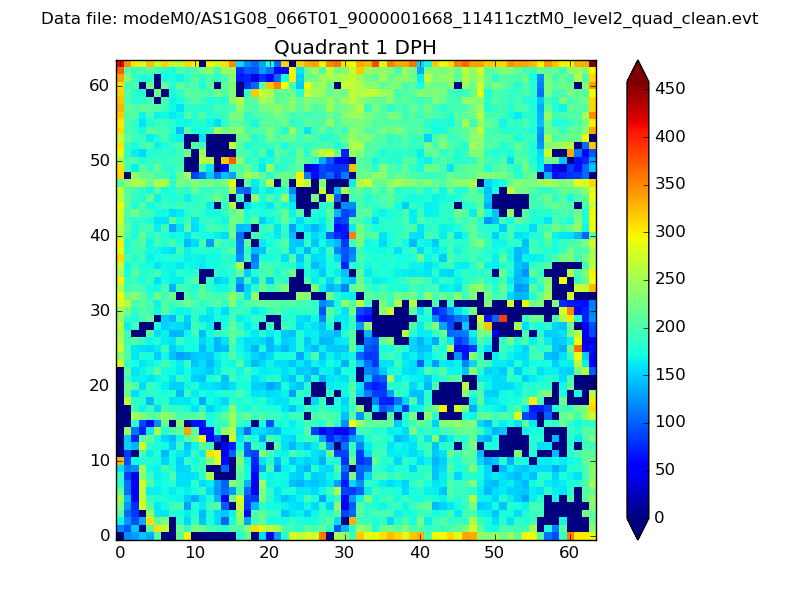 |
Quadrant B |
|---|---|---|---|
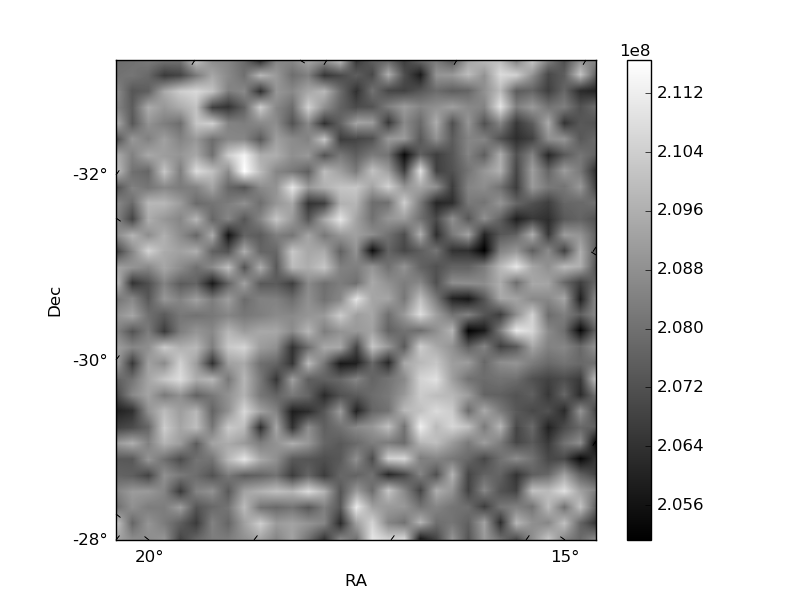
| Quadrant D | 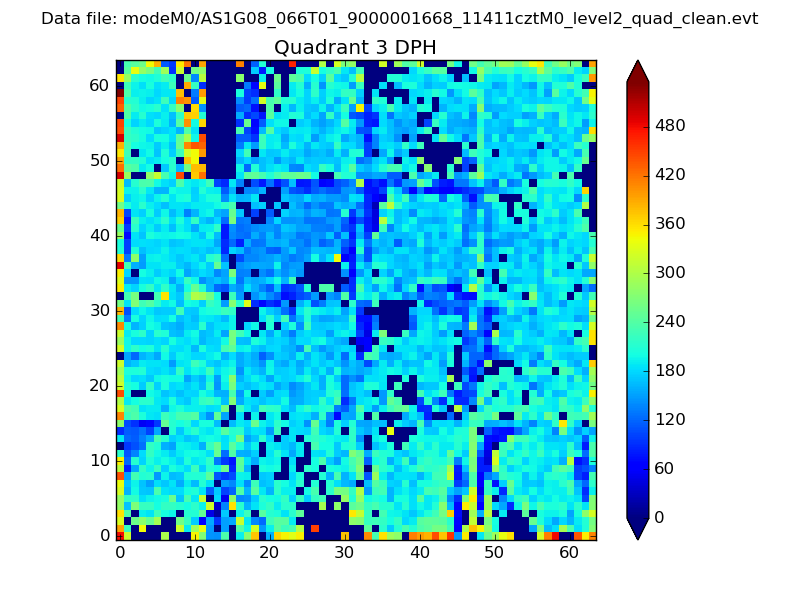 |
 |
Quadrant C |
| Plot type | Count rate plots | Images |
|---|---|---|
| Comparison with Poisson distribution Blue bars denote a histogram of data divided into 1 sec bins. Red curve is a Poisson curve with rate = median count rate of data. |
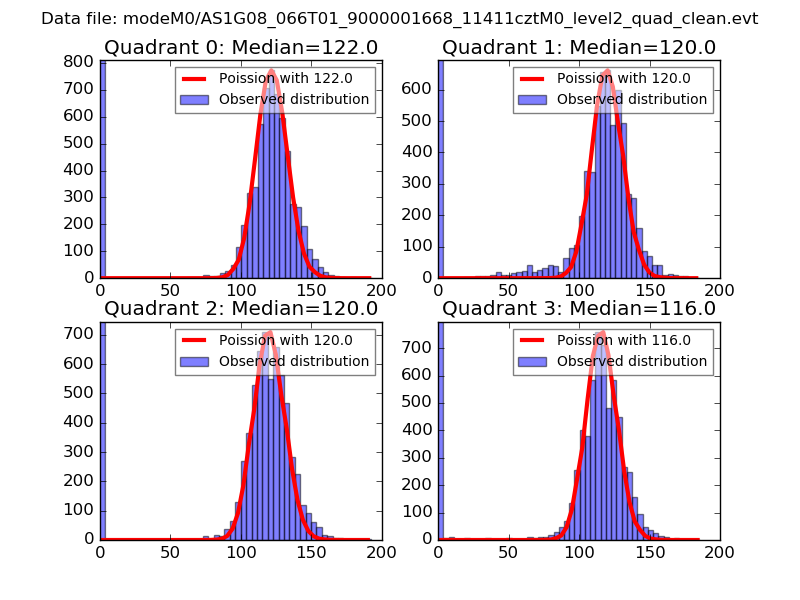 |
 |
| Quadrant-wise count rates Data is divided into 100 sec bins |
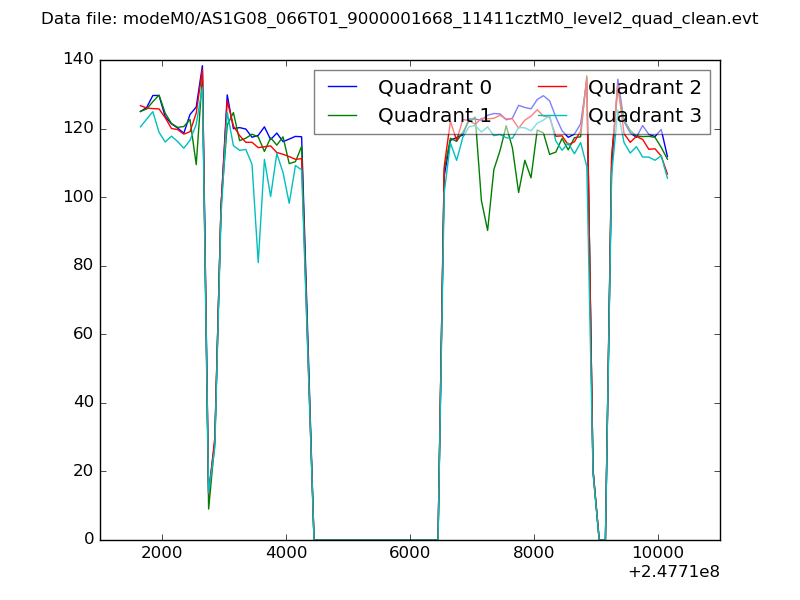 |
|
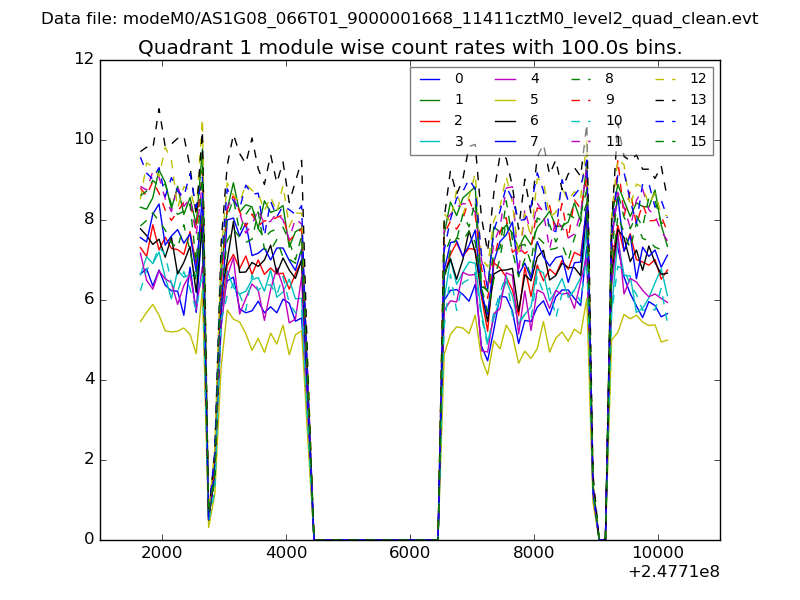
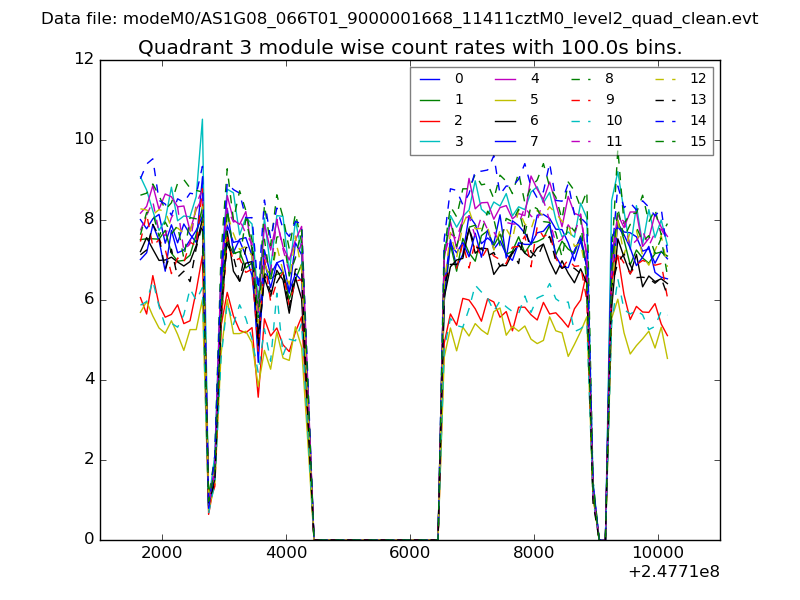
| Module-wise count rates for Quadrant A Data is divided into 100 sec bins |
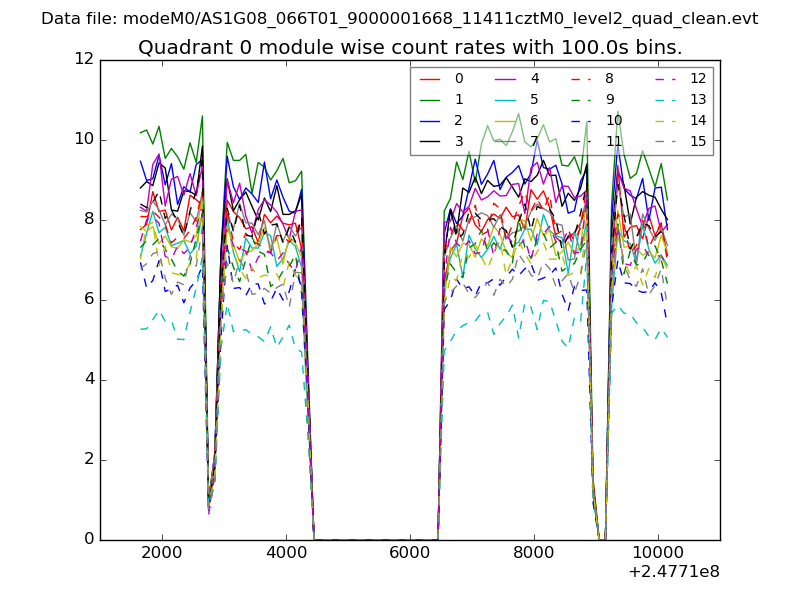 |
 |
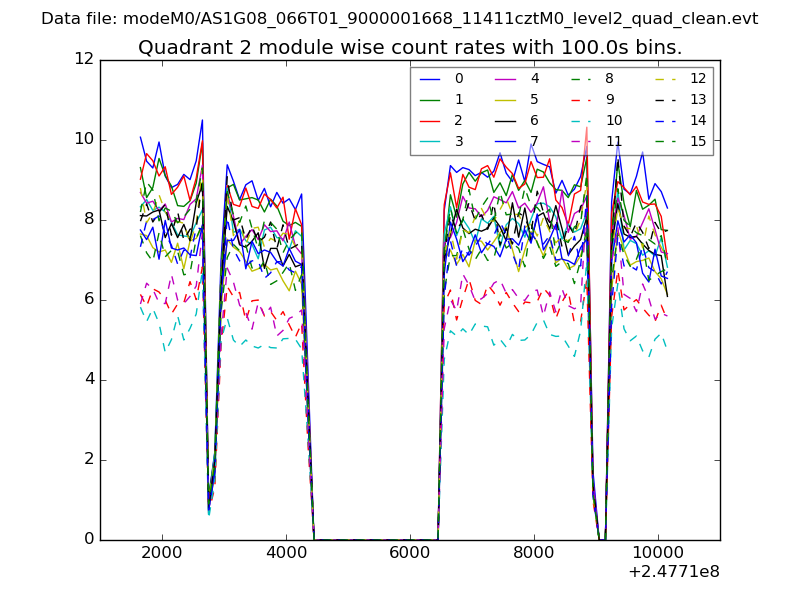
| Module-wise count rates for Quadrant B Data is divided into 100 sec bins |
 |
 |
| Module-wise count rates for Quadrant C Data is divided into 100 sec bins |
 |
 |
| Module-wise count rates for Quadrant D Data is divided into 100 sec bins |
 |
 |
| Parameter | Plot |
|---|---|
| CZT HV Monitor | 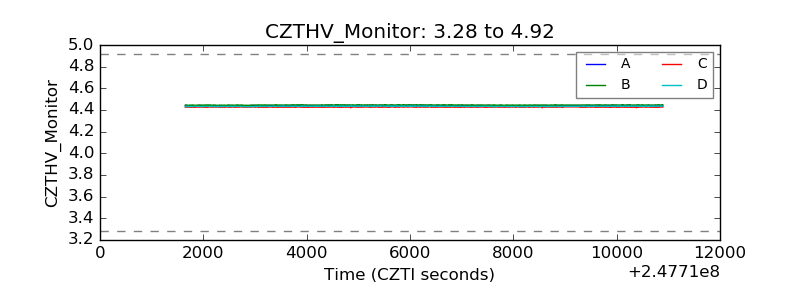 |
| D_VDD | 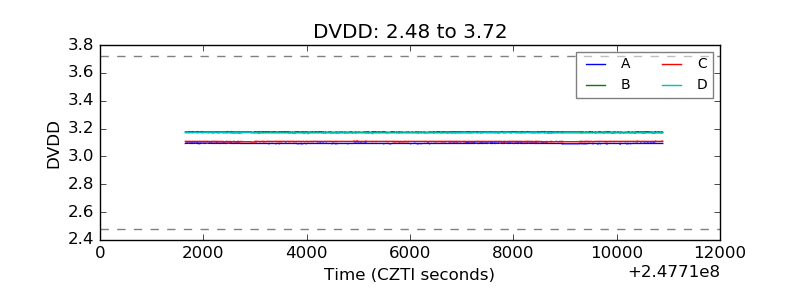 |
| Temperature 1 | 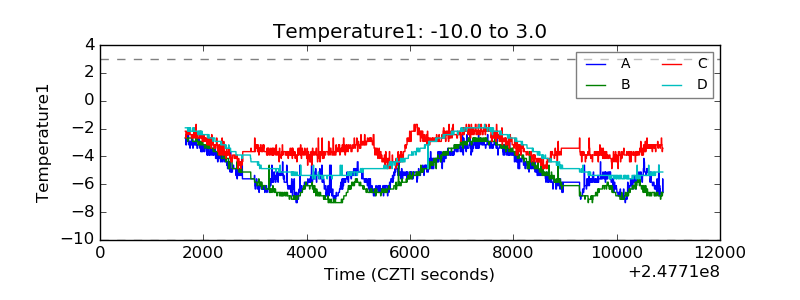 |
| Veto HV Monitor | 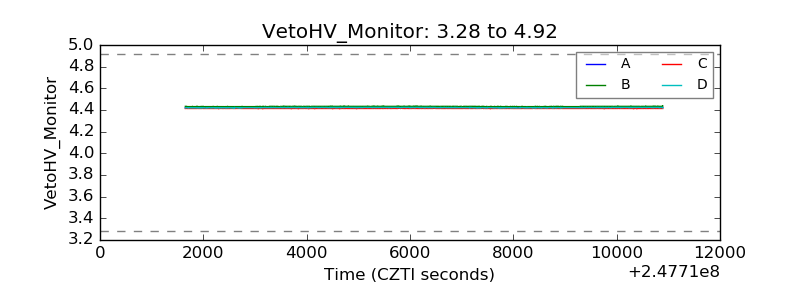 |
| Veto LLD | 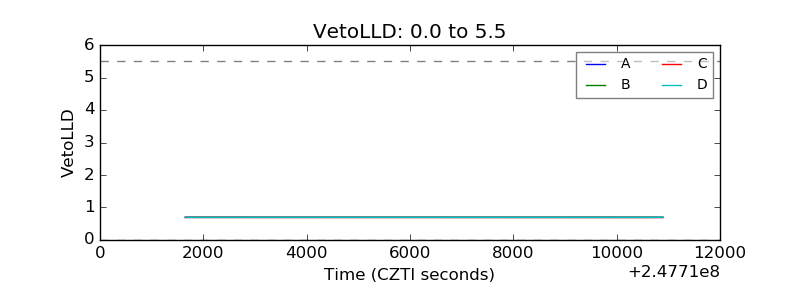 |
| Alpha Counter | 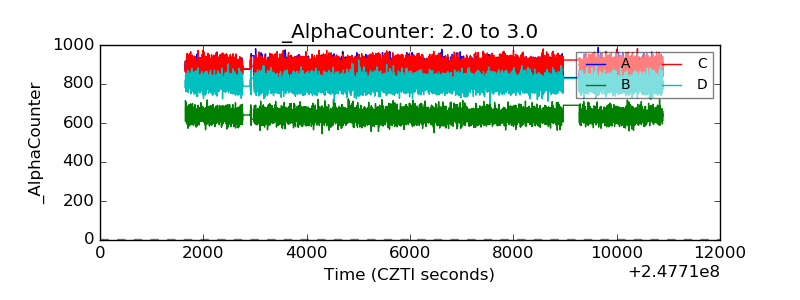 |
| _CPM_Rate | 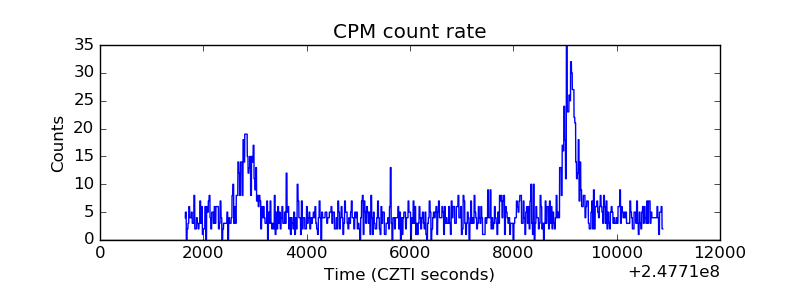 |
| CZT Counter | 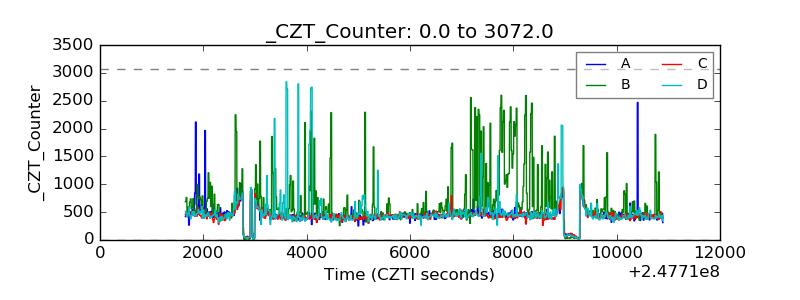 |
| +2.5 Volts monitor |  |
| +5 Volts monitor |  |
| _ROLL_ROT | 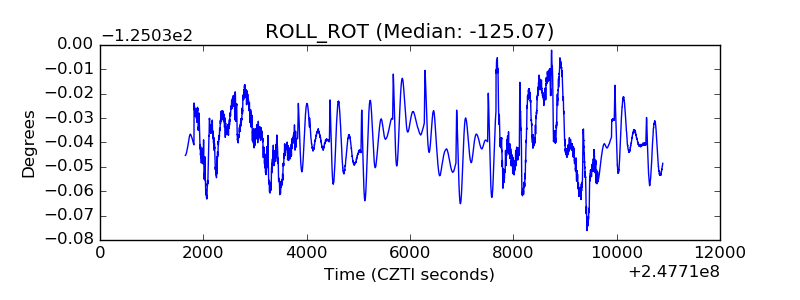 |
| _Roll_DEC | 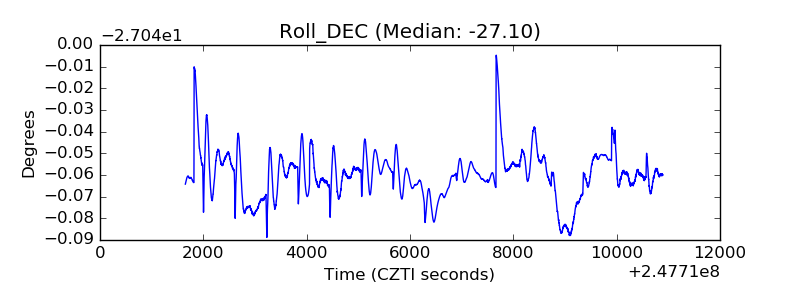 |
| _Roll_RA | 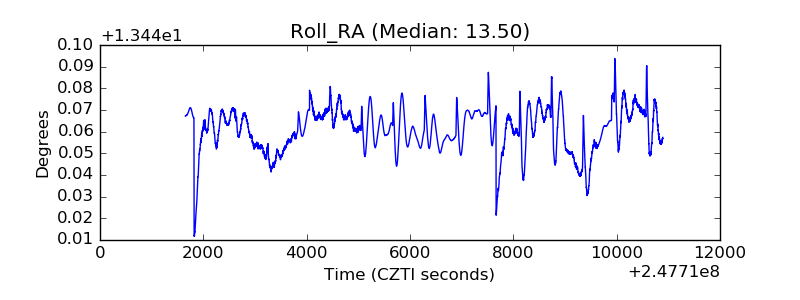 |
| Veto Counter | 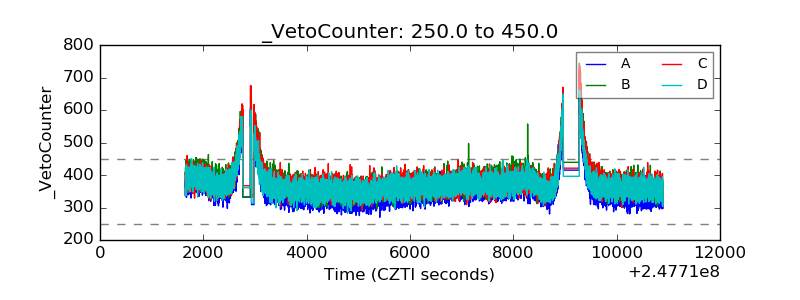 |