| Param | Original file | Final file |
|---|---|---|
| Filename | modeM0/AS1G08_066T01_9000001668_11415cztM0_level2.evt | modeM0/AS1G08_066T01_9000001668_11415cztM0_level2_quad_clean.evt |
| Size (bytes) | 751,178,880 | 120,196,800 |
| Size | 716.4 MB | 114.6 MB |
| Events in quadrant A | 5,202,003 | 740,866 |
| Events in quadrant B | 6,879,269 | 722,602 |
| Events in quadrant C | 4,614,629 | 739,563 |
| Events in quadrant D | 5,342,271 | 709,395 |
| Mode M0 | |||
|---|---|---|---|
| Quadrant | BADHDUFLAG | Total packets | Discarded packets |
| A | 0 | 22642 | 2 |
| B | 0 | 27482 | 2 |
| C | 0 | 21474 | 2 |
| D | 0 | 23412 | 2 |
| Mode SS | |||
|---|---|---|---|
| Quadrant | BADHDUFLAG | Total packets | Discarded packets |
| A | 0 | 214 | 0 |
| B | 0 | 214 | 0 |
| C | 0 | 214 | 0 |
| D | 0 | 214 | 0 |
| Mode M9 | |||
|---|---|---|---|
| Quadrant | BADHDUFLAG | Total packets | Discarded packets |
| A | 0 | 8 | 0 |
| B | 0 | 8 | 0 |
| C | 0 | 8 | 0 |
| D | 0 | 8 | 0 |
| Quadrant | Total seconds | Saturated seconds | Saturation percentage |
|---|---|---|---|
| A | 10500 | 145 | 1.380952% |
| B | 10500 | 615 | 5.857143% |
| C | 10500 | 96 | 0.914286% |
| D | 10500 | 131 | 1.247619% |
Noise dominated data is calculated using 1-second bins in cleaned event files. If a bin has >2000 counts, and if more than 50% of those come from <1% of pixels, then it is considered to be noise-dominated and hence unusable.
| Quadrant | # 1 sec bins | Bins with >0 counts | Bins with >2000 counts | High rate bins dominated by noise | Noise dominated (total time) | Noise dominated (detector-on time) | Marked lightcurve |
|---|---|---|---|---|---|---|---|
| A | 11275 | 10502 | 26 | 26 | 0.23% | 0.25% | 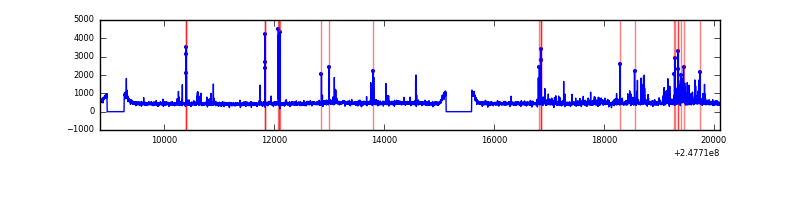 |
| B | 11275 | 10502 | 292 | 292 | 2.59% | 2.78% | 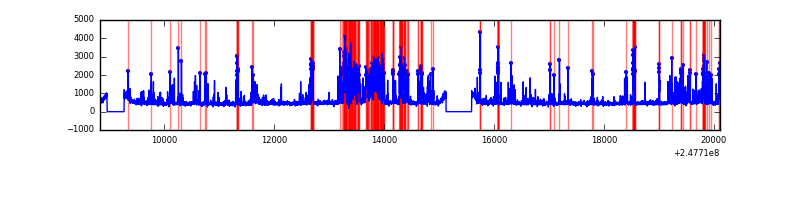 |
| C | 11275 | 10502 | 0 | 0 | 0.00% | 0.00% | 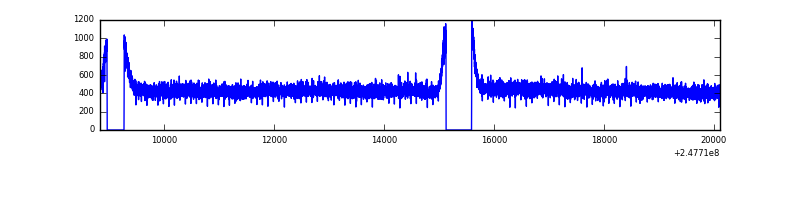 |
| D | 11275 | 10502 | 33 | 33 | 0.29% | 0.31% | 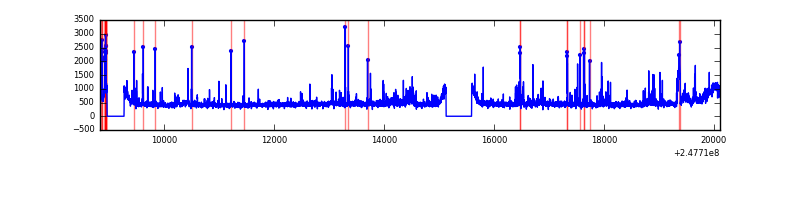 |
Top three noisy pixels from each quadrant. If the there are fewer than three noisy pixels in the level2.evt file, extra rows are filled as -1
| Pixel properties | Quadrant properties | ||||||
|---|---|---|---|---|---|---|---|
| Quadrant | DetID | PixID | Counts | Sigma | Mean | Median | Sigma |
| A | 8 | 5 | 423520 | 1690.38 | 1213 | 1182 | 249.8 |
| A | 1 | 162 | 35192 | 136.12 | 1213 | 1182 | 249.8 |
| A | 11 | 29 | 24720 | 94.21 | 1213 | 1182 | 249.8 |
| B | 4 | 239 | 2076959 | 8922.0 | 1200 | 1168 | 232.7 |
| B | 3 | 189 | 64692 | 273.03 | 1200 | 1168 | 232.7 |
| B | 15 | 204 | 30685 | 126.87 | 1200 | 1168 | 232.7 |
| C | 13 | 61 | 8644 | 27.26 | 1184 | 1192 | 273.3 |
| C | 3 | 202 | 3070 | 6.87 | 1184 | 1192 | 273.3 |
| C | -1 | -1 | -1 | -1.0 | 1184 | 1192 | 273.3 |
| D | 13 | 152 | 363842 | 1279.88 | 1175 | 1140 | 283.4 |
| D | 10 | 253 | 143764 | 503.28 | 1175 | 1140 | 283.4 |
| D | 2 | 120 | 97517 | 340.09 | 1175 | 1140 | 283.4 |
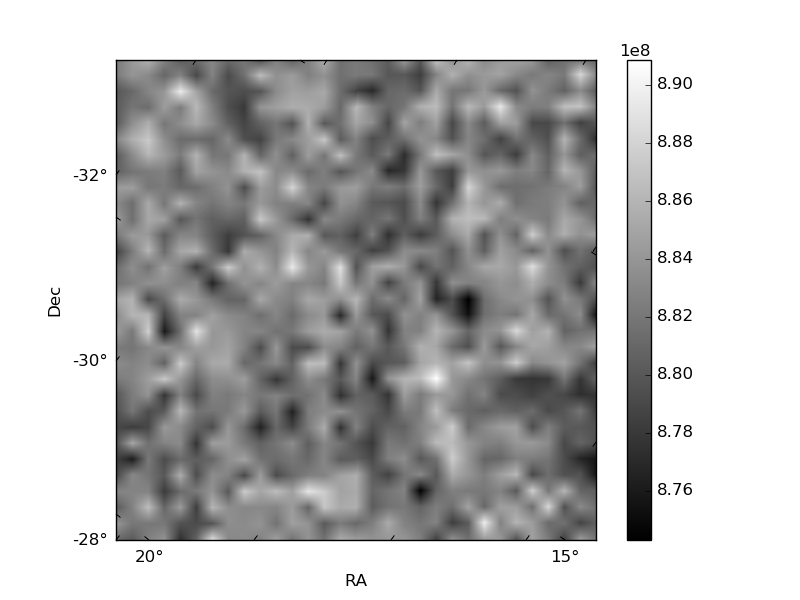
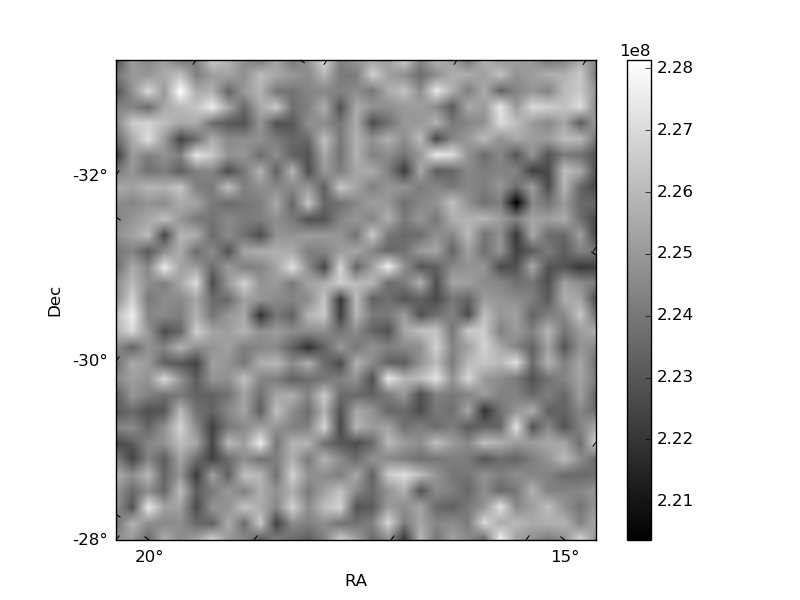
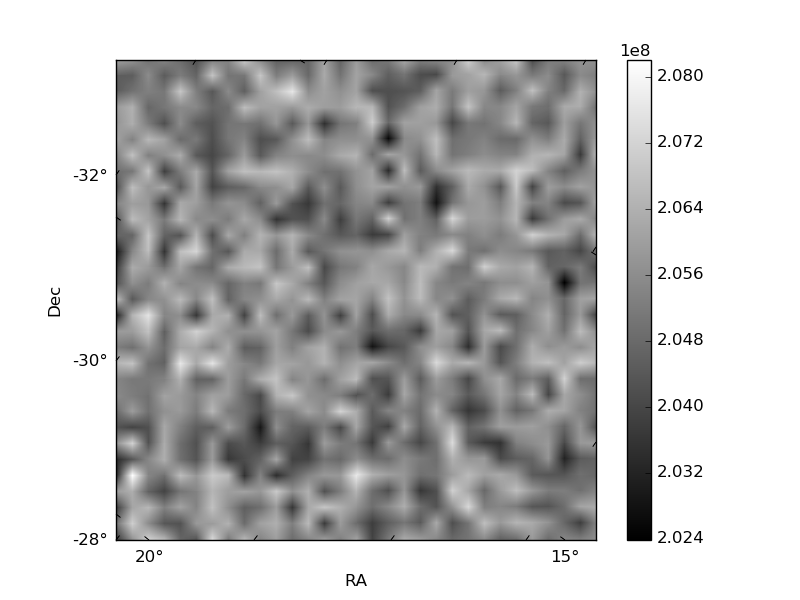
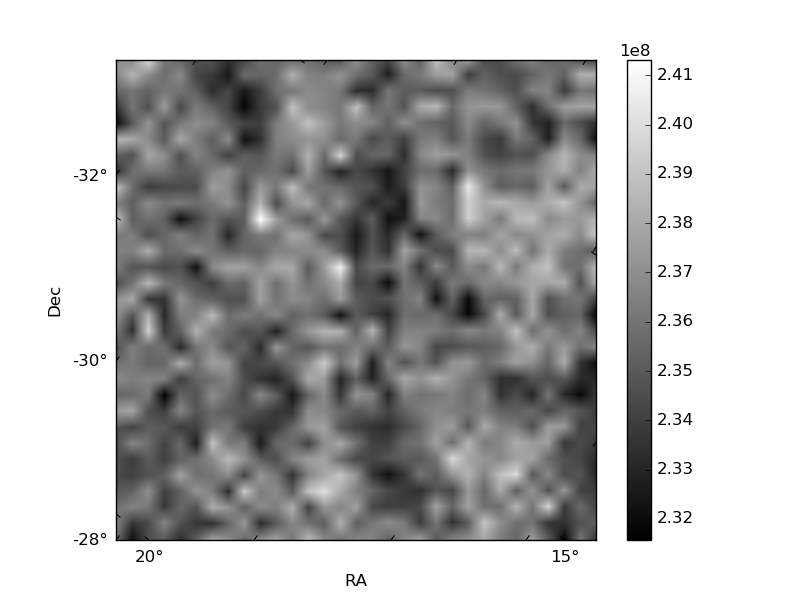
Histogram calculated using DETX and DETY for each event in the final _common_clean file
| Quadrant A | 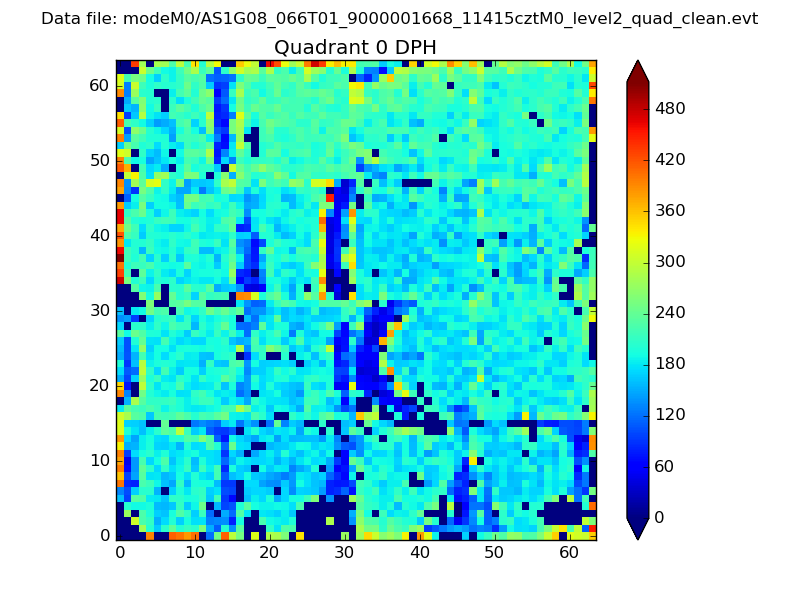 |
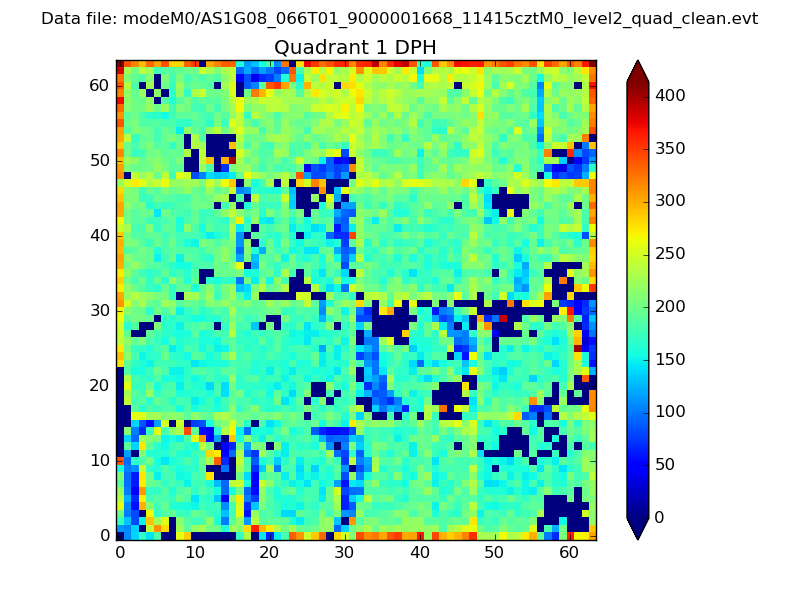 |
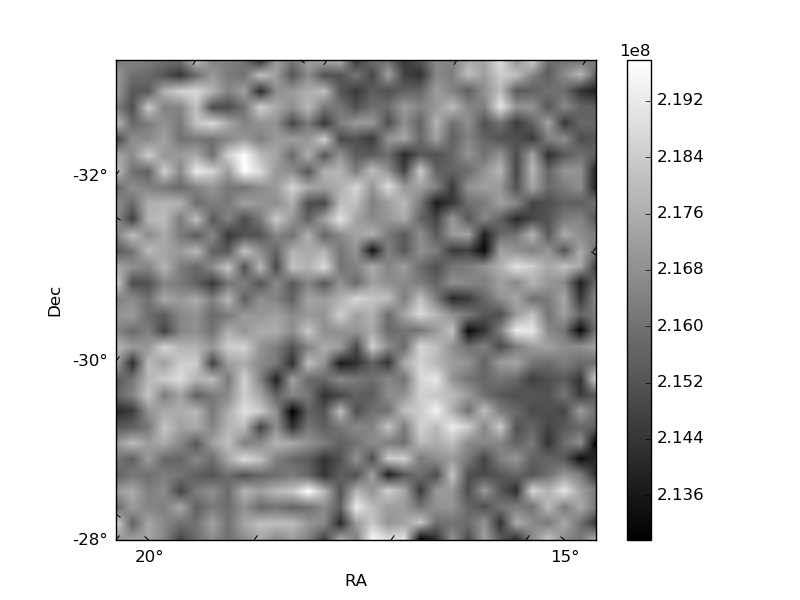
Quadrant B |
|---|---|---|---|
| Quadrant D | 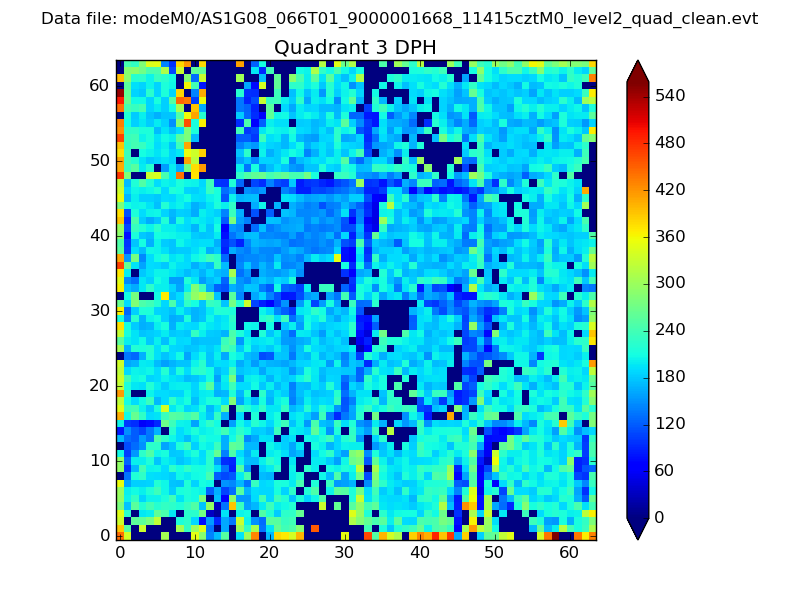 |
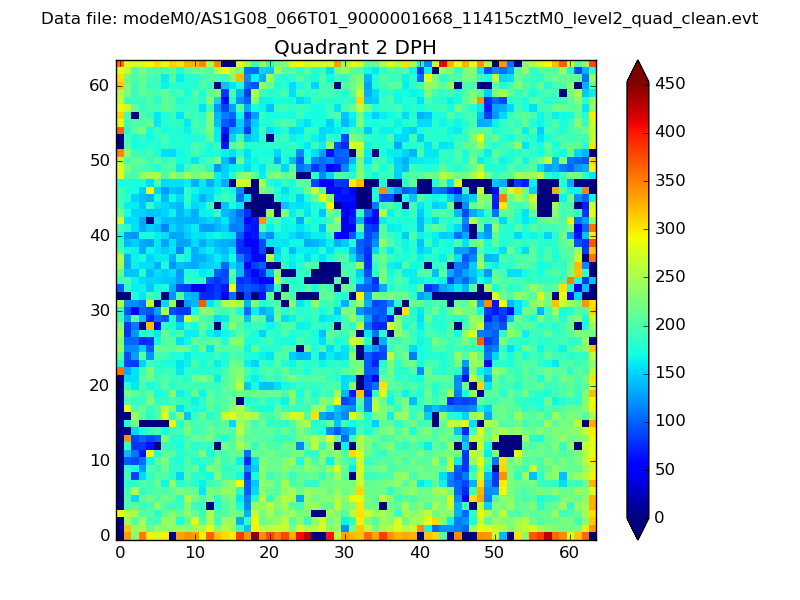 |
Quadrant C |
| Plot type | Count rate plots | Images |
|---|---|---|
| Comparison with Poisson distribution Blue bars denote a histogram of data divided into 1 sec bins. Red curve is a Poisson curve with rate = median count rate of data. |
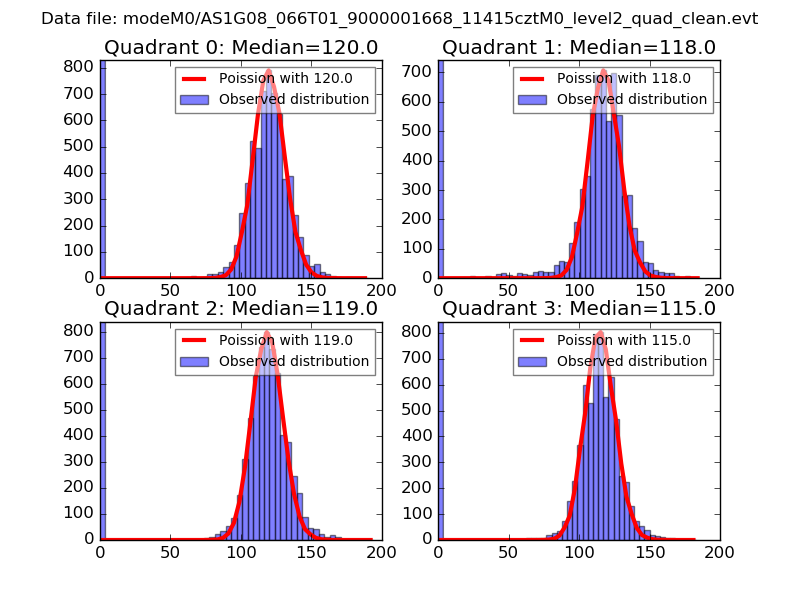 |
 |
| Quadrant-wise count rates Data is divided into 100 sec bins |
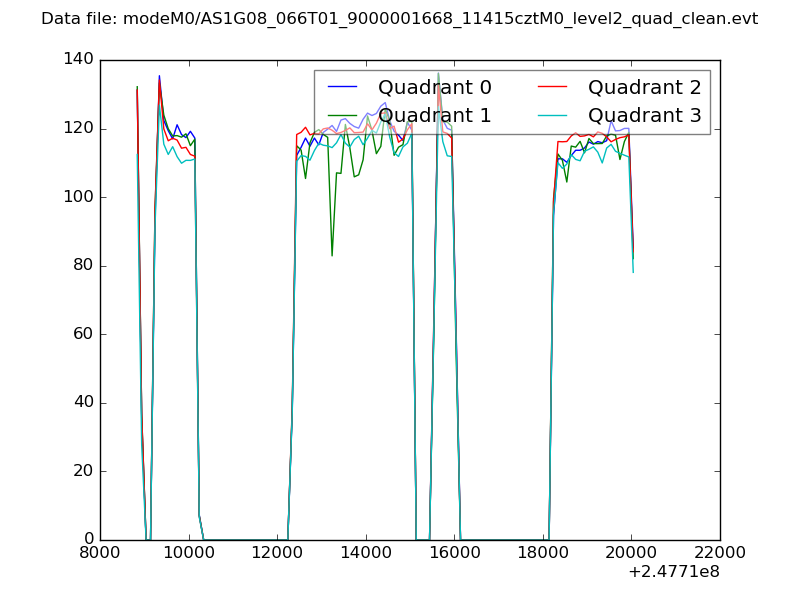 |
|
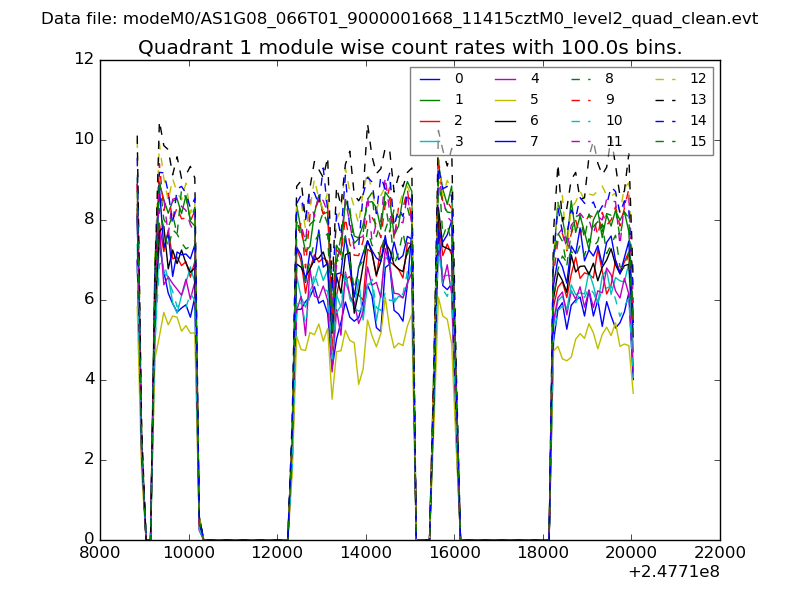
| Module-wise count rates for Quadrant A Data is divided into 100 sec bins |
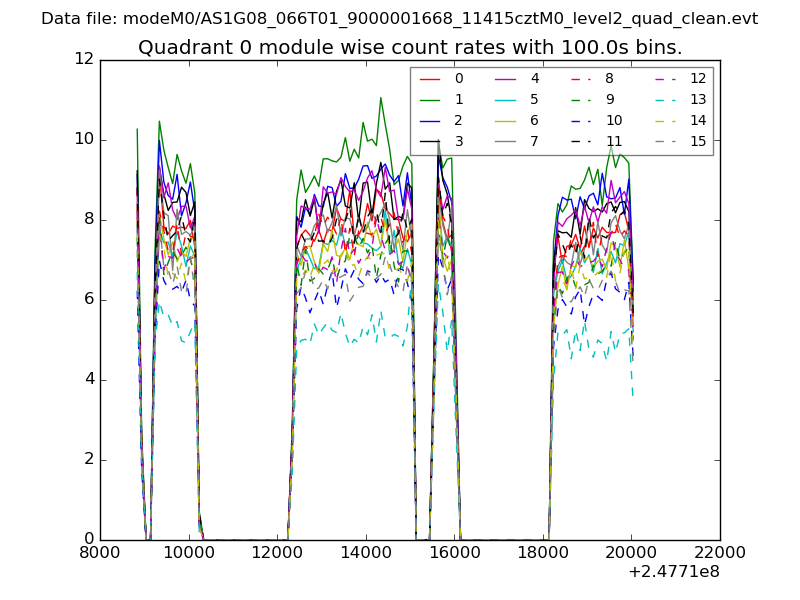 |
 |
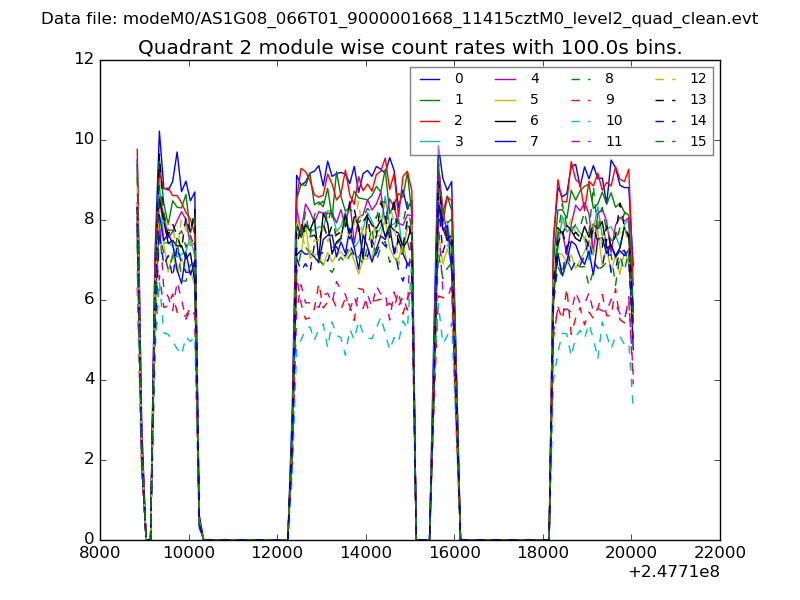
| Module-wise count rates for Quadrant B Data is divided into 100 sec bins |
 |
 |
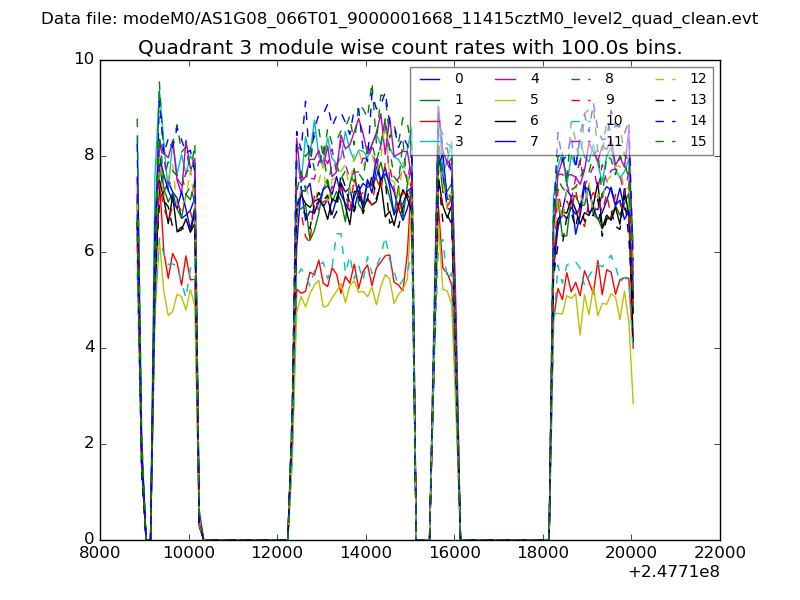
| Module-wise count rates for Quadrant C Data is divided into 100 sec bins |
 |
 |
| Module-wise count rates for Quadrant D Data is divided into 100 sec bins |
 |
 |
| Parameter | Plot |
|---|---|
| CZT HV Monitor | 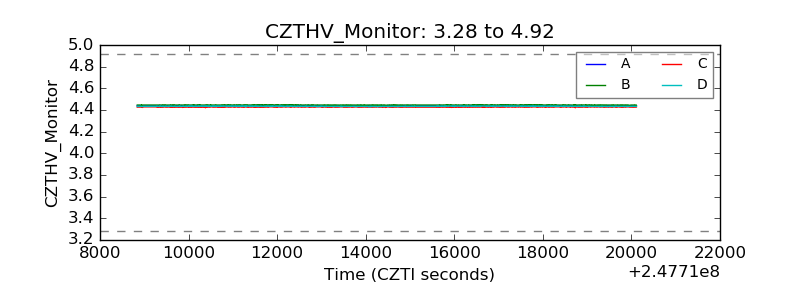 |
| D_VDD | 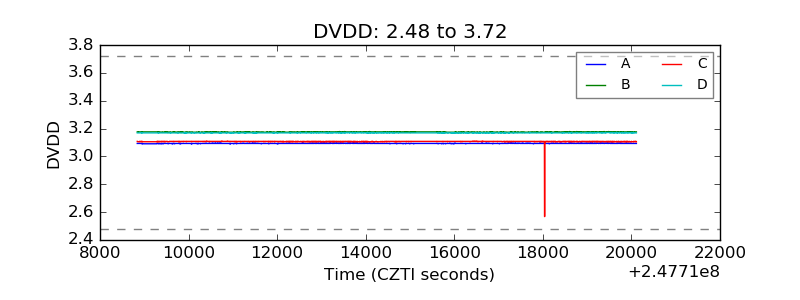 |
| Temperature 1 | 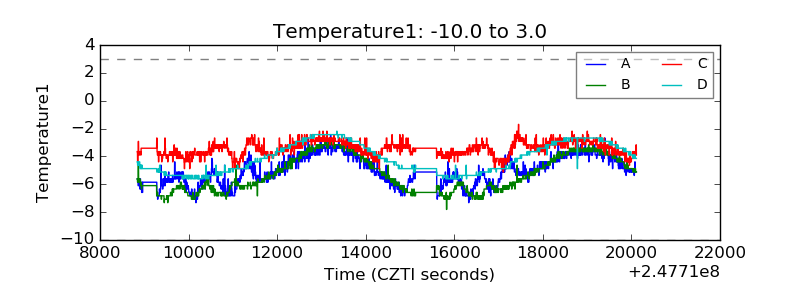 |
| Veto HV Monitor | 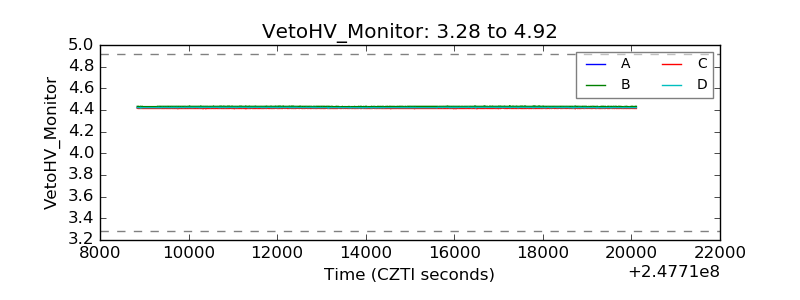 |
| Veto LLD | 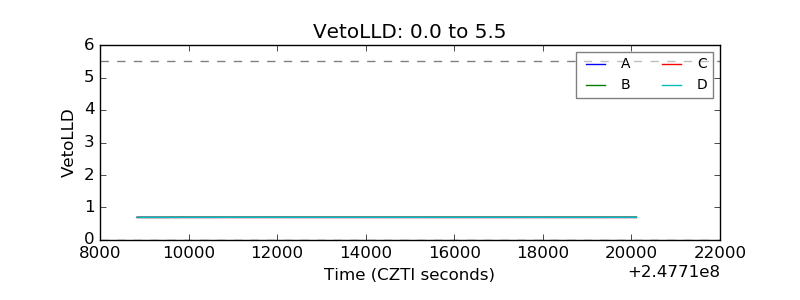 |
| Alpha Counter | 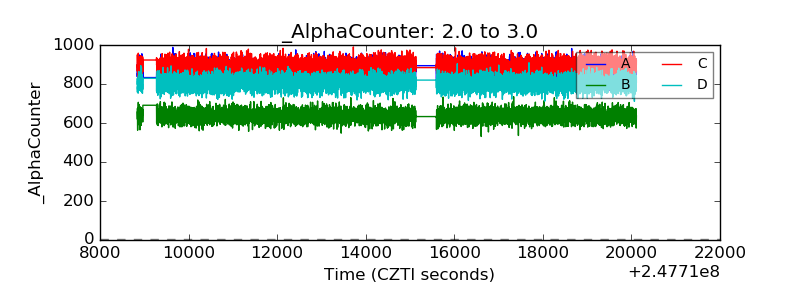 |
| _CPM_Rate | 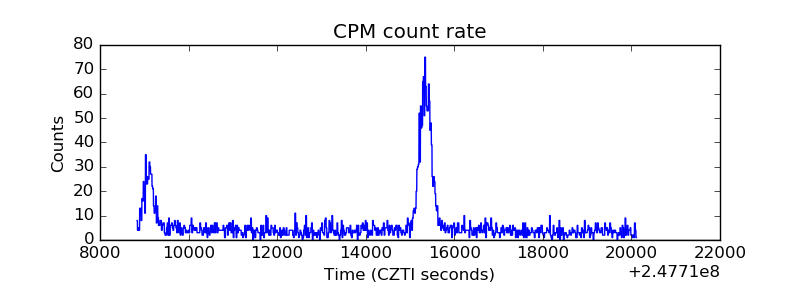 |
| CZT Counter | 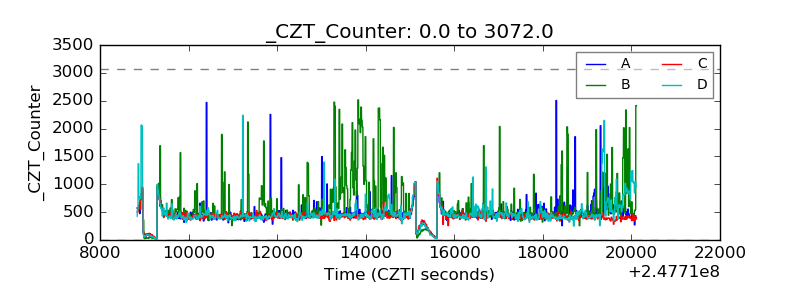 |
| +2.5 Volts monitor |  |
| +5 Volts monitor |  |
| _ROLL_ROT | 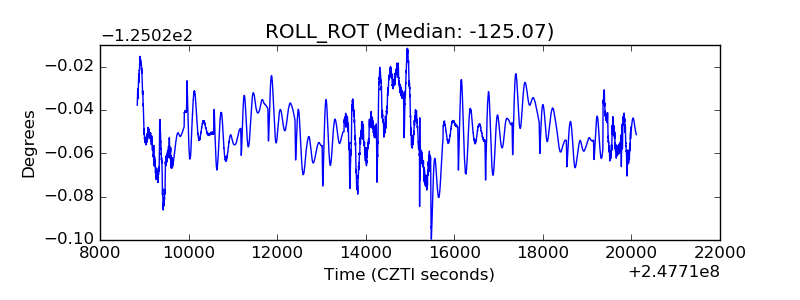 |
| _Roll_DEC |  |
| _Roll_RA | 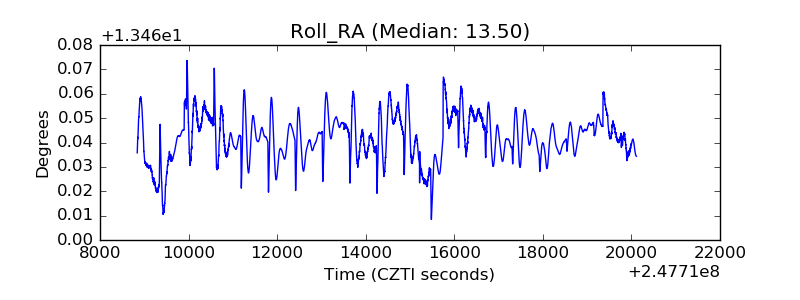 |
| Veto Counter | 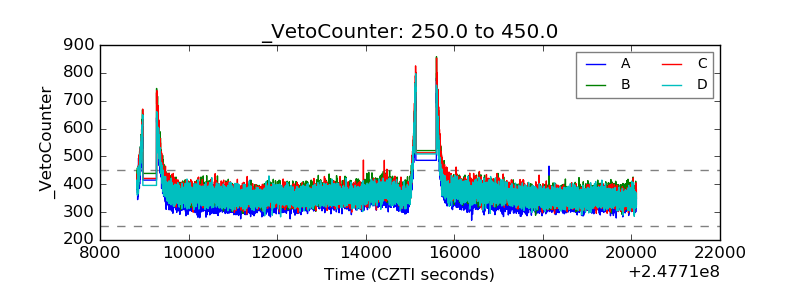 |