| Param | Original file | Final file |
|---|---|---|
| Filename | modeM0/AS1A04_024T04_9000001670cztM0_level2.fits | modeM0/AS1A04_024T04_9000001670cztM0_level2_quad_clean.evt |
| Size (bytes) | 710,487,360 | 752,739,840 |
| Size | 677.6 MB | 717.9 MB |
| Events in quadrant A | 4,308,882 | 4,624,806 |
| Events in quadrant B | 4,042,786 | 4,427,078 |
| Events in quadrant C | 4,265,368 | 4,484,671 |
| Events in quadrant D | 3,670,062 | 4,034,997 |
| Mode M9 | |||
|---|---|---|---|
| Quadrant | BADHDUFLAG | Total packets | Discarded packets |
| A | 0 | 113 | 0 |
| B | 0 | 113 | 0 |
| C | 0 | 113 | 0 |
| D | 0 | 113 | 0 |
| Mode M0 | |||
|---|---|---|---|
| Quadrant | BADHDUFLAG | Total packets | Discarded packets |
| A | 0 | 188417 | 0 |
| B | 0 | 225222 | 0 |
| C | 0 | 155993 | 0 |
| D | 0 | 195212 | 0 |
| Mode SS | |||
|---|---|---|---|
| Quadrant | BADHDUFLAG | Total packets | Discarded packets |
| A | 0 | 1548 | 0 |
| B | 0 | 1548 | 0 |
| C | 0 | 1548 | 0 |
| D | 0 | 1548 | 0 |
| Quadrant | Total seconds | Saturated seconds | Saturation percentage |
|---|---|---|---|
| A | 76218 | 2411 | 3.163295% |
| B | 76218 | 6685 | 8.770894% |
| C | 76218 | 447 | 0.586476% |
| D | 76218 | 2518 | 3.303682% |
Noise dominated data is calculated using 1-second bins in cleaned event files. If a bin has >2000 counts, and if more than 50% of those come from <1% of pixels, then it is considered to be noise-dominated and hence unusable.
| Quadrant | # 1 sec bins | Bins with >0 counts | Bins with >2000 counts | High rate bins dominated by noise | Noise dominated (total time) | Noise dominated (detector-on time) | Marked lightcurve |
|---|---|---|---|---|---|---|---|
| A | 87493 | 76216 | 0 | 0 | 0.00% | 0.00% |  |
| B | 87493 | 76172 | 0 | 0 | 0.00% | 0.00% |  |
| C | 87493 | 76218 | 0 | 0 | 0.00% | 0.00% |  |
| D | 87493 | 76180 | 0 | 0 | 0.00% | 0.00% |  |
Top three noisy pixels from each quadrant. If the there are fewer than three noisy pixels in the level2.evt file, extra rows are filled as -1
| Pixel properties | Quadrant properties | ||||||
|---|---|---|---|---|---|---|---|
| Quadrant | DetID | PixID | Counts | Sigma | Mean | Median | Sigma |
| A | 0 | 29 | 4074 | 10.74 | 1123 | 1055 | 281.0 |
| A | 7 | 110 | 3461 | 8.56 | 1123 | 1055 | 281.0 |
| A | 9 | 19 | 3340 | 8.13 | 1123 | 1055 | 281.0 |
| B | 2 | 9 | 3487 | 11.79 | 1068 | 1018 | 209.4 |
| B | 14 | 254 | 2711 | 8.09 | 1068 | 1018 | 209.4 |
| B | 3 | 17 | 2669 | 7.89 | 1068 | 1018 | 209.4 |
| C | 12 | 241 | 3026 | 6.8 | 1127 | 1052 | 290.2 |
| C | 2 | 191 | 2938 | 6.5 | 1127 | 1052 | 290.2 |
| C | 3 | 126 | 2803 | 6.03 | 1127 | 1052 | 290.2 |
| D | 6 | 231 | 2695 | 6.21 | 1046 | 951 | 280.7 |
| D | 3 | 14 | 2690 | 6.19 | 1046 | 951 | 280.7 |
| D | 7 | 5 | 2653 | 6.06 | 1046 | 951 | 280.7 |
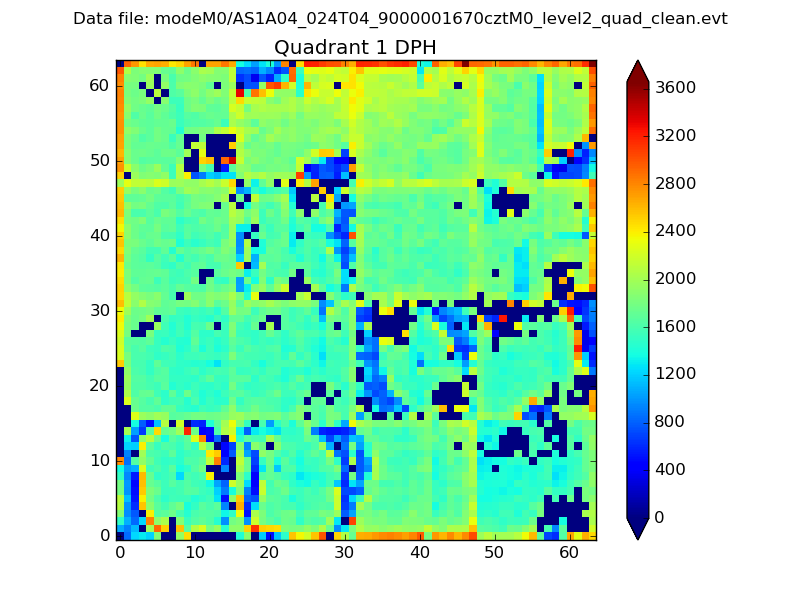
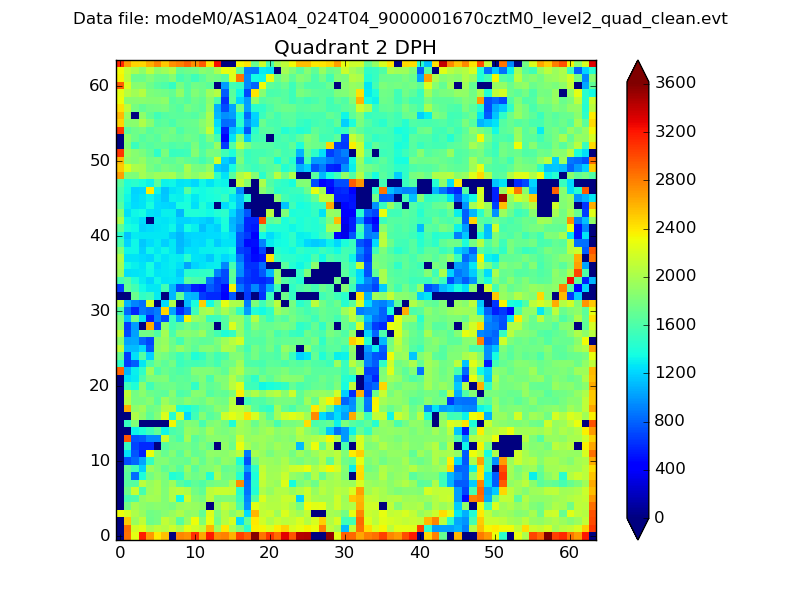
Histogram calculated using DETX and DETY for each event in the final _common_clean file
| Quadrant A |  |
 |
Quadrant B |
|---|---|---|---|
| Quadrant D |  |
 |
Quadrant C |
| Plot type | Count rate plots | Images |
|---|---|---|
| Comparison with Poisson distribution Blue bars denote a histogram of data divided into 1 sec bins. Red curve is a Poisson curve with rate = median count rate of data. |
 |
 |
| Quadrant-wise count rates Data is divided into 100 sec bins |
 |
|
| Module-wise count rates for Quadrant A Data is divided into 100 sec bins |
 |
 |
| Module-wise count rates for Quadrant B Data is divided into 100 sec bins |
 |
 |
| Module-wise count rates for Quadrant C Data is divided into 100 sec bins |
 |
 |
| Module-wise count rates for Quadrant D Data is divided into 100 sec bins |
 |
 |
| Parameter | Plot |
|---|---|
| CZT HV Monitor |  |
| D_VDD |  |
| Temperature 1 |  |
| Veto HV Monitor |  |
| Veto LLD |  |
| Alpha Counter |  |
| _CPM_Rate |  |
| CZT Counter |  |
| +2.5 Volts monitor |  |
| +5 Volts monitor |  |
| _ROLL_ROT |  |
| _Roll_DEC |  |
| _Roll_RA |  |
| Veto Counter |  |