| Param | Original file | Final file |
|---|---|---|
| Filename | modeM0/AS1A04_024T04_9000001670_11417cztM0_level2.evt | modeM0/AS1A04_024T04_9000001670_11417cztM0_level2_quad_clean.evt |
| Size (bytes) | 560,234,880 | 90,106,560 |
| Size | 534.3 MB | 85.9 MB |
| Events in quadrant A | 4,678,587 | 577,054 |
| Events in quadrant B | 5,118,788 | 572,754 |
| Events in quadrant C | 2,899,845 | 585,075 |
| Events in quadrant D | 3,843,103 | 554,279 |
| Mode M9 | |||
|---|---|---|---|
| Quadrant | BADHDUFLAG | Total packets | Discarded packets |
| A | 0 | 12 | 0 |
| B | 0 | 12 | 0 |
| C | 0 | 12 | 0 |
| D | 0 | 12 | 0 |
| Mode M0 | |||
|---|---|---|---|
| Quadrant | BADHDUFLAG | Total packets | Discarded packets |
| A | 0 | 18093 | 2 |
| B | 0 | 19394 | 1 |
| C | 0 | 12935 | 1 |
| D | 0 | 15609 | 1 |
| Mode SS | |||
|---|---|---|---|
| Quadrant | BADHDUFLAG | Total packets | Discarded packets |
| A | 0 | 126 | 0 |
| B | 0 | 126 | 0 |
| C | 0 | 126 | 0 |
| D | 0 | 126 | 0 |
| Quadrant | Total seconds | Saturated seconds | Saturation percentage |
|---|---|---|---|
| A | 6302 | 342 | 5.426849% |
| B | 6302 | 493 | 7.822913% |
| C | 6302 | 16 | 0.253888% |
| D | 6302 | 114 | 1.808950% |
Noise dominated data is calculated using 1-second bins in cleaned event files. If a bin has >2000 counts, and if more than 50% of those come from <1% of pixels, then it is considered to be noise-dominated and hence unusable.
| Quadrant | # 1 sec bins | Bins with >0 counts | Bins with >2000 counts | High rate bins dominated by noise | Noise dominated (total time) | Noise dominated (detector-on time) | Marked lightcurve |
|---|---|---|---|---|---|---|---|
| A | 7412 | 6303 | 206 | 206 | 2.78% | 3.27% | 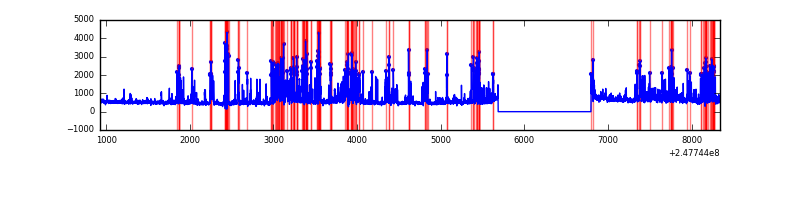 |
| B | 7412 | 6303 | 258 | 258 | 3.48% | 4.09% | 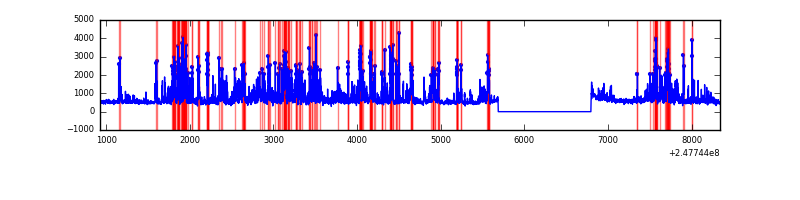 |
| C | 7412 | 6303 | 0 | 0 | 0.00% | 0.00% | 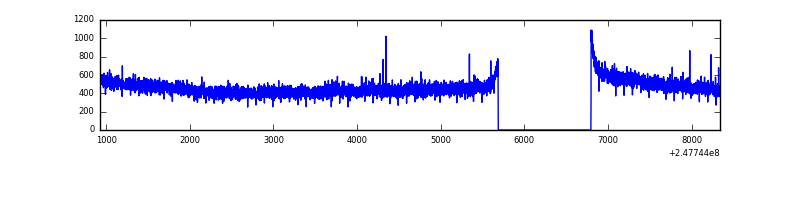 |
| D | 7412 | 6303 | 62 | 62 | 0.84% | 0.98% | 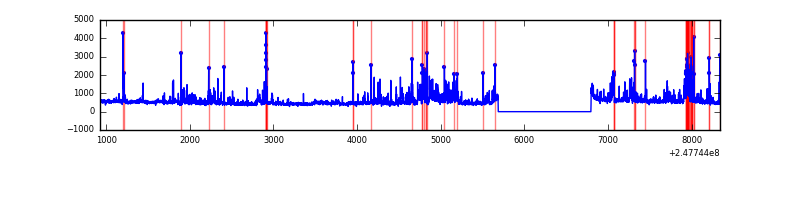 |
Top three noisy pixels from each quadrant. If the there are fewer than three noisy pixels in the level2.evt file, extra rows are filled as -1
| Pixel properties | Quadrant properties | ||||||
|---|---|---|---|---|---|---|---|
| Quadrant | DetID | PixID | Counts | Sigma | Mean | Median | Sigma |
| A | 8 | 5 | 1665390 | 10910.44 | 757 | 742 | 152.6 |
| A | 11 | 29 | 21469 | 135.85 | 757 | 742 | 152.6 |
| A | 8 | 15 | 20033 | 126.43 | 757 | 742 | 152.6 |
| B | 4 | 239 | 1762105 | 12479.5 | 745 | 727 | 141.1 |
| B | 11 | 51 | 165862 | 1169.99 | 745 | 727 | 141.1 |
| B | 3 | 189 | 98076 | 689.73 | 745 | 727 | 141.1 |
| C | 13 | 61 | 5526 | 28.03 | 743 | 745 | 170.5 |
| C | 3 | 202 | 1884 | 6.68 | 743 | 745 | 170.5 |
| C | 14 | 234 | 1734 | 5.8 | 743 | 745 | 170.5 |
| D | 1 | 52 | 234021 | 1320.38 | 746 | 726 | 176.7 |
| D | 13 | 104 | 191010 | 1076.95 | 746 | 726 | 176.7 |
| D | 13 | 152 | 165246 | 931.13 | 746 | 726 | 176.7 |
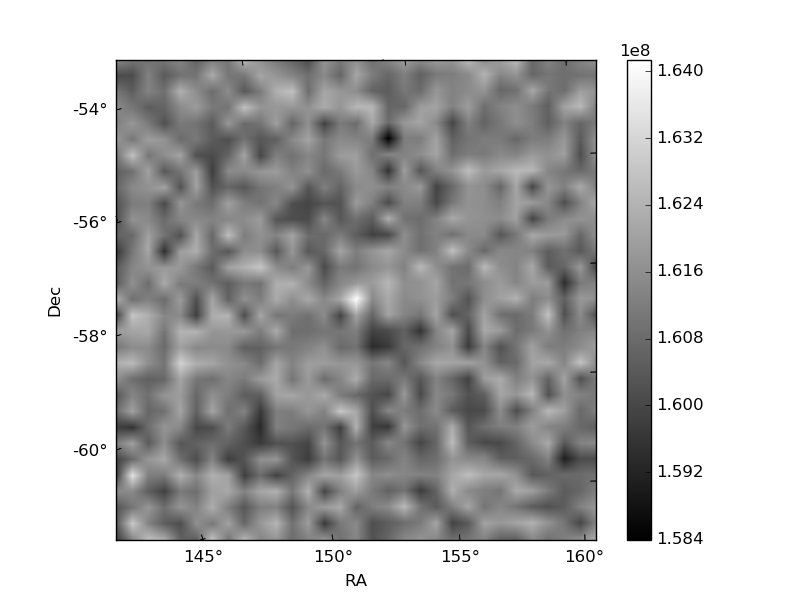
Histogram calculated using DETX and DETY for each event in the final _common_clean file
| Quadrant A | 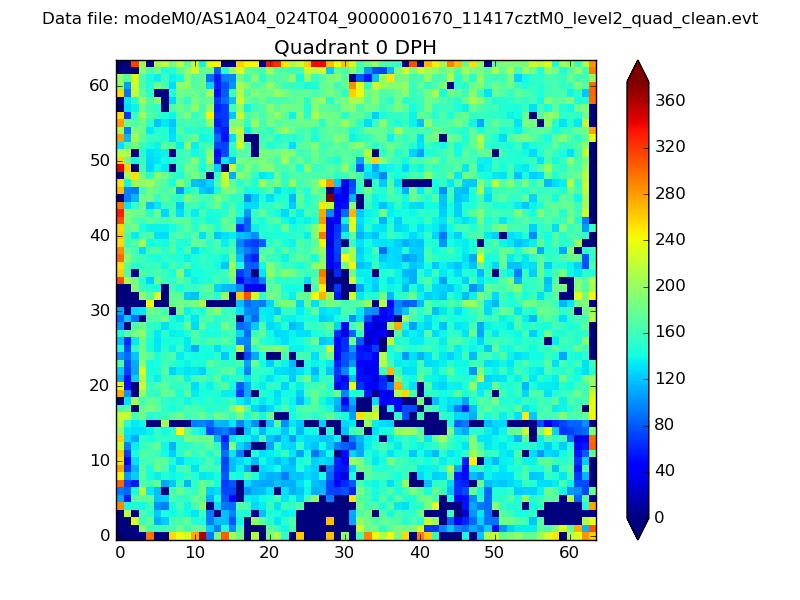 |
 |
Quadrant B |
|---|---|---|---|
| Quadrant D | 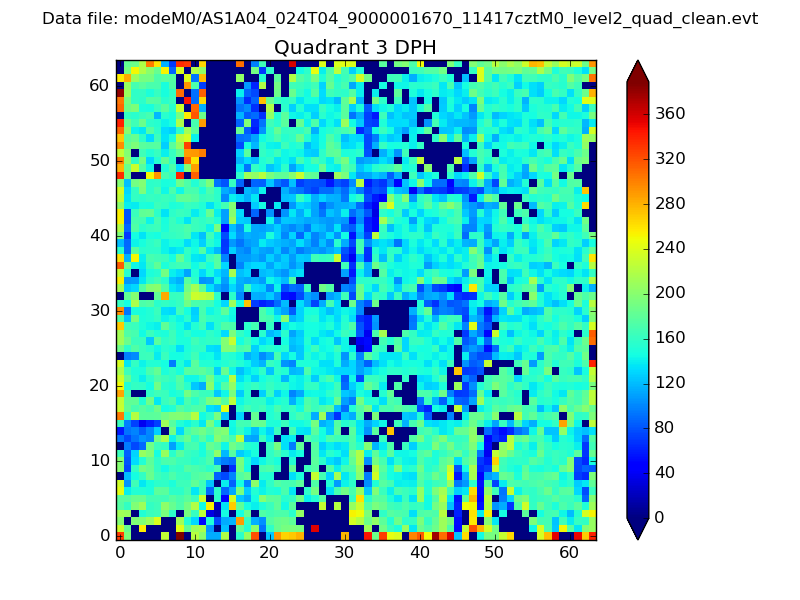 |
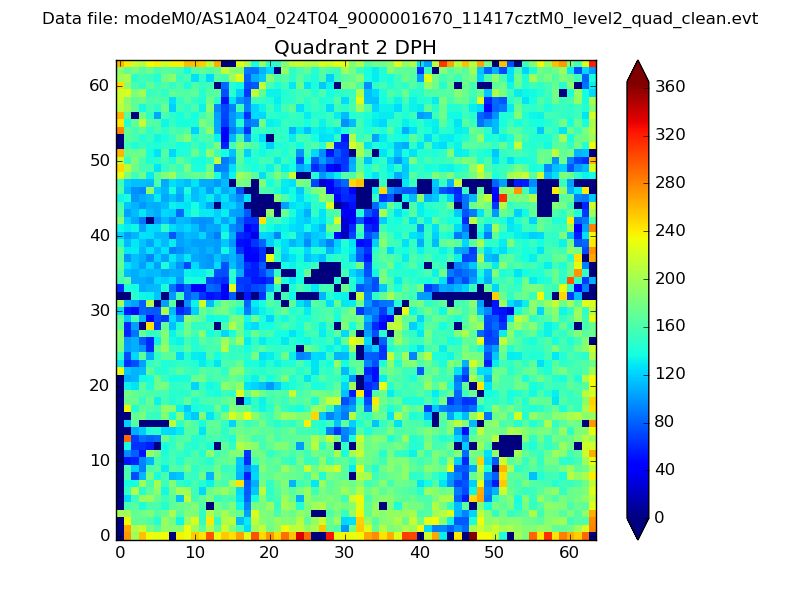 |
Quadrant C |
| Plot type | Count rate plots | Images |
|---|---|---|
| Comparison with Poisson distribution Blue bars denote a histogram of data divided into 1 sec bins. Red curve is a Poisson curve with rate = median count rate of data. |
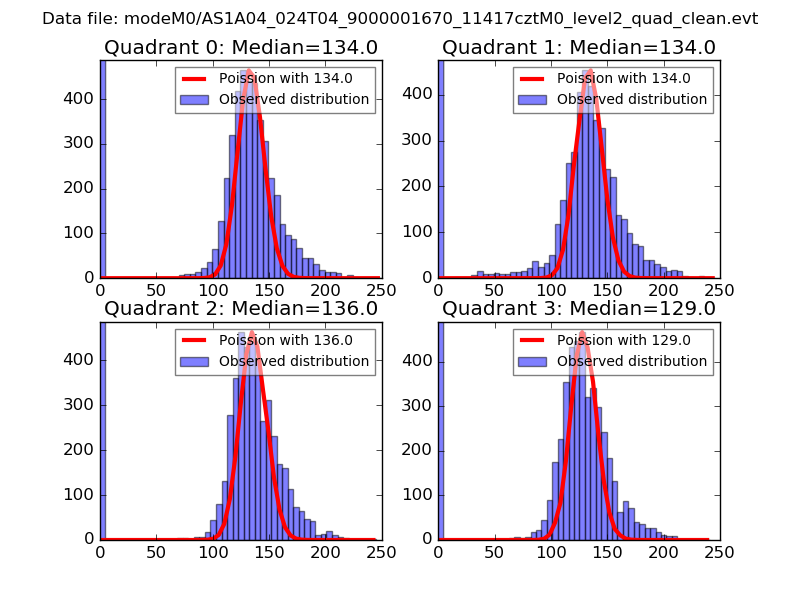 |
 |
| Quadrant-wise count rates Data is divided into 100 sec bins |
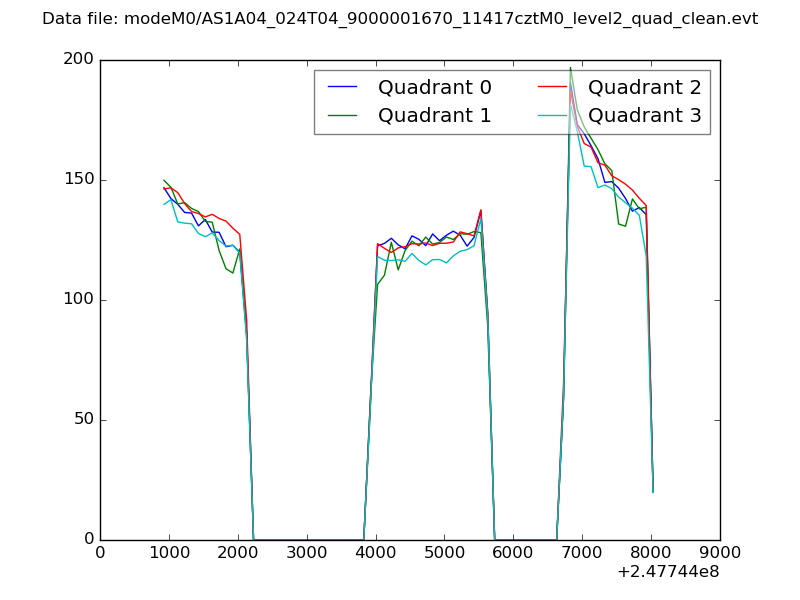 |
|
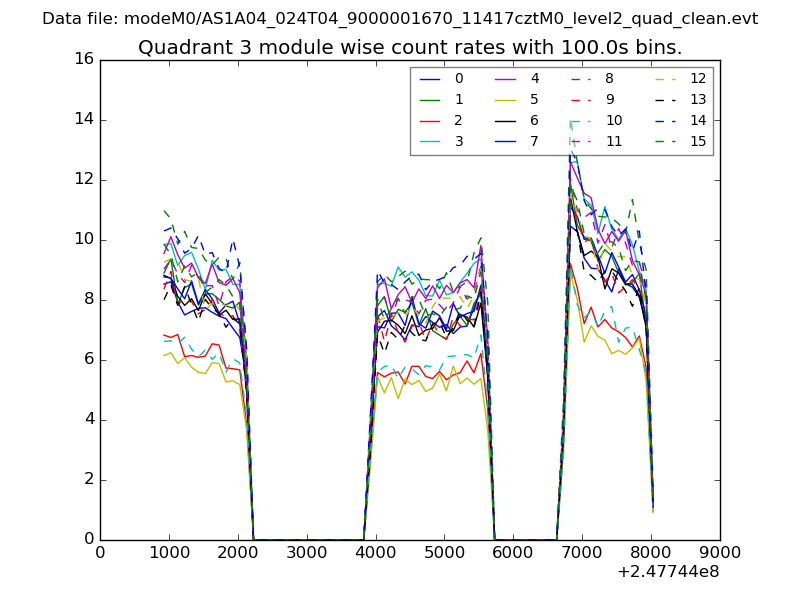
| Module-wise count rates for Quadrant A Data is divided into 100 sec bins |
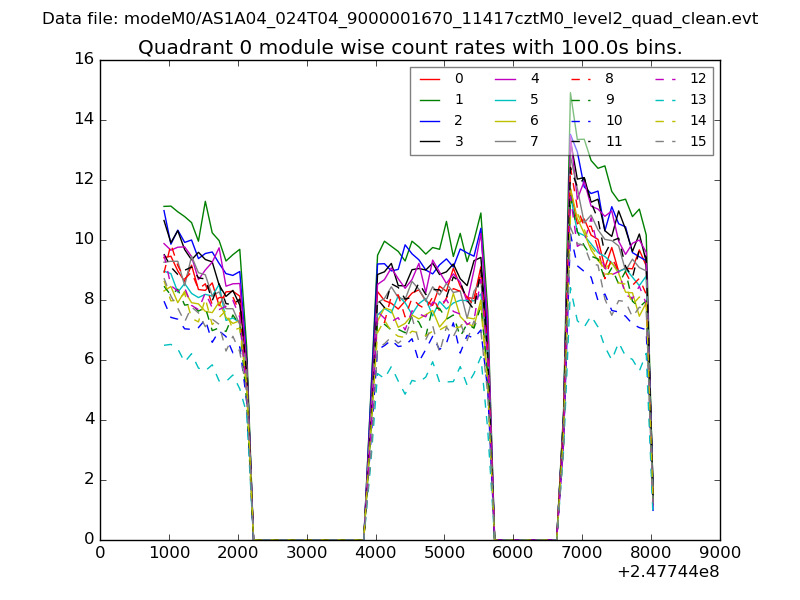 |
 |
| Module-wise count rates for Quadrant B Data is divided into 100 sec bins |
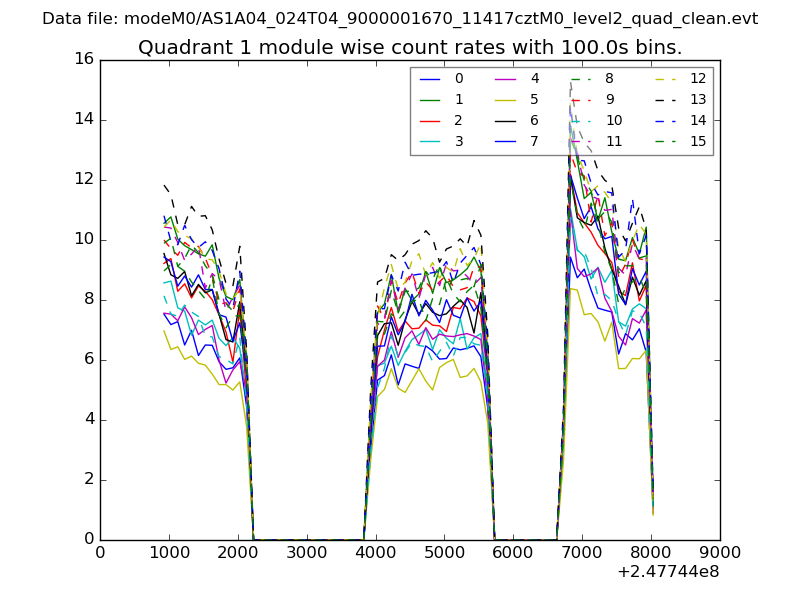 |
 |
| Module-wise count rates for Quadrant C Data is divided into 100 sec bins |
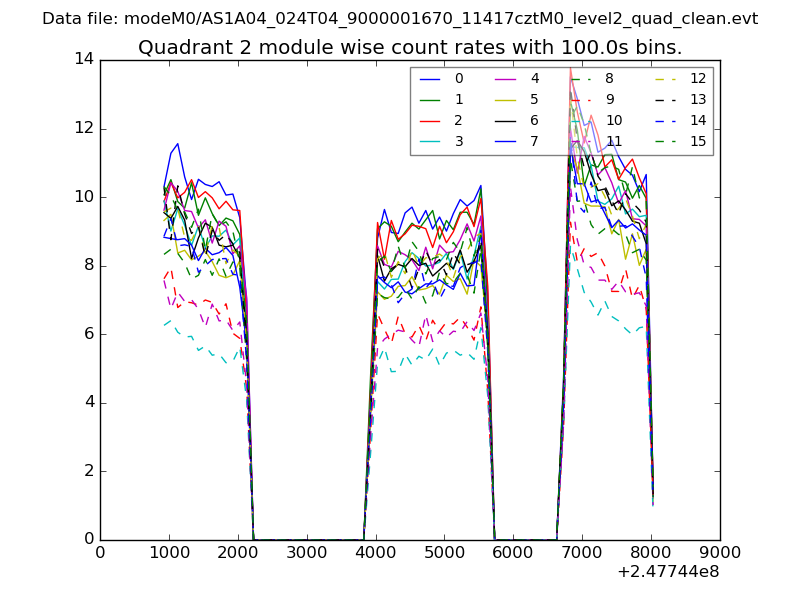 |
 |
| Module-wise count rates for Quadrant D Data is divided into 100 sec bins |
 |
 |
| Parameter | Plot |
|---|---|
| CZT HV Monitor | 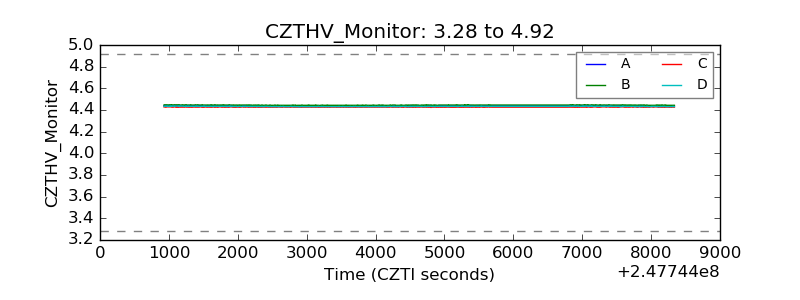 |
| D_VDD | 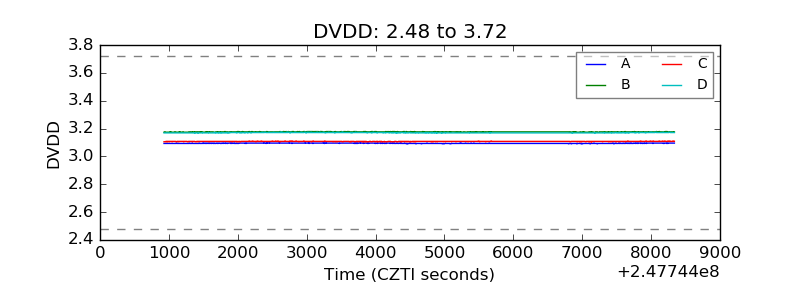 |
| Temperature 1 | 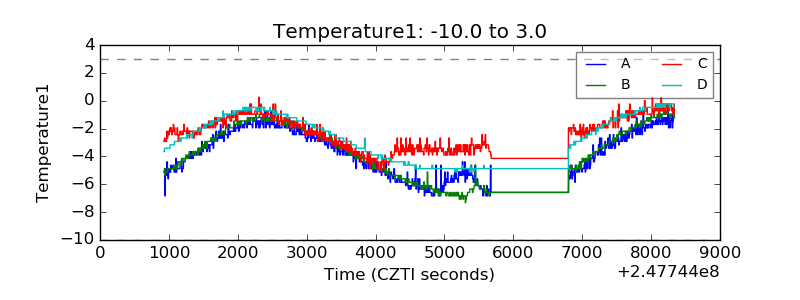 |
| Veto HV Monitor | 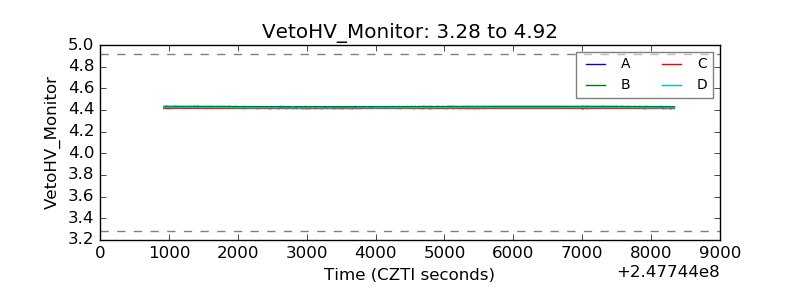 |
| Veto LLD | 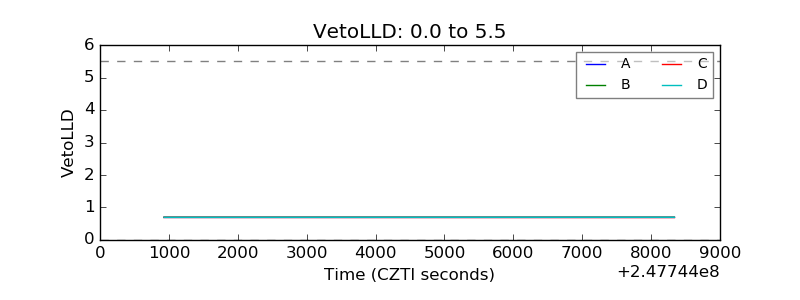 |
| Alpha Counter | 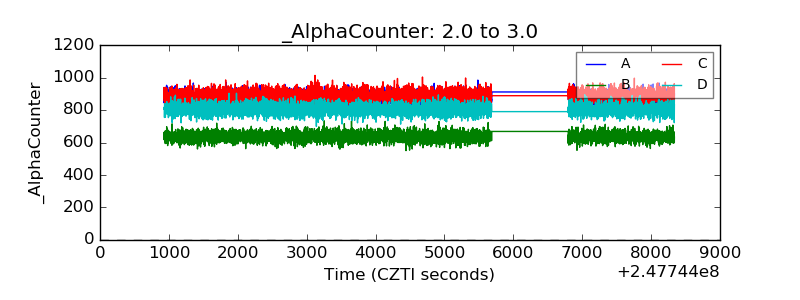 |
| _CPM_Rate | 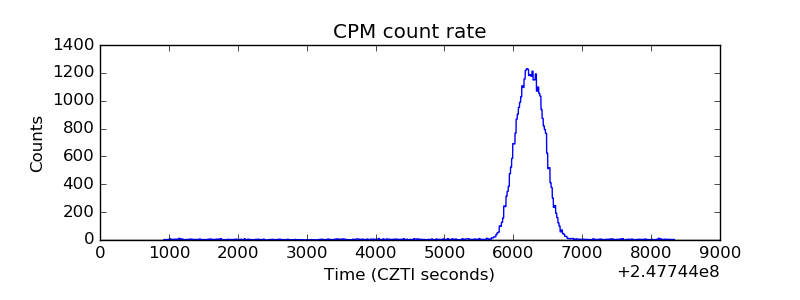 |
| CZT Counter | 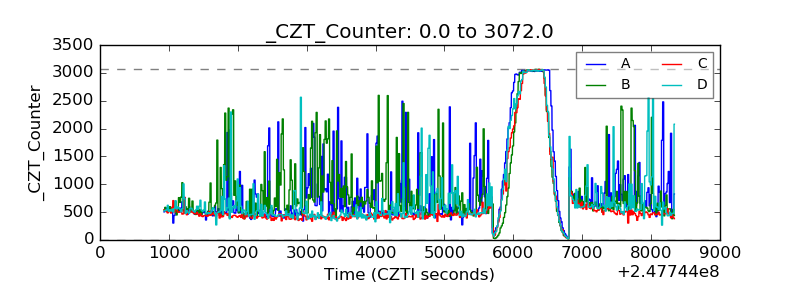 |
| +2.5 Volts monitor | 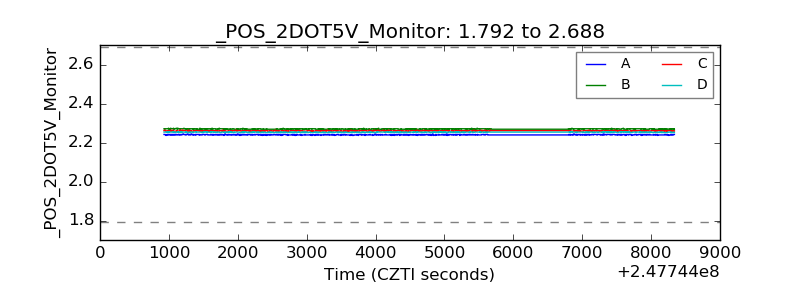 |
| +5 Volts monitor |  |
| _ROLL_ROT | 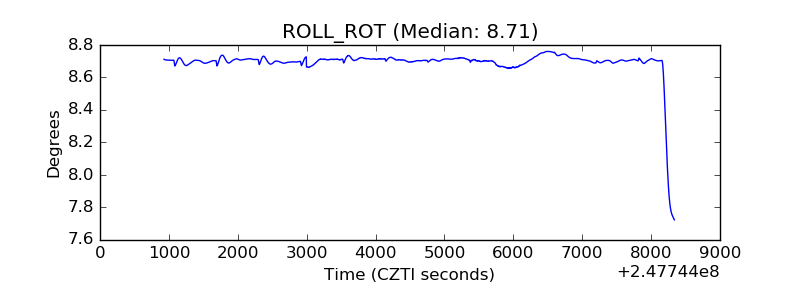 |
| _Roll_DEC | 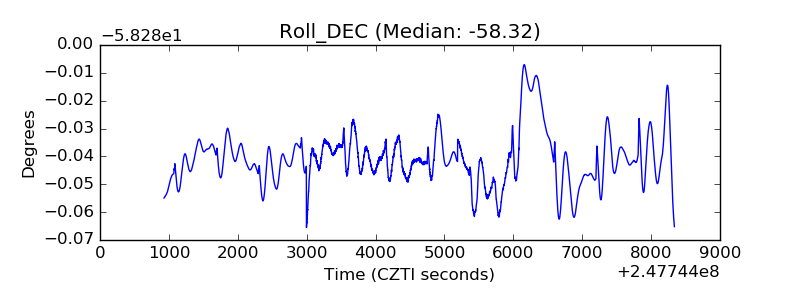 |
| _Roll_RA |  |
| Veto Counter | 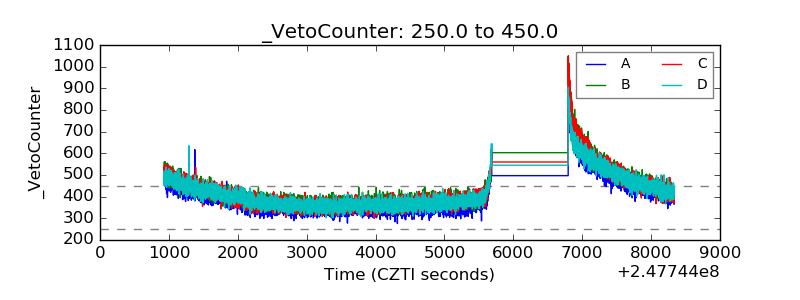 |