| Param | Original file | Final file |
|---|---|---|
| Filename | modeM0/AS1A04_024T04_9000001670_11419cztM0_level2.evt | modeM0/AS1A04_024T04_9000001670_11419cztM0_level2_quad_clean.evt |
| Size (bytes) | 590,630,400 | 83,462,400 |
| Size | 563.3 MB | 79.6 MB |
| Events in quadrant A | 4,336,588 | 533,925 |
| Events in quadrant B | 5,775,216 | 515,710 |
| Events in quadrant C | 3,149,682 | 528,378 |
| Events in quadrant D | 4,191,736 | 501,916 |
| Mode M9 | |||
|---|---|---|---|
| Quadrant | BADHDUFLAG | Total packets | Discarded packets |
| A | 0 | 13 | 0 |
| B | 0 | 13 | 0 |
| C | 0 | 13 | 0 |
| D | 0 | 13 | 0 |
| Mode M0 | |||
|---|---|---|---|
| Quadrant | BADHDUFLAG | Total packets | Discarded packets |
| A | 0 | 17254 | 3 |
| B | 0 | 21543 | 2 |
| C | 0 | 13541 | 2 |
| D | 0 | 16764 | 2 |
| Mode SS | |||
|---|---|---|---|
| Quadrant | BADHDUFLAG | Total packets | Discarded packets |
| A | 0 | 130 | 0 |
| B | 0 | 130 | 0 |
| C | 0 | 130 | 0 |
| D | 0 | 130 | 0 |
| Quadrant | Total seconds | Saturated seconds | Saturation percentage |
|---|---|---|---|
| A | 6409 | 208 | 3.245436% |
| B | 6409 | 804 | 12.544859% |
| C | 6409 | 55 | 0.858168% |
| D | 6410 | 179 | 2.792512% |
Noise dominated data is calculated using 1-second bins in cleaned event files. If a bin has >2000 counts, and if more than 50% of those come from <1% of pixels, then it is considered to be noise-dominated and hence unusable.
| Quadrant | # 1 sec bins | Bins with >0 counts | Bins with >2000 counts | High rate bins dominated by noise | Noise dominated (total time) | Noise dominated (detector-on time) | Marked lightcurve |
|---|---|---|---|---|---|---|---|
| A | 7699 | 6410 | 71 | 71 | 0.92% | 1.11% |  |
| B | 7699 | 6410 | 448 | 448 | 5.82% | 6.99% |  |
| C | 7699 | 6410 | 2 | 2 | 0.03% | 0.03% | 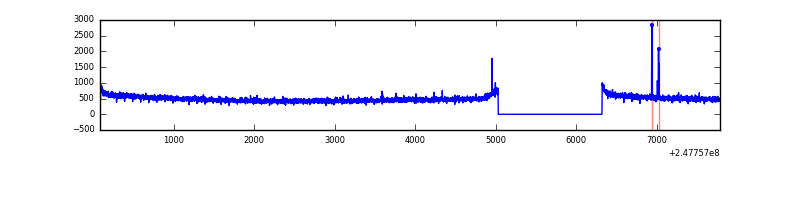 |
| D | 7700 | 6411 | 92 | 92 | 1.19% | 1.44% |  |
Top three noisy pixels from each quadrant. If the there are fewer than three noisy pixels in the level2.evt file, extra rows are filled as -1
| Pixel properties | Quadrant properties | ||||||
|---|---|---|---|---|---|---|---|
| Quadrant | DetID | PixID | Counts | Sigma | Mean | Median | Sigma |
| A | 8 | 5 | 920726 | 5532.92 | 835 | 819 | 166.3 |
| A | 1 | 162 | 54623 | 323.61 | 835 | 819 | 166.3 |
| A | 1 | 178 | 32048 | 187.83 | 835 | 819 | 166.3 |
| B | 4 | 239 | 1522046 | 10383.72 | 805 | 791 | 146.5 |
| B | 3 | 64 | 589614 | 4019.16 | 805 | 791 | 146.5 |
| B | 11 | 51 | 176177 | 1197.14 | 805 | 791 | 146.5 |
| C | 0 | 207 | 18891 | 99.33 | 802 | 805 | 182.1 |
| C | 13 | 61 | 5891 | 27.93 | 802 | 805 | 182.1 |
| C | 8 | 222 | 3667 | 15.72 | 802 | 805 | 182.1 |
| D | 5 | 222 | 398714 | 2080.72 | 805 | 784 | 191.2 |
| D | 1 | 52 | 272005 | 1418.18 | 805 | 784 | 191.2 |
| D | 13 | 152 | 108393 | 562.67 | 805 | 784 | 191.2 |
Histogram calculated using DETX and DETY for each event in the final _common_clean file
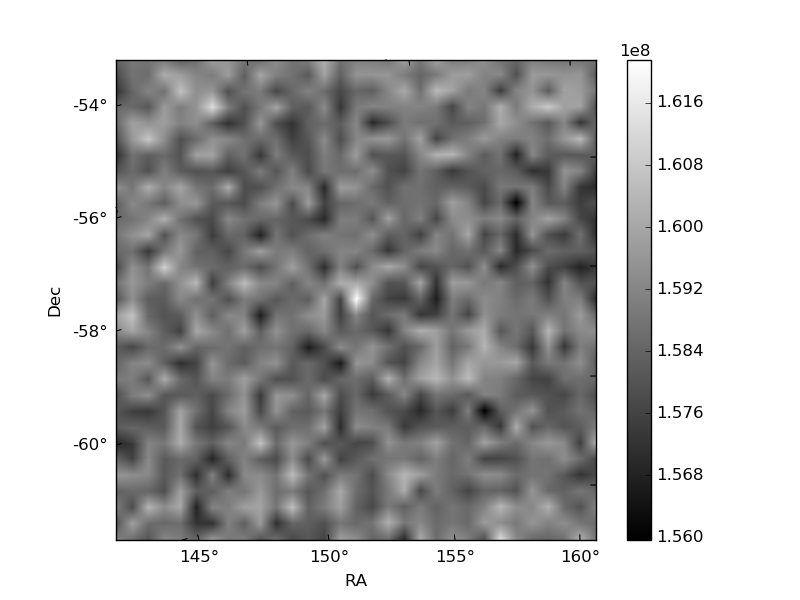
| Quadrant A | 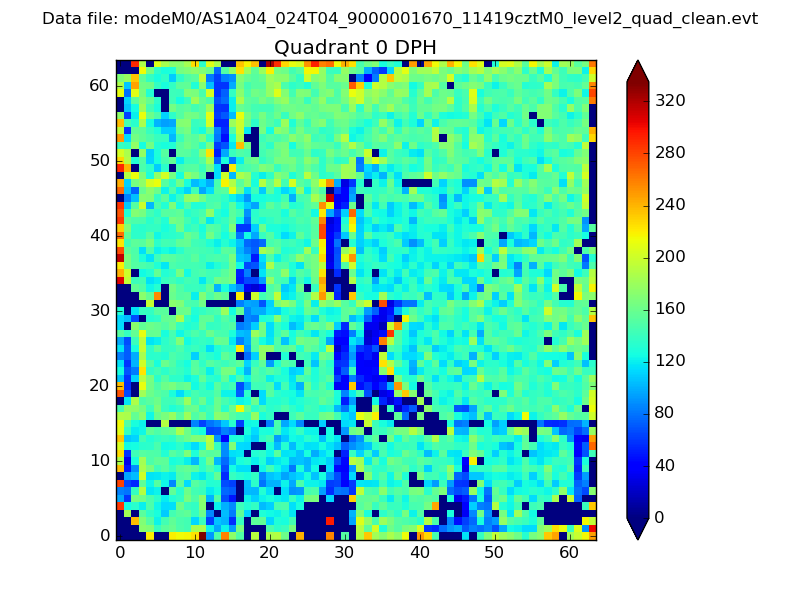 |
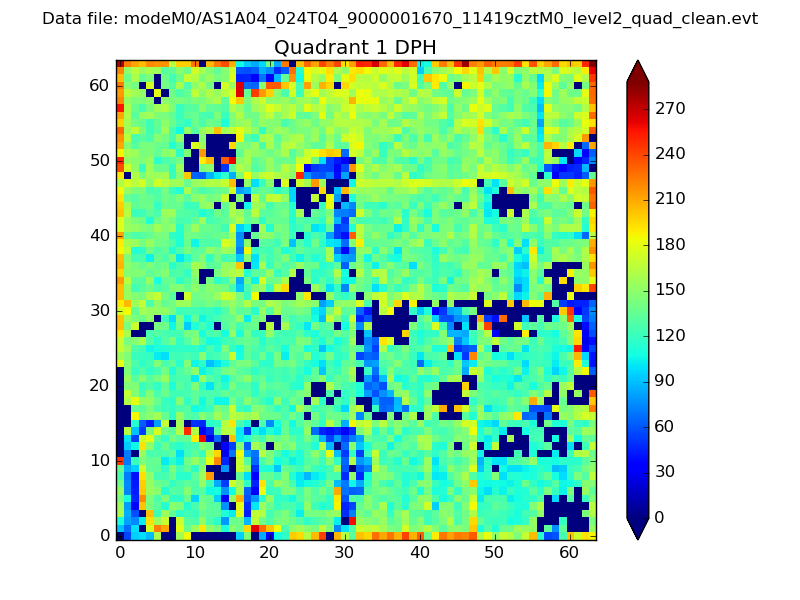 |
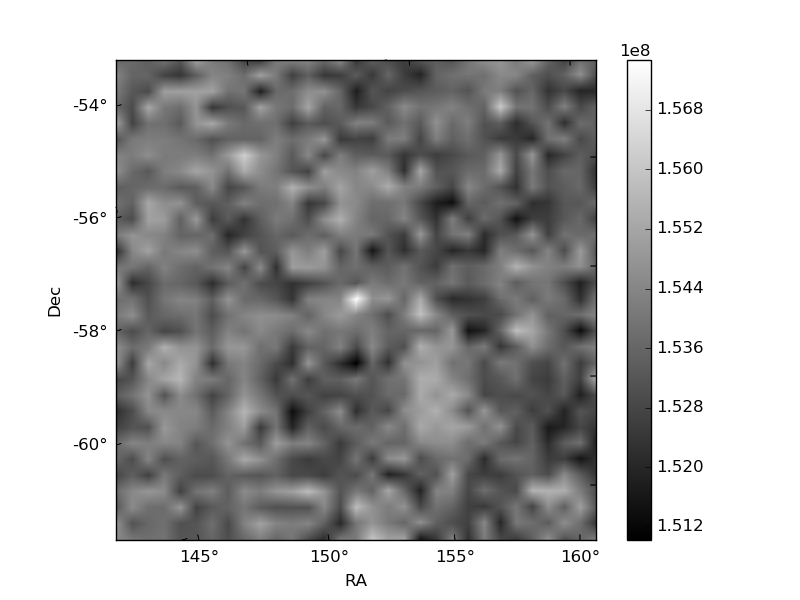
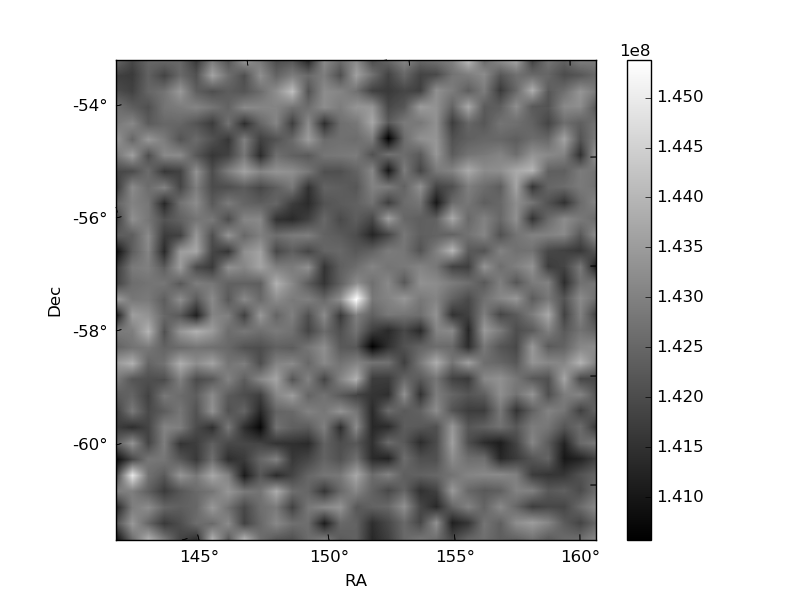
Quadrant B |
|---|---|---|---|
| Quadrant D | 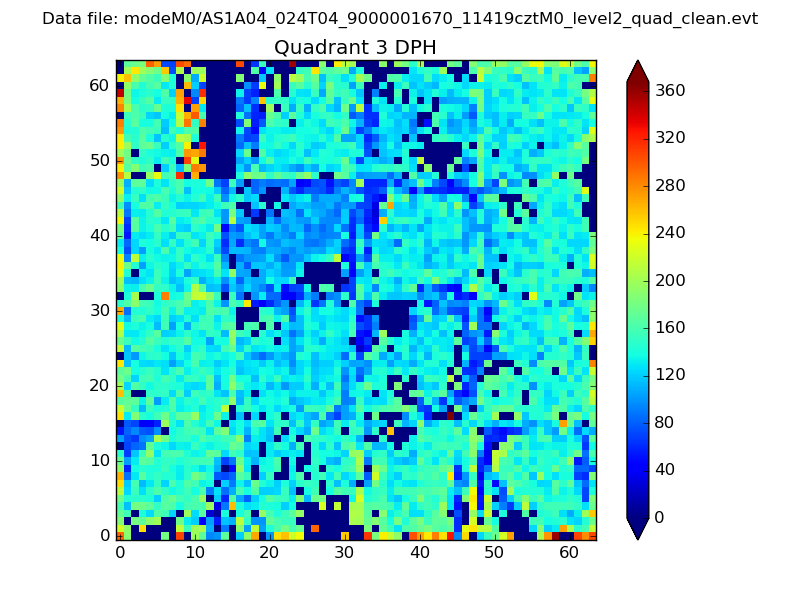 |
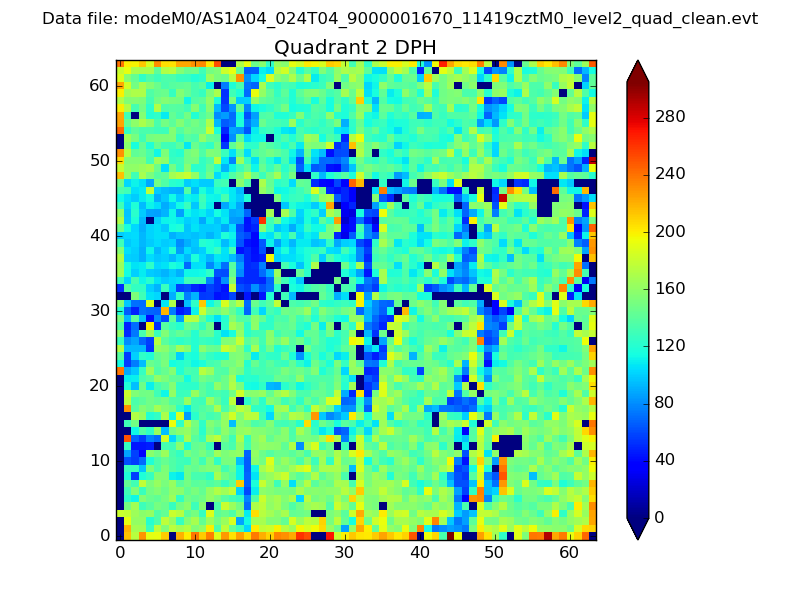 |
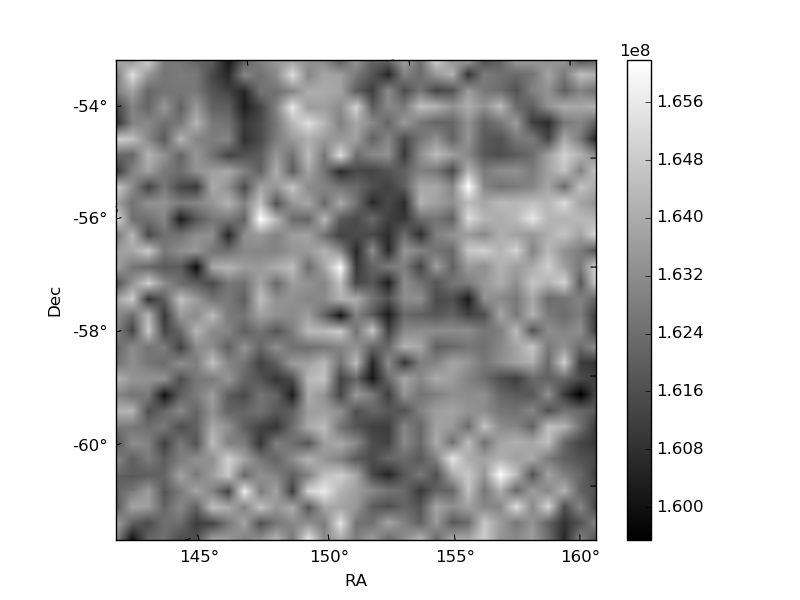
Quadrant C |
| Plot type | Count rate plots | Images |
|---|---|---|
| Comparison with Poisson distribution Blue bars denote a histogram of data divided into 1 sec bins. Red curve is a Poisson curve with rate = median count rate of data. |
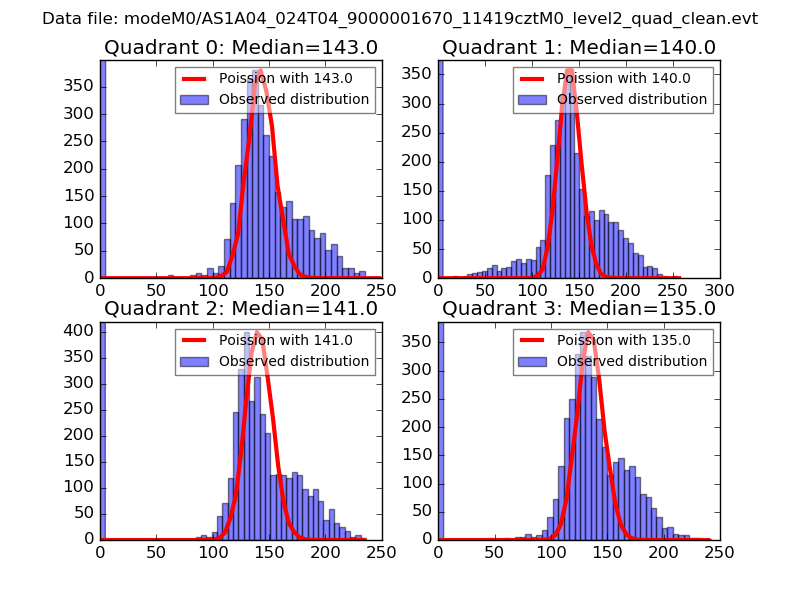 |
 |
| Quadrant-wise count rates Data is divided into 100 sec bins |
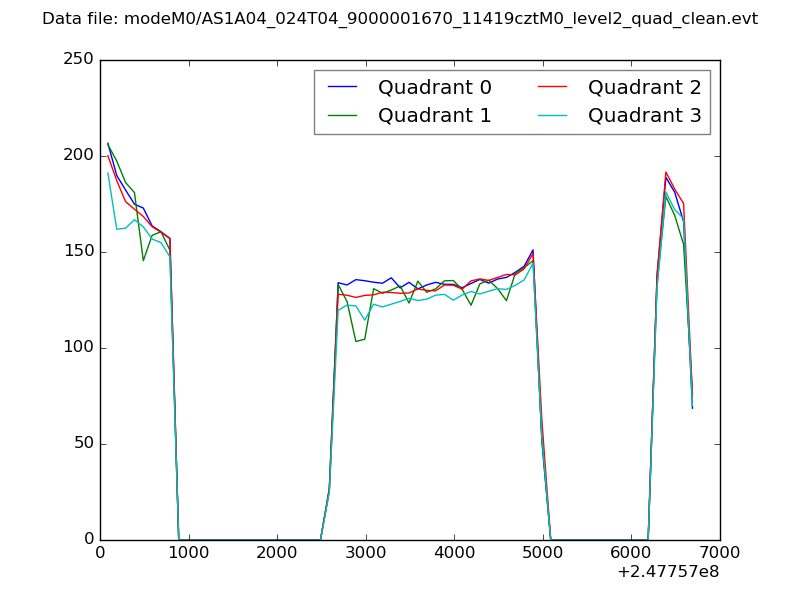 |
|
| Module-wise count rates for Quadrant A Data is divided into 100 sec bins |
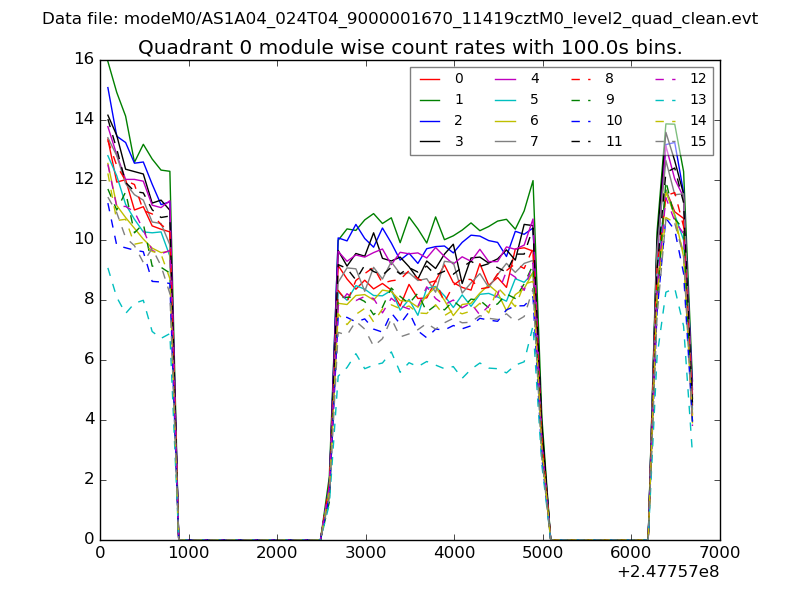 |
 |
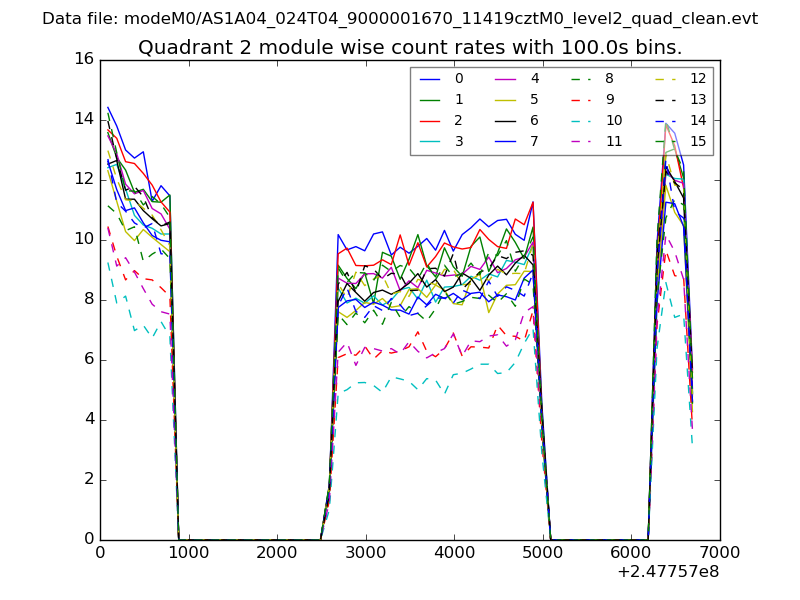
| Module-wise count rates for Quadrant B Data is divided into 100 sec bins |
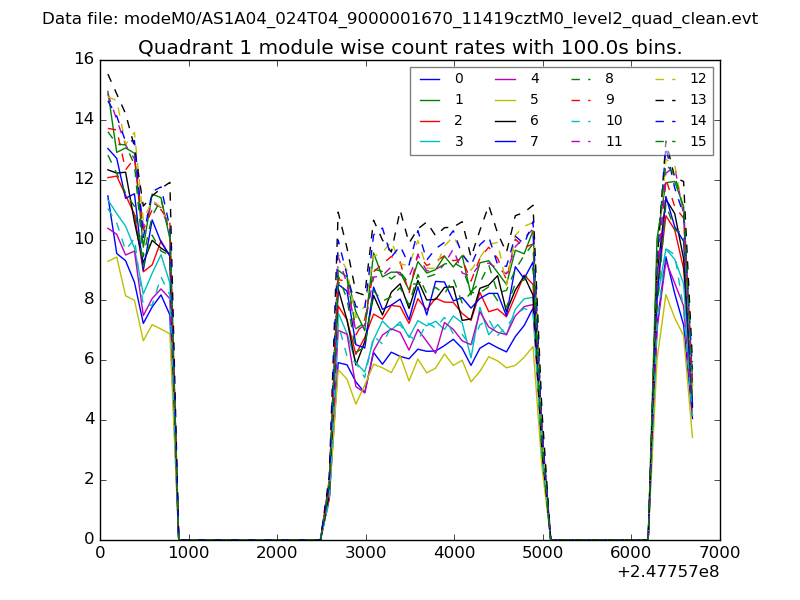 |
 |
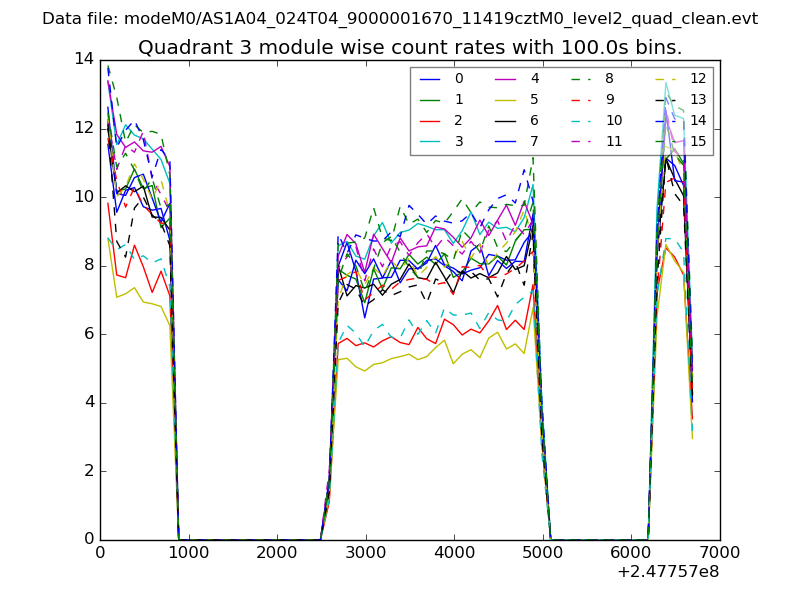
| Module-wise count rates for Quadrant C Data is divided into 100 sec bins |
 |
 |
| Module-wise count rates for Quadrant D Data is divided into 100 sec bins |
 |
 |
| Parameter | Plot |
|---|---|
| CZT HV Monitor | 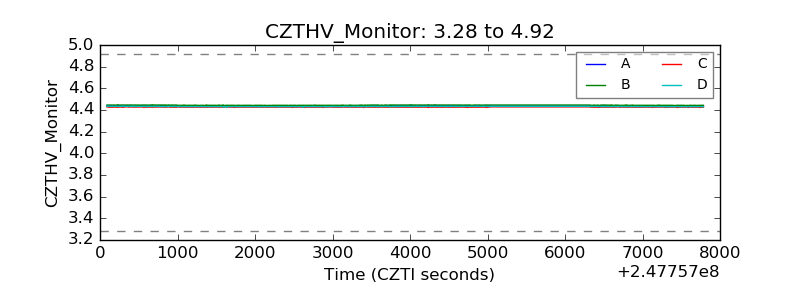 |
| D_VDD | 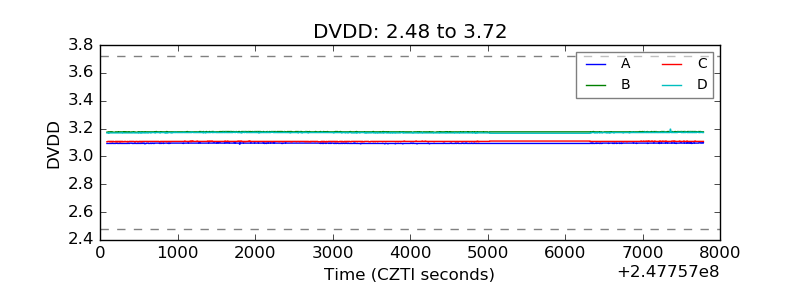 |
| Temperature 1 | 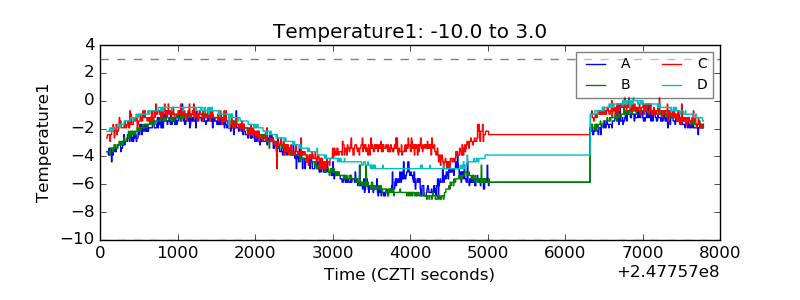 |
| Veto HV Monitor | 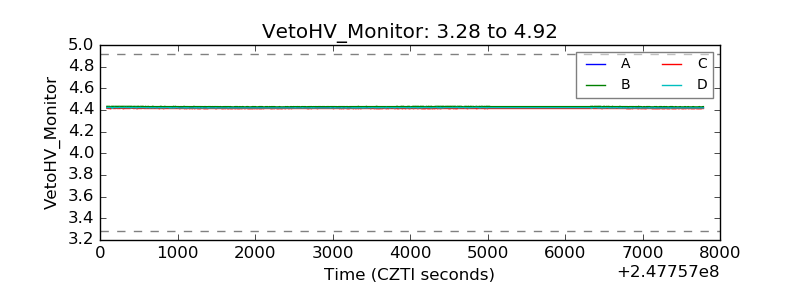 |
| Veto LLD |  |
| Alpha Counter | 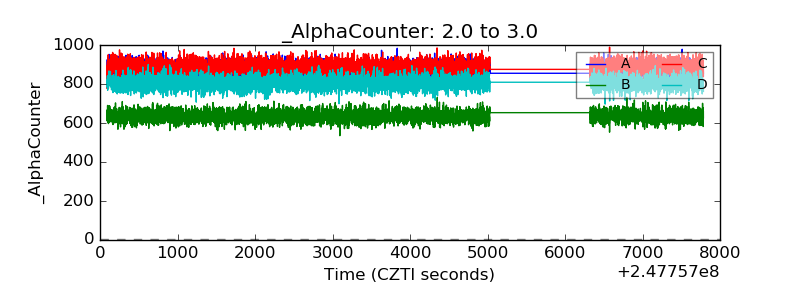 |
| _CPM_Rate | 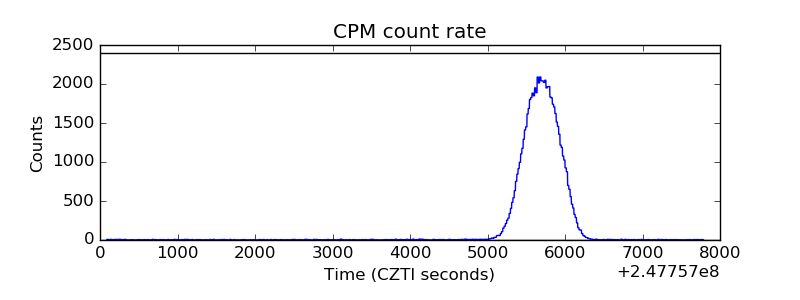 |
| CZT Counter | 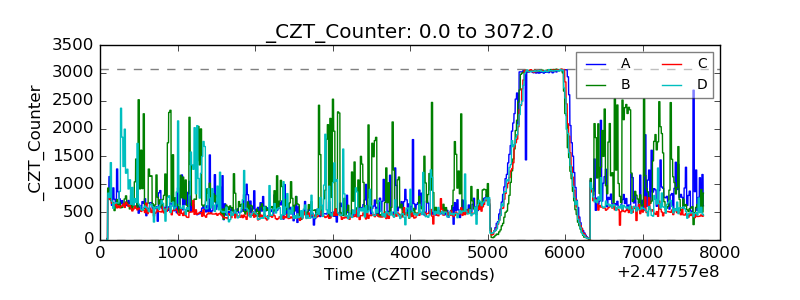 |
| +2.5 Volts monitor |  |
| +5 Volts monitor |  |
| _ROLL_ROT | 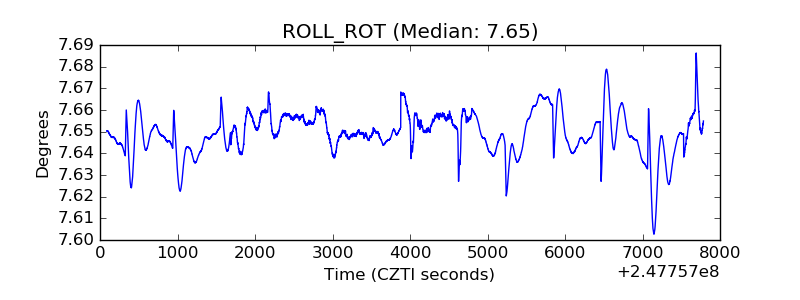 |
| _Roll_DEC | 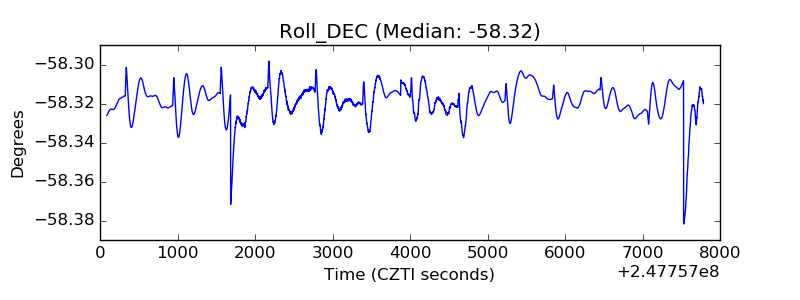 |
| _Roll_RA | 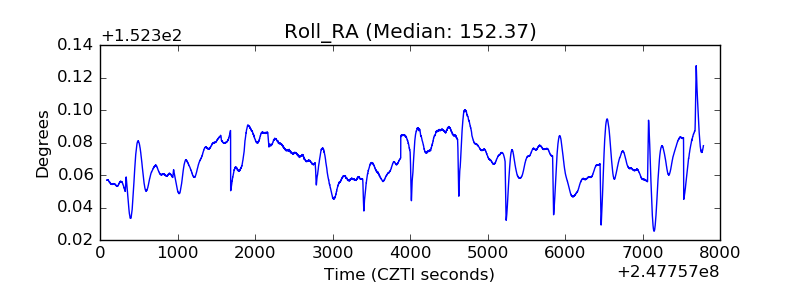 |
| Veto Counter | 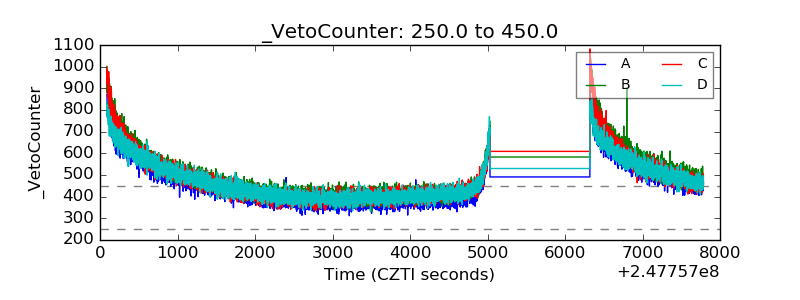 |