| Param | Original file | Final file |
|---|---|---|
| Filename | modeM0/AS1A04_024T04_9000001670_11420cztM0_level2.evt | modeM0/AS1A04_024T04_9000001670_11420cztM0_level2_quad_clean.evt |
| Size (bytes) | 561,732,480 | 65,361,600 |
| Size | 535.7 MB | 62.3 MB |
| Events in quadrant A | 4,635,403 | 394,558 |
| Events in quadrant B | 5,855,938 | 390,860 |
| Events in quadrant C | 2,932,253 | 391,345 |
| Events in quadrant D | 3,176,912 | 377,925 |
| Mode M9 | |||
|---|---|---|---|
| Quadrant | BADHDUFLAG | Total packets | Discarded packets |
| A | 0 | 13 | 0 |
| B | 0 | 13 | 0 |
| C | 0 | 13 | 0 |
| D | 0 | 13 | 0 |
| Mode M0 | |||
|---|---|---|---|
| Quadrant | BADHDUFLAG | Total packets | Discarded packets |
| A | 0 | 17884 | 2 |
| B | 0 | 21515 | 1 |
| C | 0 | 12579 | 1 |
| D | 0 | 13365 | 1 |
| Mode SS | |||
|---|---|---|---|
| Quadrant | BADHDUFLAG | Total packets | Discarded packets |
| A | 0 | 124 | 0 |
| B | 0 | 124 | 0 |
| C | 0 | 124 | 0 |
| D | 0 | 124 | 0 |
| Quadrant | Total seconds | Saturated seconds | Saturation percentage |
|---|---|---|---|
| A | 6073 | 402 | 6.619463% |
| B | 6073 | 921 | 15.165487% |
| C | 6073 | 61 | 1.004446% |
| D | 6073 | 88 | 1.449037% |
Noise dominated data is calculated using 1-second bins in cleaned event files. If a bin has >2000 counts, and if more than 50% of those come from <1% of pixels, then it is considered to be noise-dominated and hence unusable.
| Quadrant | # 1 sec bins | Bins with >0 counts | Bins with >2000 counts | High rate bins dominated by noise | Noise dominated (total time) | Noise dominated (detector-on time) | Marked lightcurve |
|---|---|---|---|---|---|---|---|
| A | 7378 | 6074 | 168 | 168 | 2.28% | 2.77% | 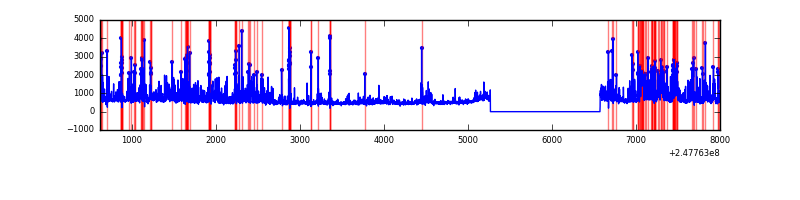 |
| B | 7378 | 6074 | 541 | 541 | 7.33% | 8.91% | 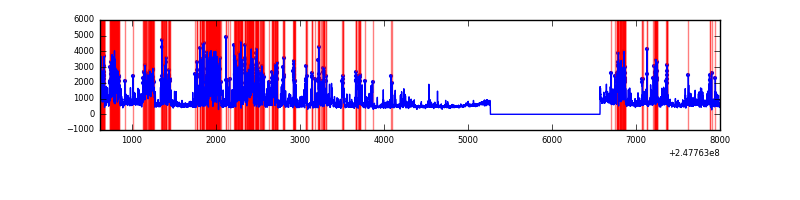 |
| C | 7378 | 6074 | 2 | 2 | 0.03% | 0.03% | 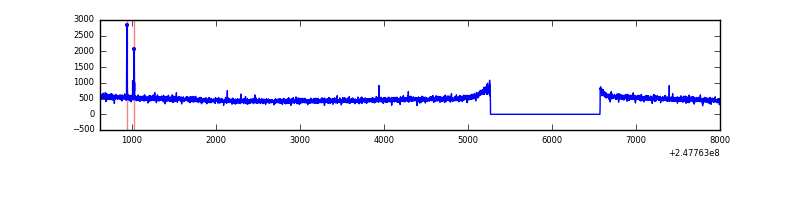 |
| D | 7378 | 6074 | 18 | 18 | 0.24% | 0.30% | 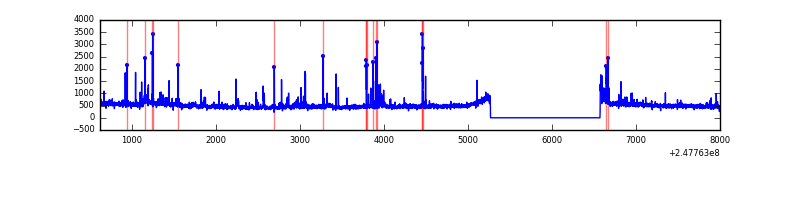 |
Top three noisy pixels from each quadrant. If the there are fewer than three noisy pixels in the level2.evt file, extra rows are filled as -1
| Pixel properties | Quadrant properties | ||||||
|---|---|---|---|---|---|---|---|
| Quadrant | DetID | PixID | Counts | Sigma | Mean | Median | Sigma |
| A | 8 | 5 | 1556639 | 10105.29 | 769 | 756 | 154.0 |
| A | 1 | 162 | 33152 | 210.41 | 769 | 756 | 154.0 |
| A | 15 | 174 | 17608 | 109.45 | 769 | 756 | 154.0 |
| B | 4 | 239 | 1360043 | 9899.0 | 743 | 728 | 137.3 |
| B | 3 | 64 | 1172105 | 8530.37 | 743 | 728 | 137.3 |
| B | 11 | 51 | 174335 | 1264.27 | 743 | 728 | 137.3 |
| C | 0 | 207 | 19591 | 111.09 | 747 | 750 | 169.6 |
| C | 13 | 61 | 5584 | 28.5 | 747 | 750 | 169.6 |
| C | 8 | 222 | 2442 | 9.98 | 747 | 750 | 169.6 |
| D | 13 | 137 | 61553 | 340.48 | 750 | 730 | 178.6 |
| D | 2 | 120 | 61505 | 340.21 | 750 | 730 | 178.6 |
| D | 1 | 52 | 54780 | 302.57 | 750 | 730 | 178.6 |
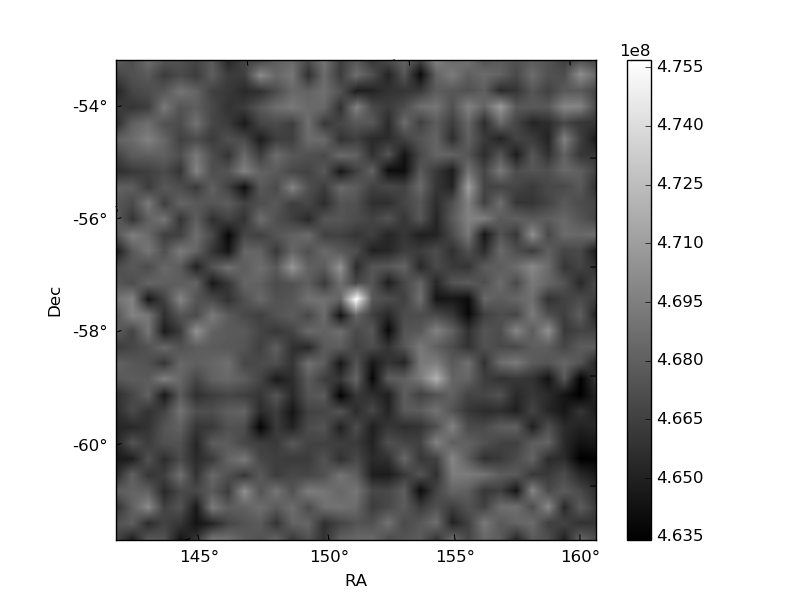
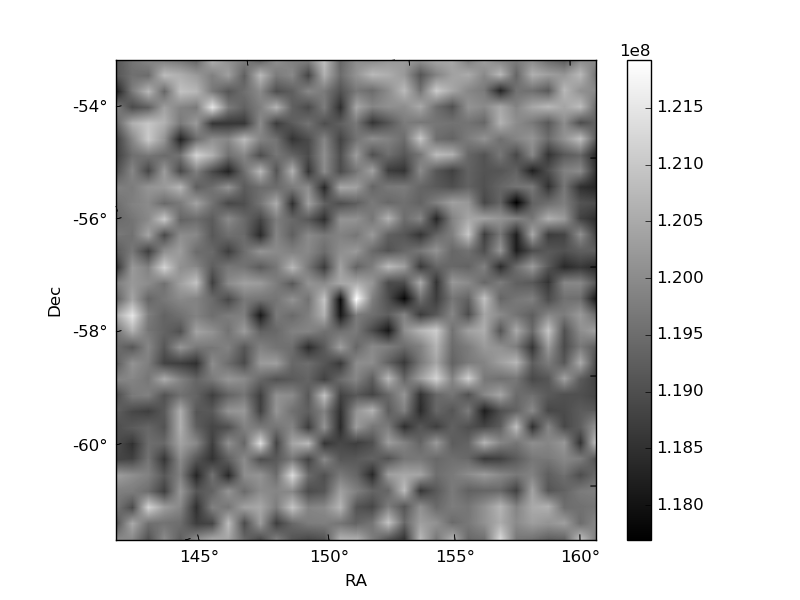
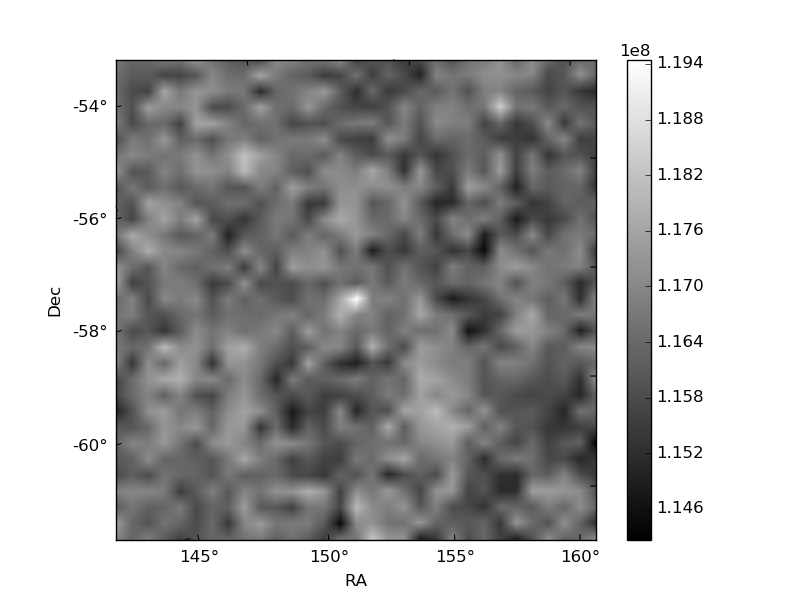
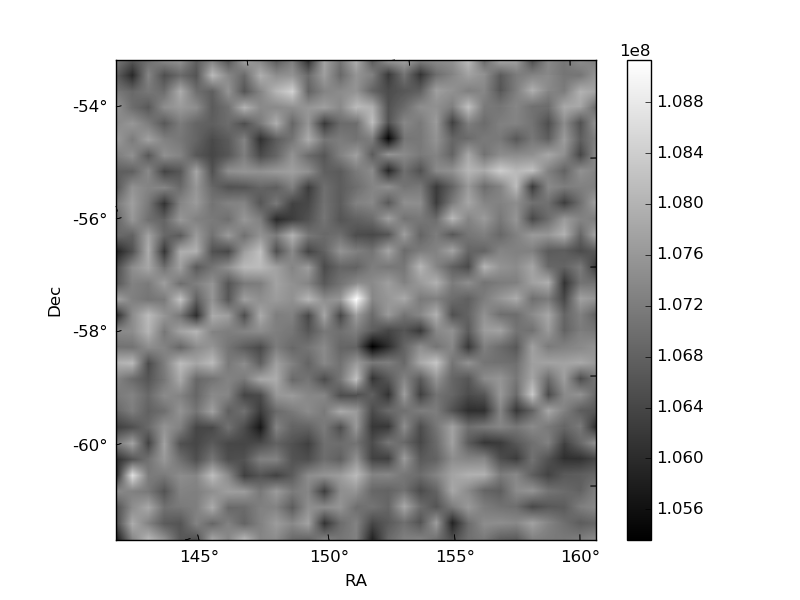
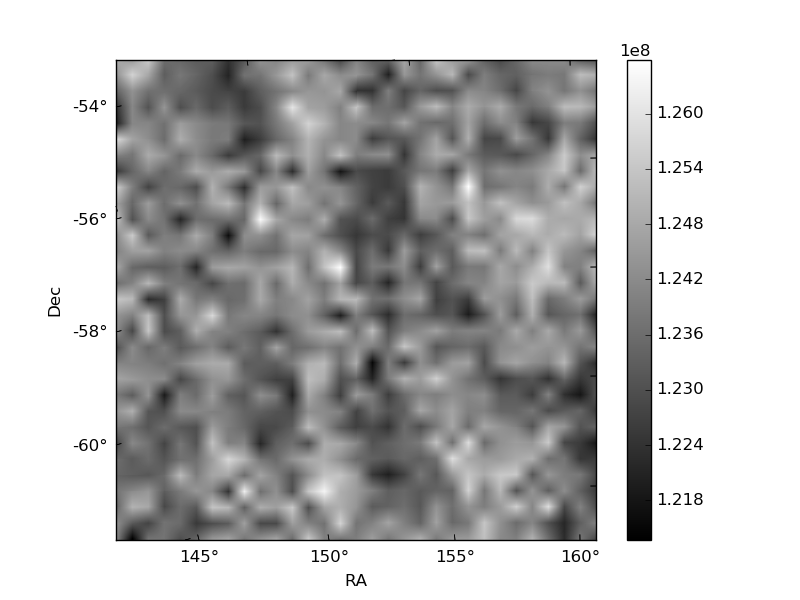
Histogram calculated using DETX and DETY for each event in the final _common_clean file
| Quadrant A | 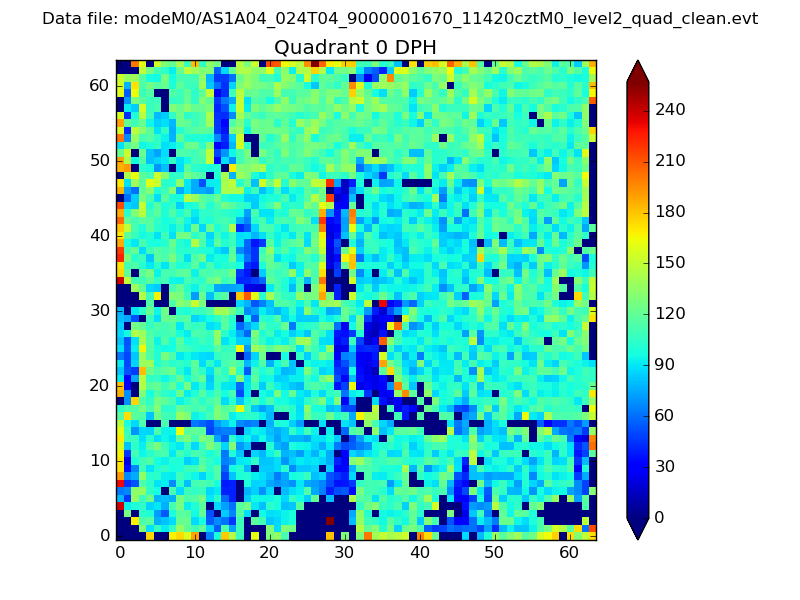 |
 |
Quadrant B |
|---|---|---|---|
| Quadrant D | 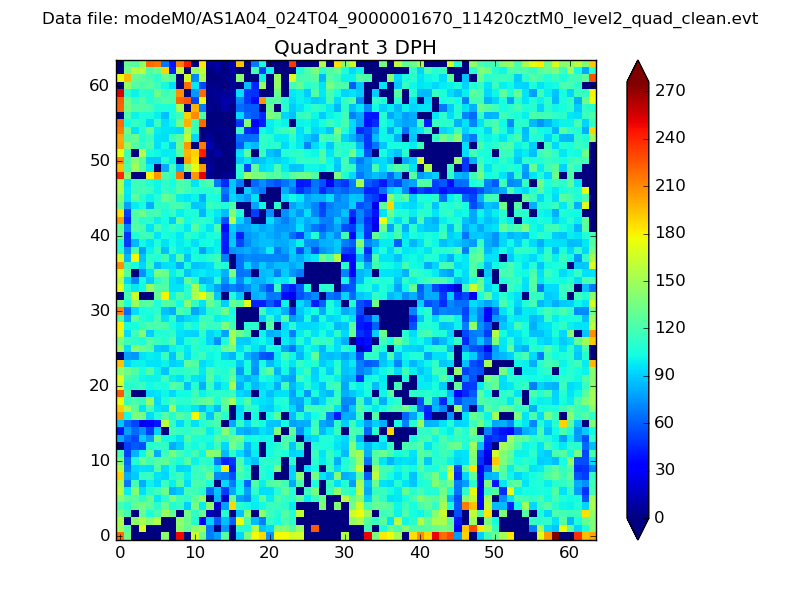 |
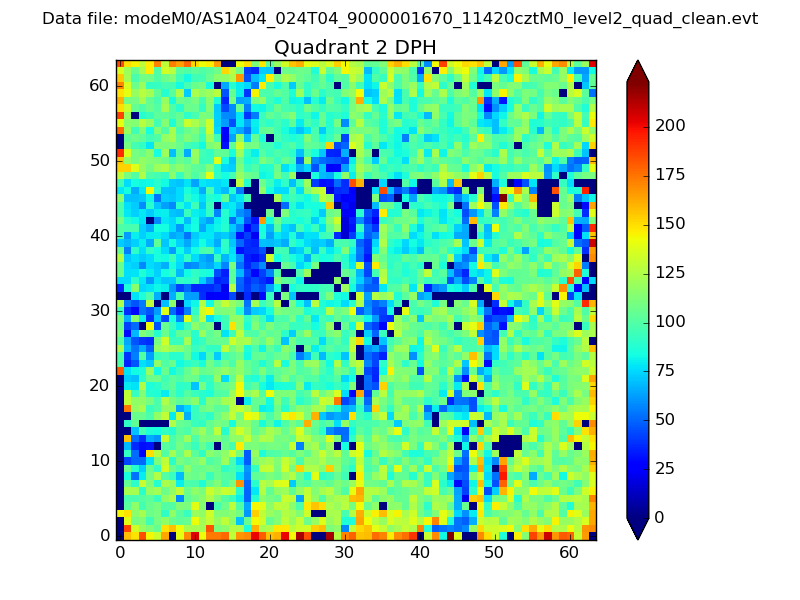 |
Quadrant C |
| Plot type | Count rate plots | Images |
|---|---|---|
| Comparison with Poisson distribution Blue bars denote a histogram of data divided into 1 sec bins. Red curve is a Poisson curve with rate = median count rate of data. |
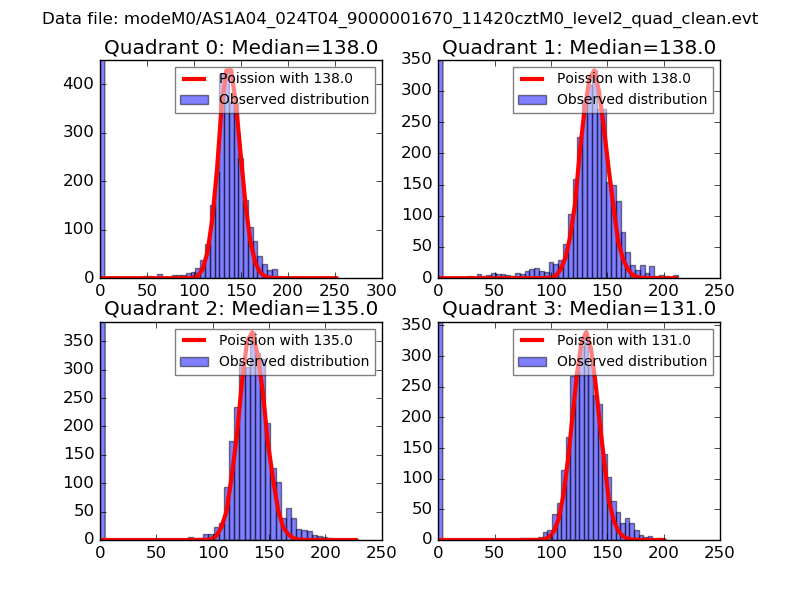 |
 |
| Quadrant-wise count rates Data is divided into 100 sec bins |
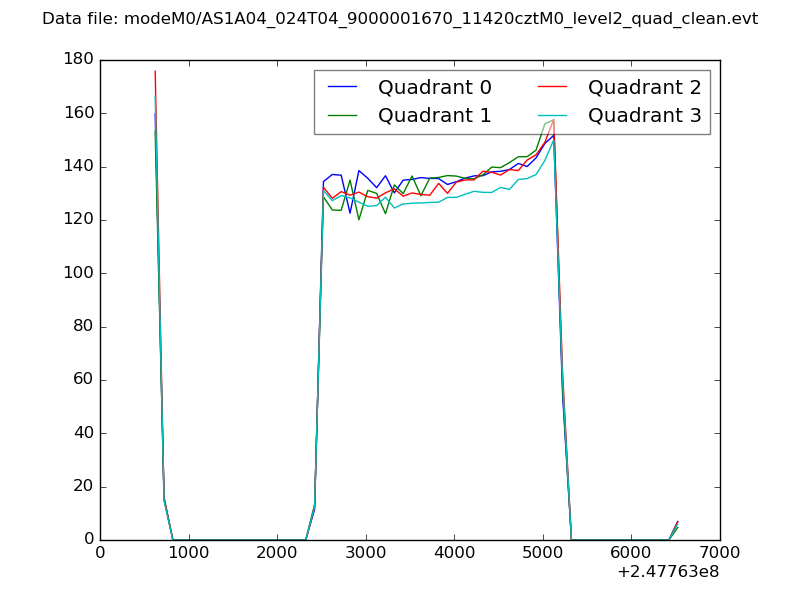 |
|
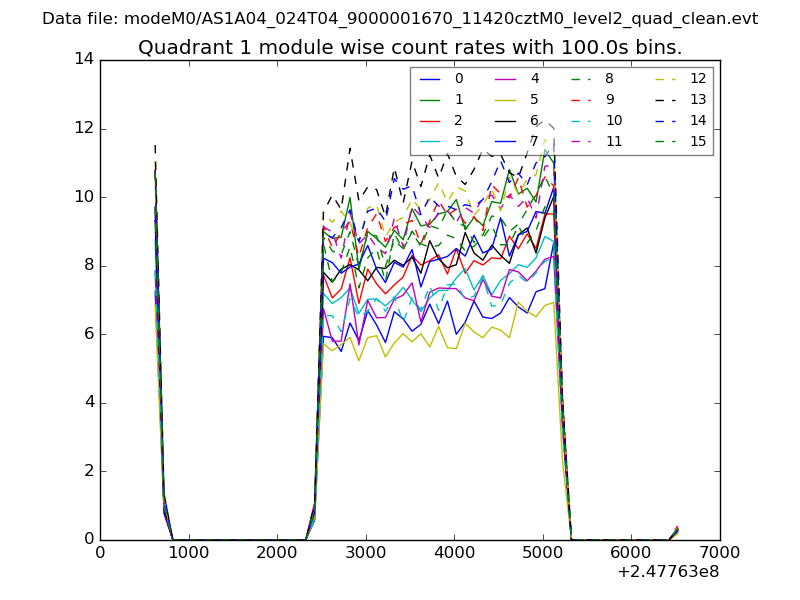
| Module-wise count rates for Quadrant A Data is divided into 100 sec bins |
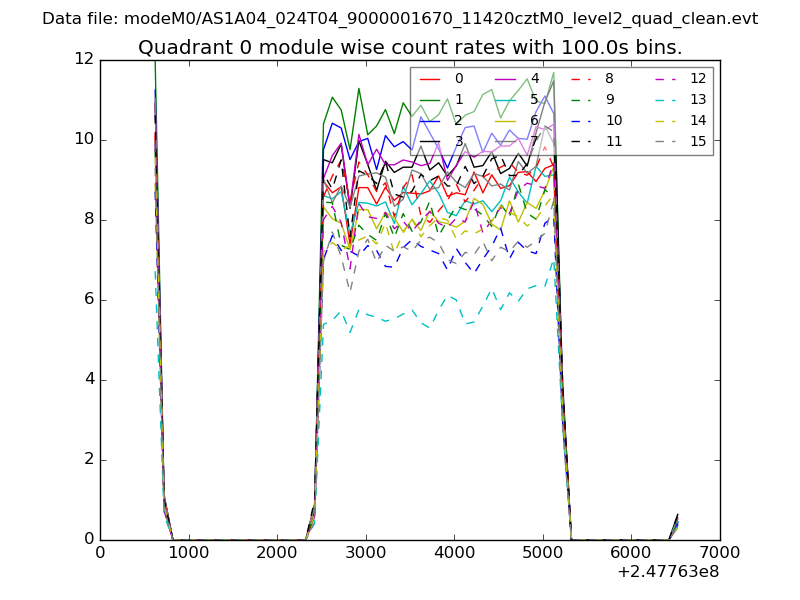 |
 |
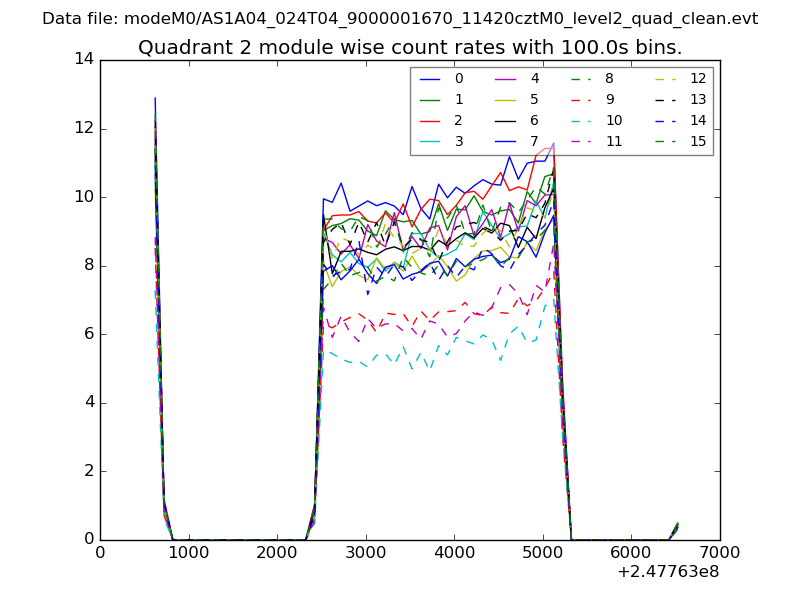
| Module-wise count rates for Quadrant B Data is divided into 100 sec bins |
 |
 |
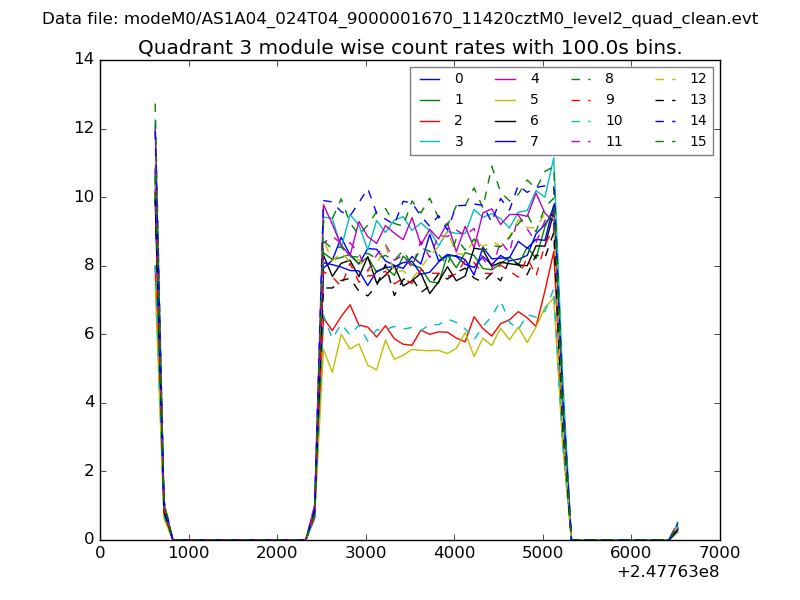
| Module-wise count rates for Quadrant C Data is divided into 100 sec bins |
 |
 |
| Module-wise count rates for Quadrant D Data is divided into 100 sec bins |
 |
 |
| Parameter | Plot |
|---|---|
| CZT HV Monitor |  |
| D_VDD | 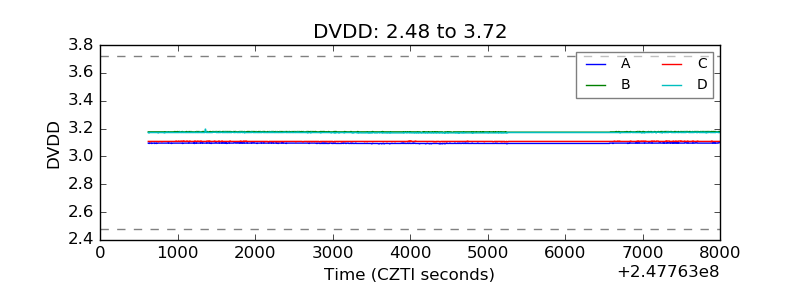 |
| Temperature 1 | 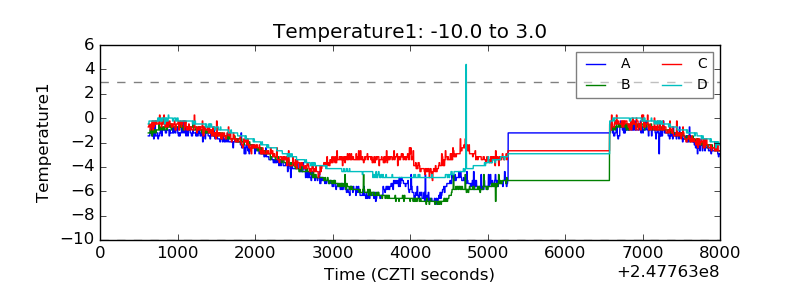 |
| Veto HV Monitor | 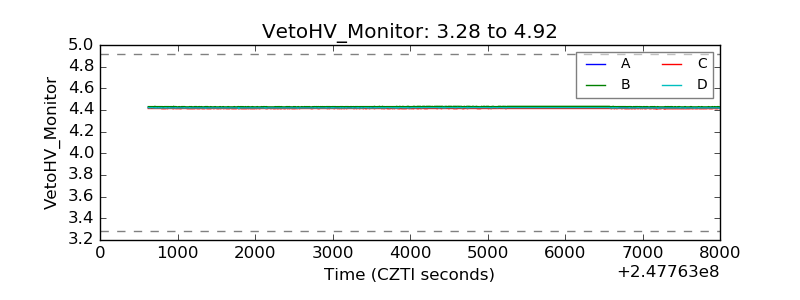 |
| Veto LLD | 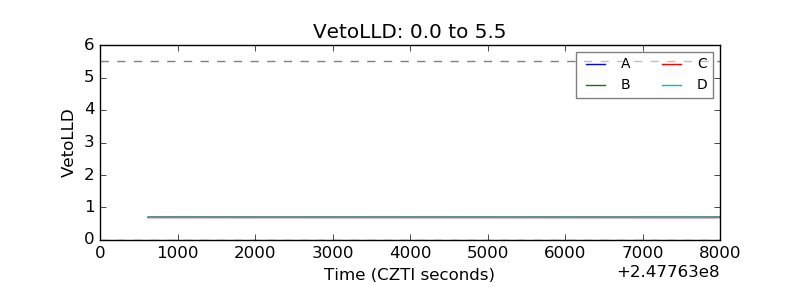 |
| Alpha Counter | 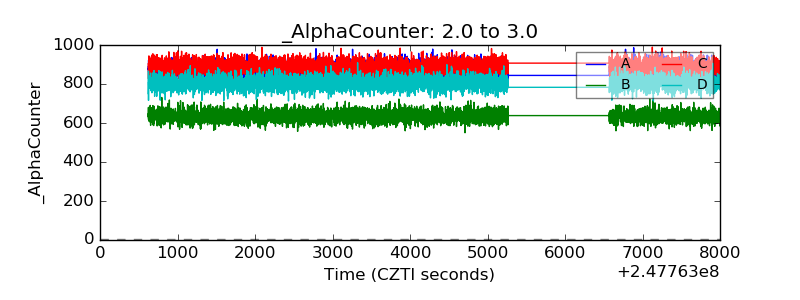 |
| _CPM_Rate | 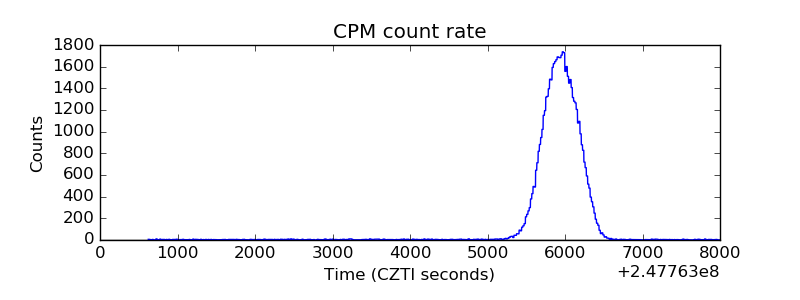 |
| CZT Counter | 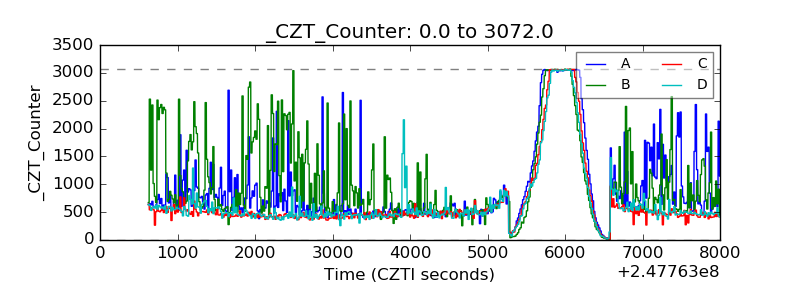 |
| +2.5 Volts monitor |  |
| +5 Volts monitor | 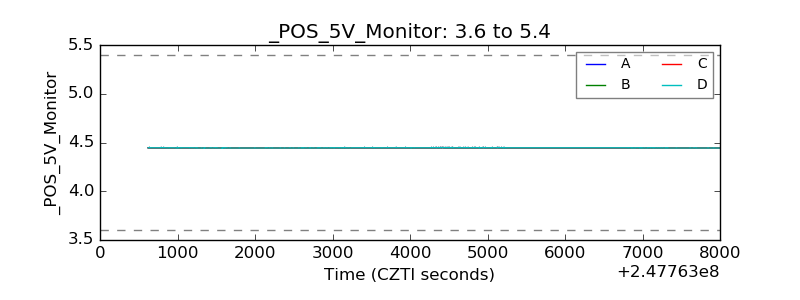 |
| _ROLL_ROT | 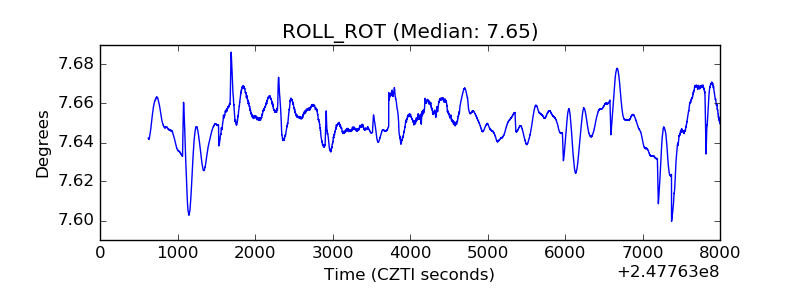 |
| _Roll_DEC | 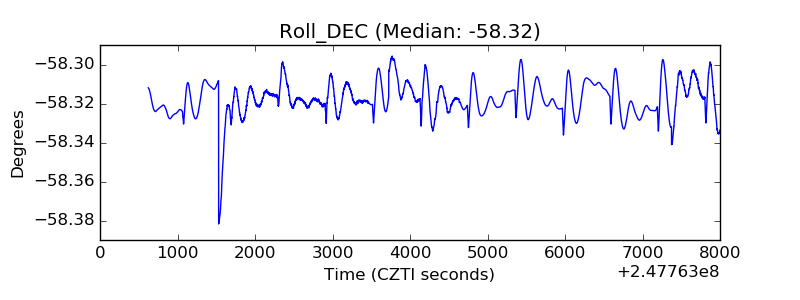 |
| _Roll_RA | 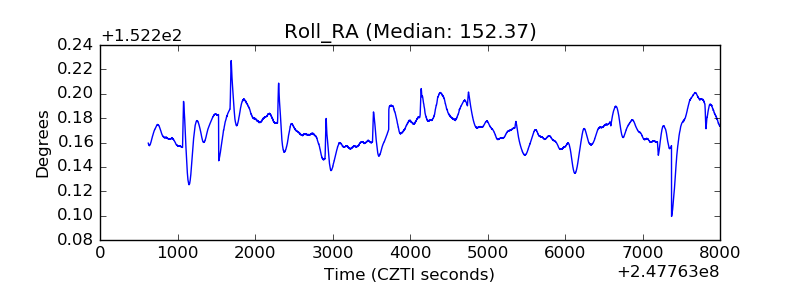 |
| Veto Counter | 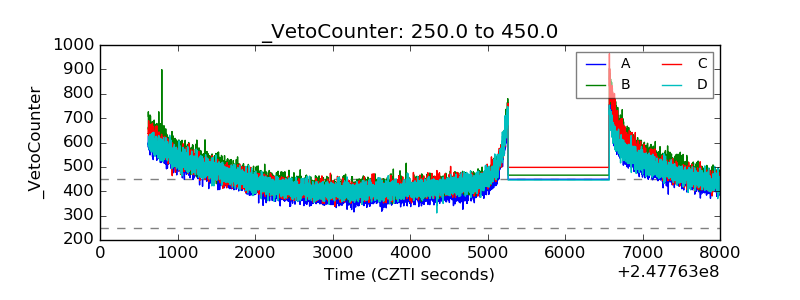 |