| Param | Original file | Final file |
|---|---|---|
| Filename | modeM0/AS1A04_024T04_9000001670_11422cztM0_level2.evt | modeM0/AS1A04_024T04_9000001670_11422cztM0_level2_quad_clean.evt |
| Size (bytes) | 528,249,600 | 85,757,760 |
| Size | 503.8 MB | 81.8 MB |
| Events in quadrant A | 4,173,988 | 549,540 |
| Events in quadrant B | 4,686,598 | 531,301 |
| Events in quadrant C | 3,007,498 | 545,154 |
| Events in quadrant D | 3,687,692 | 516,010 |
| Mode M9 | |||
|---|---|---|---|
| Quadrant | BADHDUFLAG | Total packets | Discarded packets |
| A | 0 | 20 | 0 |
| B | 0 | 20 | 0 |
| C | 0 | 20 | 0 |
| D | 0 | 21 | 0 |
| Mode M0 | |||
|---|---|---|---|
| Quadrant | BADHDUFLAG | Total packets | Discarded packets |
| A | 0 | 16687 | 3 |
| B | 0 | 18213 | 2 |
| C | 0 | 13426 | 2 |
| D | 0 | 15479 | 2 |
| Mode SS | |||
|---|---|---|---|
| Quadrant | BADHDUFLAG | Total packets | Discarded packets |
| A | 0 | 132 | 0 |
| B | 0 | 132 | 0 |
| C | 0 | 132 | 0 |
| D | 0 | 132 | 0 |
| Quadrant | Total seconds | Saturated seconds | Saturation percentage |
|---|---|---|---|
| A | 6522 | 200 | 3.066544% |
| B | 6522 | 478 | 7.329040% |
| C | 6522 | 46 | 0.705305% |
| D | 6522 | 237 | 3.633855% |
Noise dominated data is calculated using 1-second bins in cleaned event files. If a bin has >2000 counts, and if more than 50% of those come from <1% of pixels, then it is considered to be noise-dominated and hence unusable.
| Quadrant | # 1 sec bins | Bins with >0 counts | Bins with >2000 counts | High rate bins dominated by noise | Noise dominated (total time) | Noise dominated (detector-on time) | Marked lightcurve |
|---|---|---|---|---|---|---|---|
| A | 7502 | 6523 | 56 | 56 | 0.75% | 0.86% | 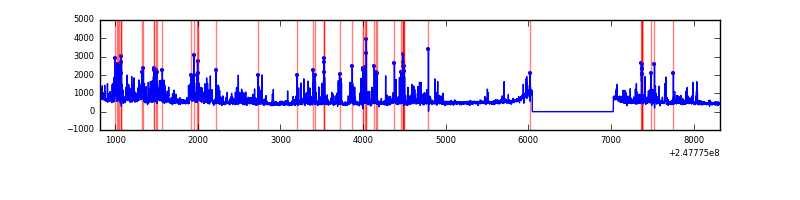 |
| B | 7502 | 6523 | 237 | 237 | 3.16% | 3.63% | 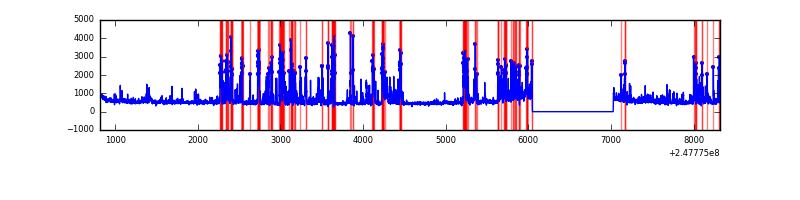 |
| C | 7502 | 6523 | 0 | 0 | 0.00% | 0.00% | 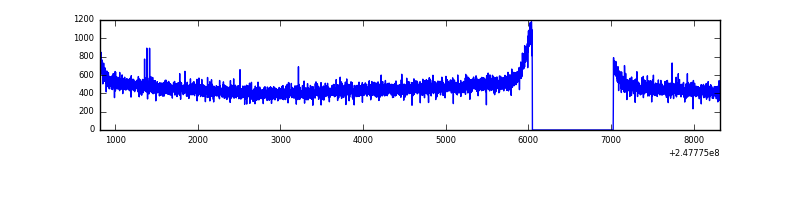 |
| D | 7502 | 6523 | 140 | 140 | 1.87% | 2.15% | 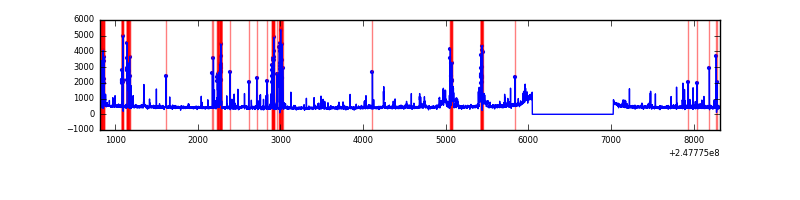 |
Top three noisy pixels from each quadrant. If the there are fewer than three noisy pixels in the level2.evt file, extra rows are filled as -1
| Pixel properties | Quadrant properties | ||||||
|---|---|---|---|---|---|---|---|
| Quadrant | DetID | PixID | Counts | Sigma | Mean | Median | Sigma |
| A | 8 | 5 | 984650 | 6111.18 | 797 | 781 | 161.0 |
| A | 1 | 162 | 31783 | 192.57 | 797 | 781 | 161.0 |
| A | 8 | 6 | 21669 | 129.74 | 797 | 781 | 161.0 |
| B | 4 | 239 | 1208011 | 8231.88 | 783 | 764 | 146.7 |
| B | 3 | 64 | 162456 | 1102.53 | 783 | 764 | 146.7 |
| B | 15 | 204 | 83626 | 565.01 | 783 | 764 | 146.7 |
| C | 13 | 61 | 5715 | 27.89 | 769 | 774 | 177.2 |
| C | 0 | 207 | 3471 | 15.22 | 769 | 774 | 177.2 |
| C | 12 | 4 | 2635 | 10.5 | 769 | 774 | 177.2 |
| D | 10 | 253 | 303207 | 1673.19 | 758 | 736 | 180.8 |
| D | 2 | 33 | 182339 | 1004.58 | 758 | 736 | 180.8 |
| D | 13 | 152 | 114814 | 631.05 | 758 | 736 | 180.8 |
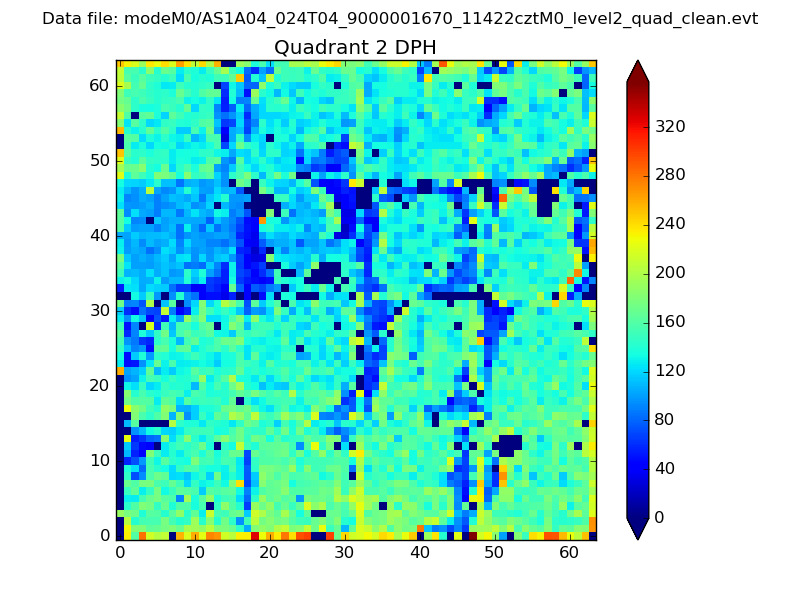
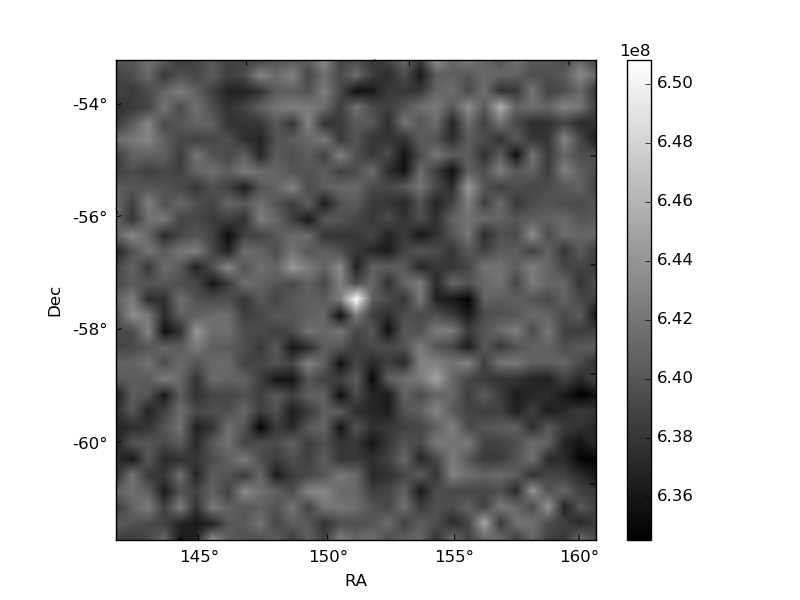
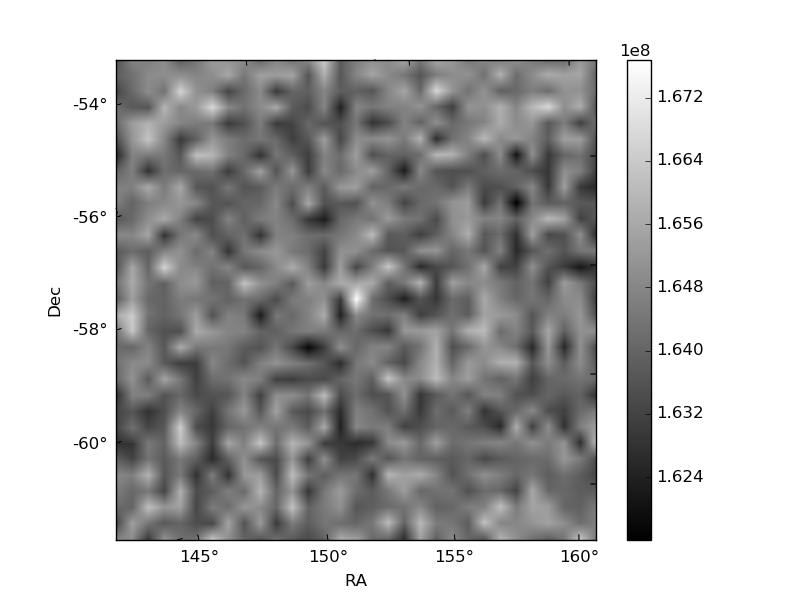
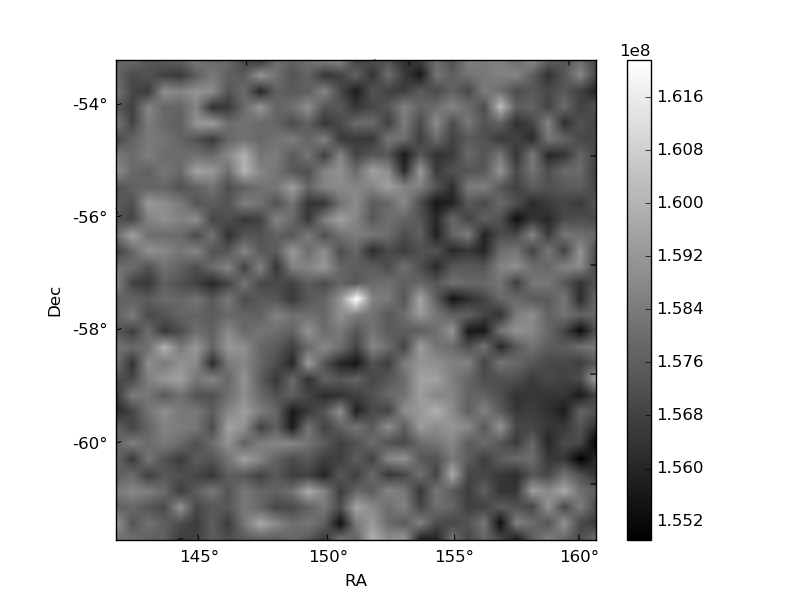
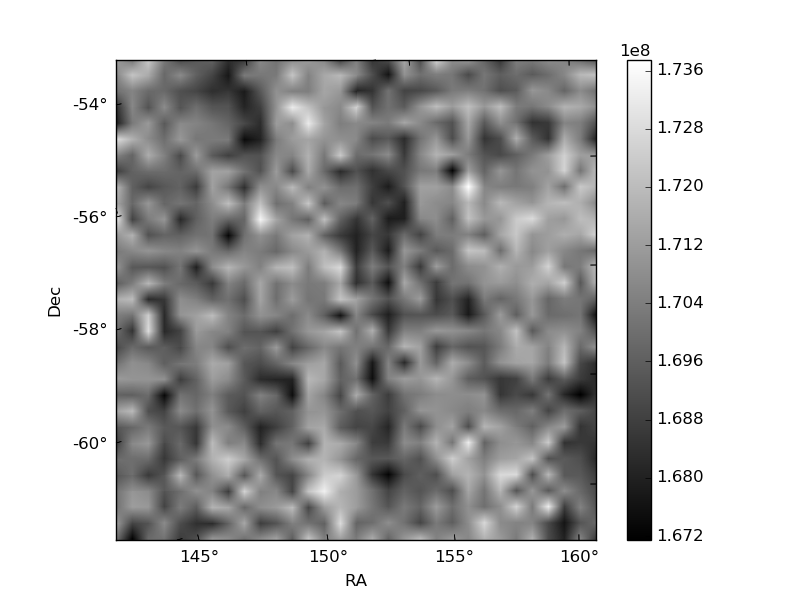
Histogram calculated using DETX and DETY for each event in the final _common_clean file
| Quadrant A | 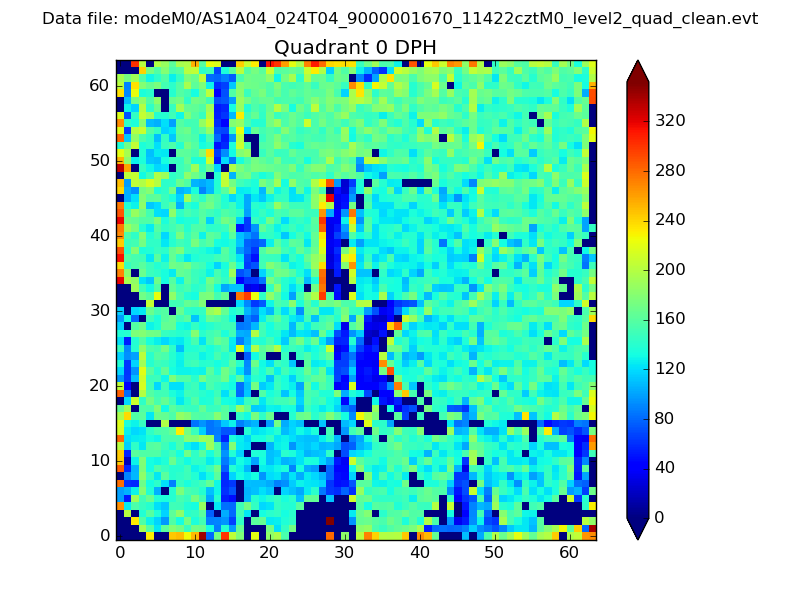 |
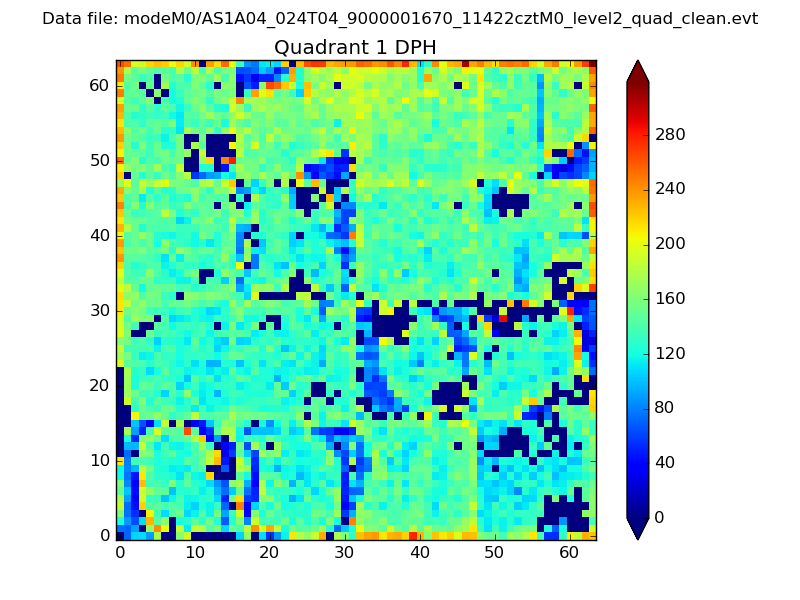 |
Quadrant B |
|---|---|---|---|
| Quadrant D | 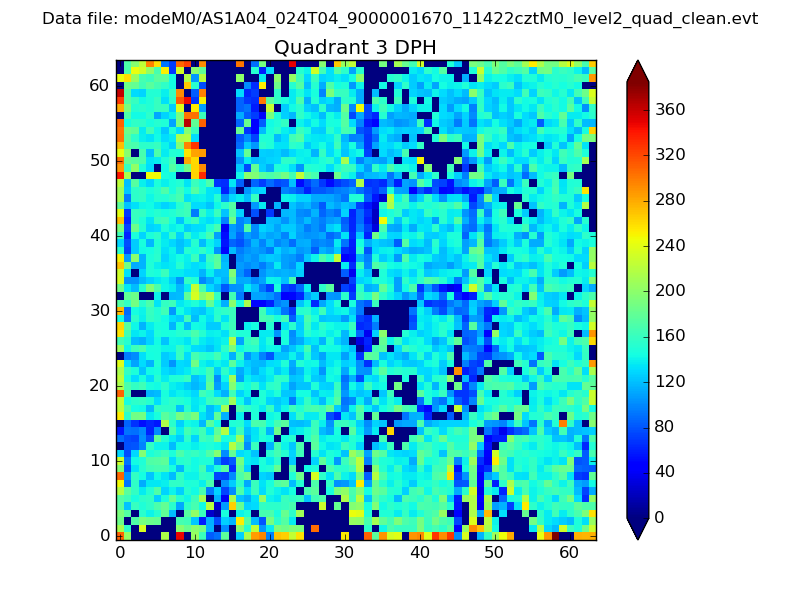 |
 |
Quadrant C |
| Plot type | Count rate plots | Images |
|---|---|---|
| Comparison with Poisson distribution Blue bars denote a histogram of data divided into 1 sec bins. Red curve is a Poisson curve with rate = median count rate of data. |
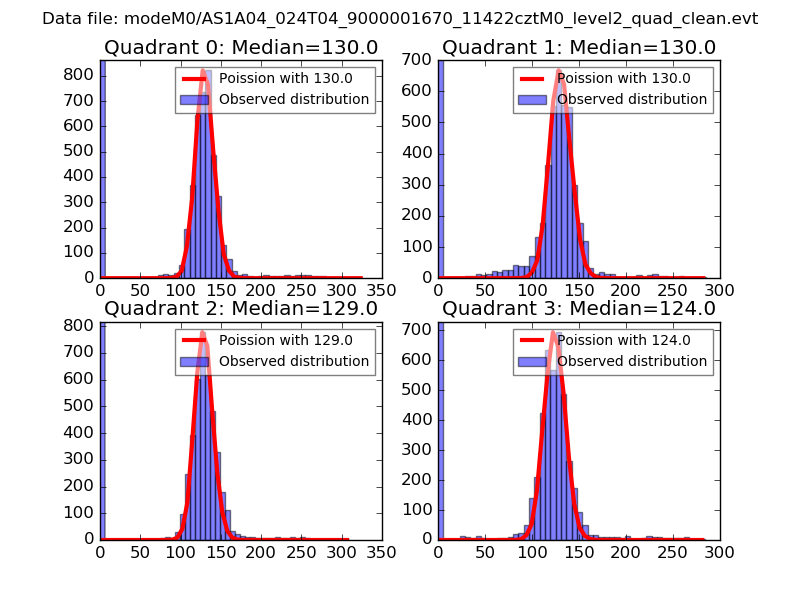 |
 |
| Quadrant-wise count rates Data is divided into 100 sec bins |
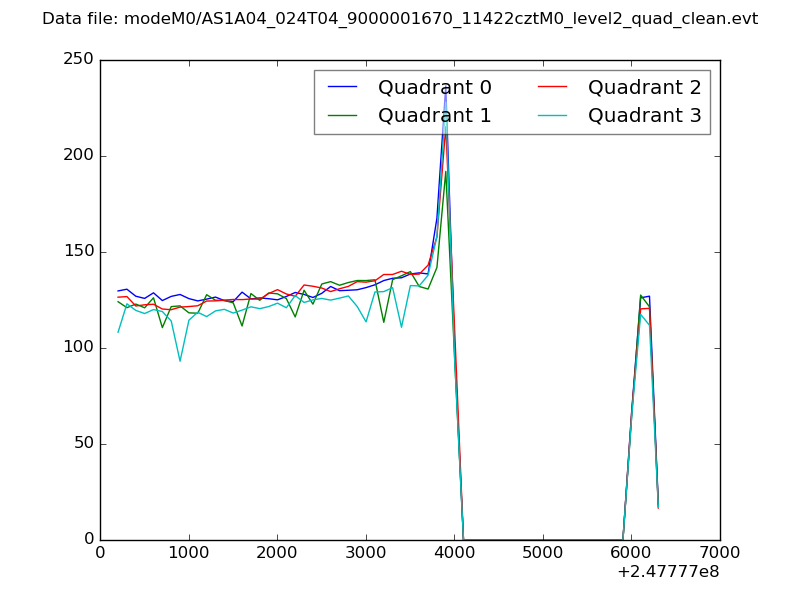 |
|
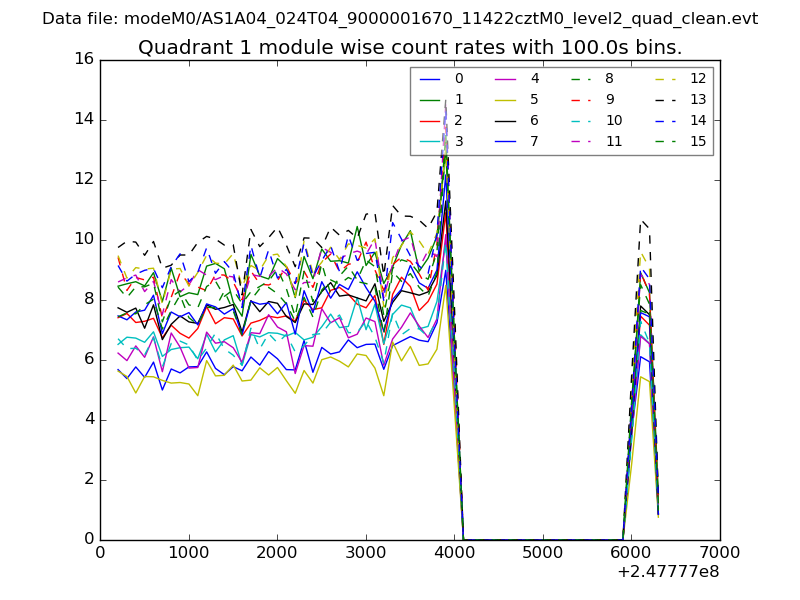
| Module-wise count rates for Quadrant A Data is divided into 100 sec bins |
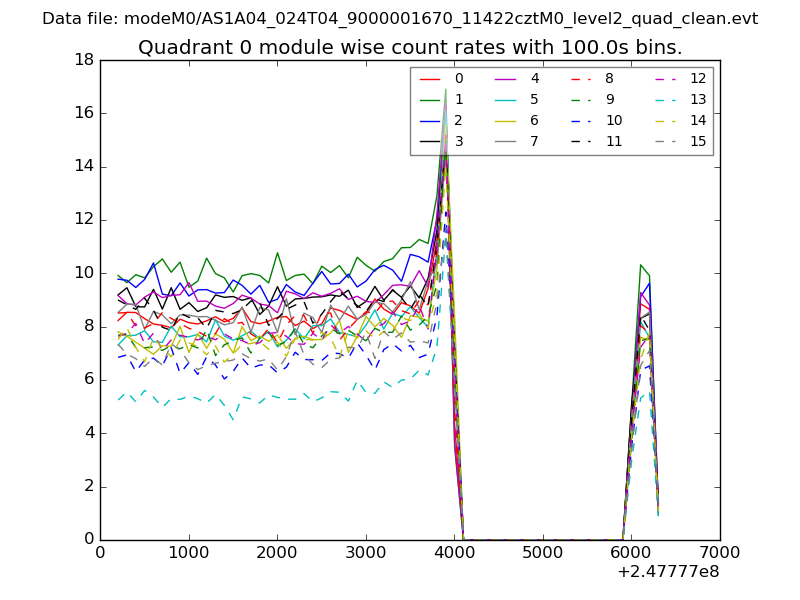 |
 |
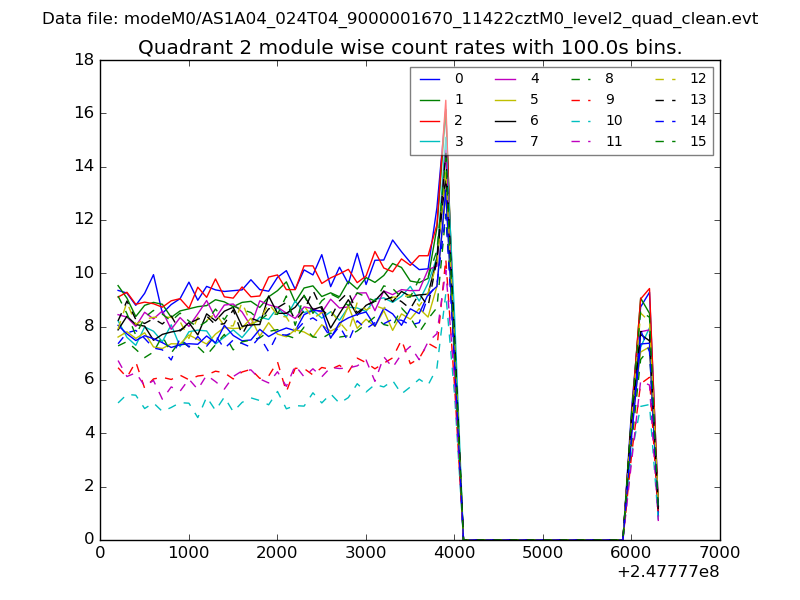
| Module-wise count rates for Quadrant B Data is divided into 100 sec bins |
 |
 |
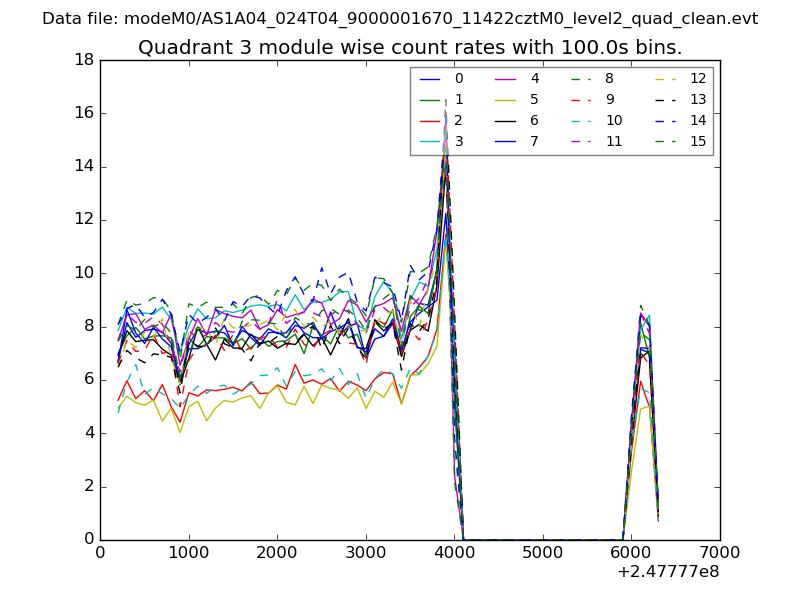
| Module-wise count rates for Quadrant C Data is divided into 100 sec bins |
 |
 |
| Module-wise count rates for Quadrant D Data is divided into 100 sec bins |
 |
 |
| Parameter | Plot |
|---|---|
| CZT HV Monitor | 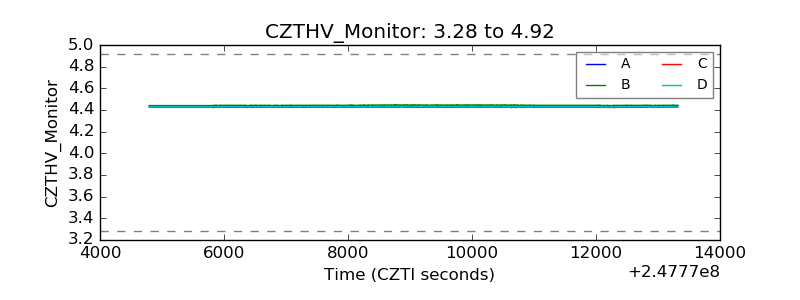 |
| D_VDD | 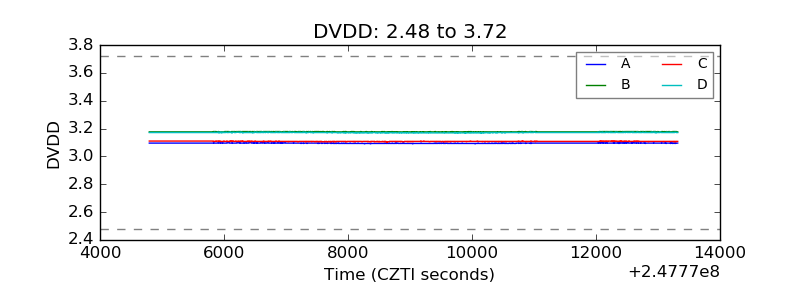 |
| Temperature 1 | 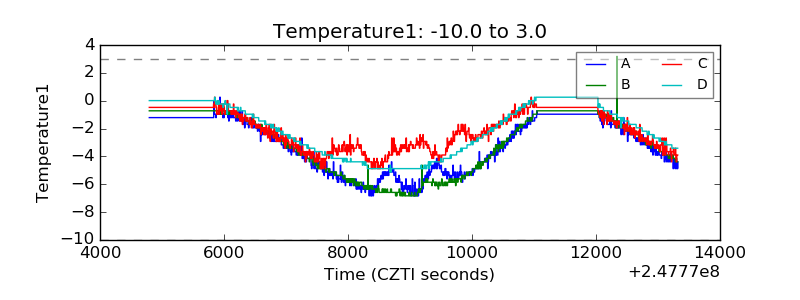 |
| Veto HV Monitor | 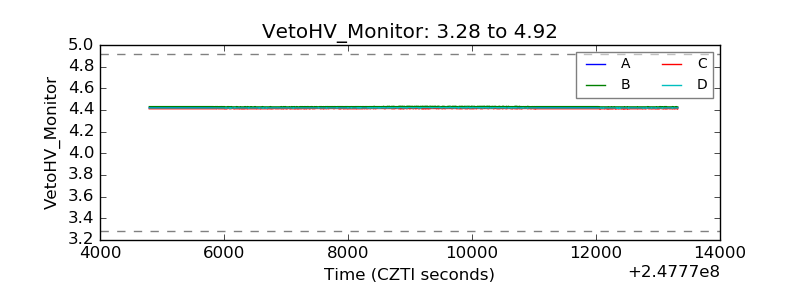 |
| Veto LLD | 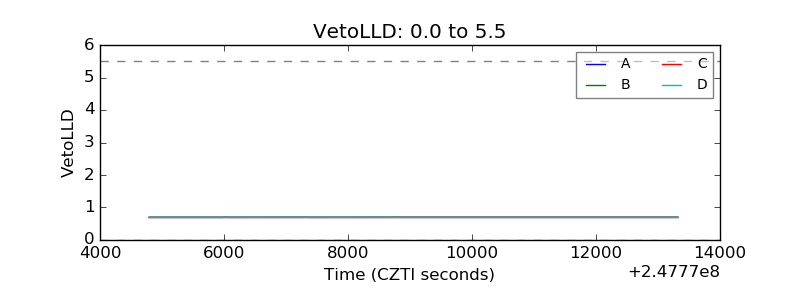 |
| Alpha Counter | 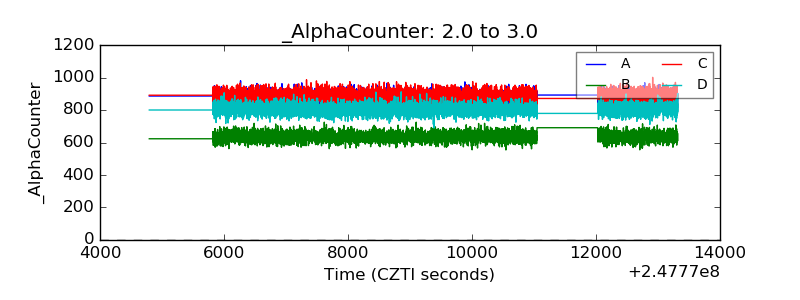 |
| _CPM_Rate | 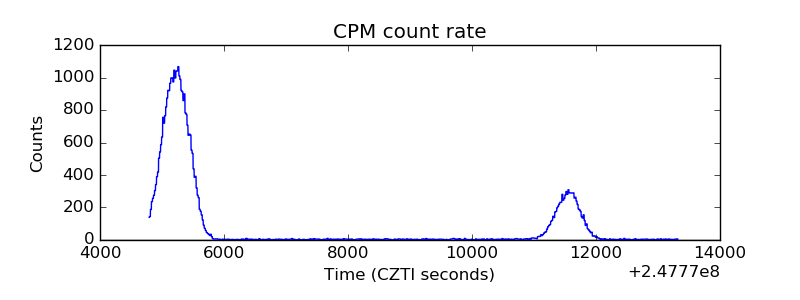 |
| CZT Counter | 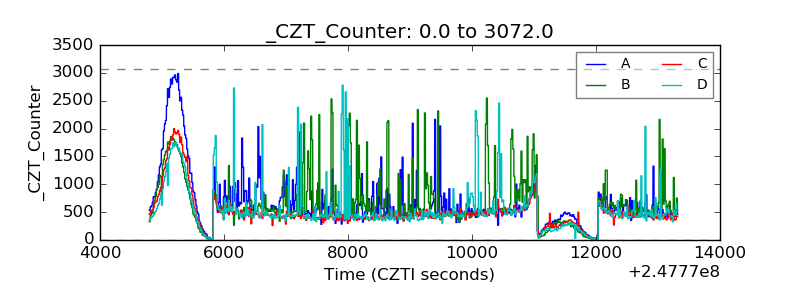 |
| +2.5 Volts monitor | 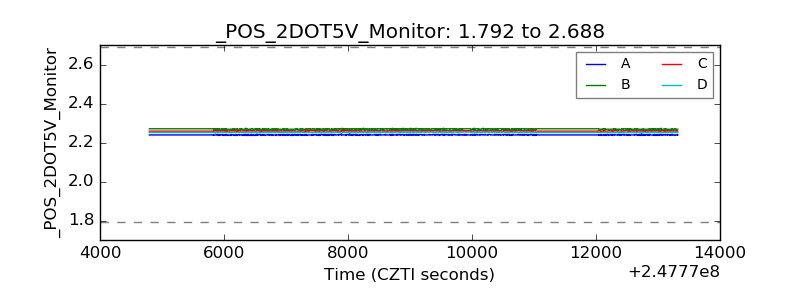 |
| +5 Volts monitor |  |
| _ROLL_ROT | 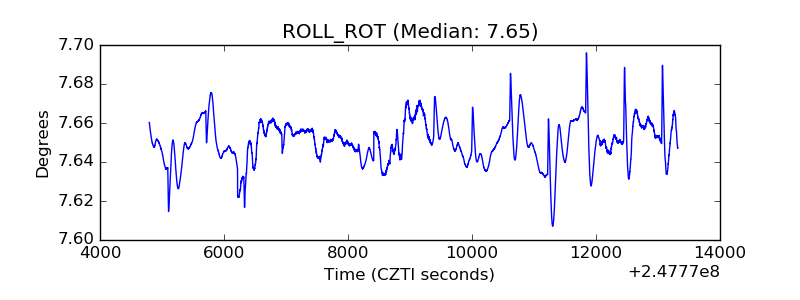 |
| _Roll_DEC | 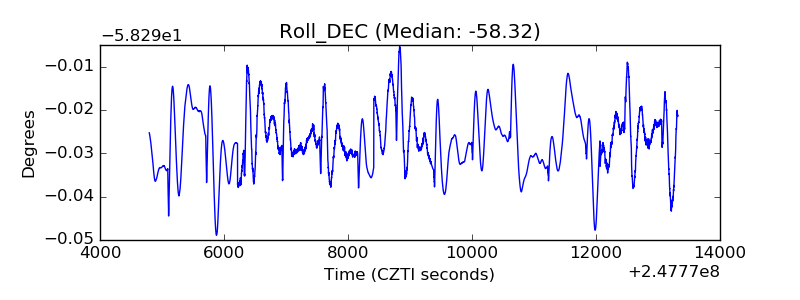 |
| _Roll_RA | 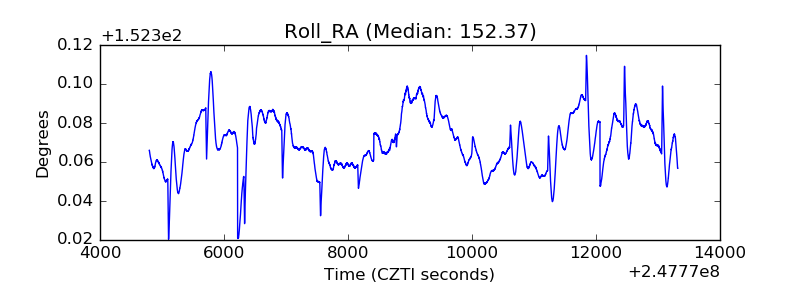 |
| Veto Counter | 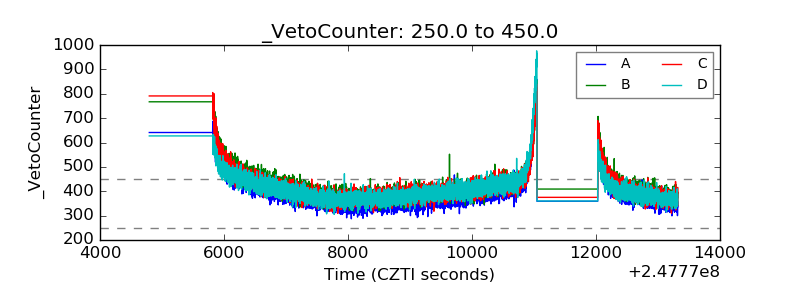 |