| Param | Original file | Final file |
|---|---|---|
| Filename | modeM0/AS1A04_024T04_9000001670_11423cztM0_level2.evt | modeM0/AS1A04_024T04_9000001670_11423cztM0_level2_quad_clean.evt |
| Size (bytes) | 598,060,800 | 93,369,600 |
| Size | 570.4 MB | 89.0 MB |
| Events in quadrant A | 4,961,107 | 590,401 |
| Events in quadrant B | 5,735,860 | 577,843 |
| Events in quadrant C | 3,159,623 | 597,668 |
| Events in quadrant D | 3,779,149 | 571,748 |
| Mode M9 | |||
|---|---|---|---|
| Quadrant | BADHDUFLAG | Total packets | Discarded packets |
| A | 0 | 11 | 0 |
| B | 0 | 11 | 0 |
| C | 0 | 11 | 0 |
| D | 0 | 12 | 0 |
| Mode M0 | |||
|---|---|---|---|
| Quadrant | BADHDUFLAG | Total packets | Discarded packets |
| A | 0 | 19596 | 3 |
| B | 0 | 21863 | 2 |
| C | 0 | 14328 | 2 |
| D | 0 | 16141 | 2 |
| Mode SS | |||
|---|---|---|---|
| Quadrant | BADHDUFLAG | Total packets | Discarded packets |
| A | 0 | 142 | 0 |
| B | 0 | 142 | 0 |
| C | 0 | 142 | 0 |
| D | 0 | 142 | 0 |
| Quadrant | Total seconds | Saturated seconds | Saturation percentage |
|---|---|---|---|
| A | 7030 | 499 | 7.098151% |
| B | 7030 | 878 | 12.489331% |
| C | 7030 | 11 | 0.156472% |
| D | 7030 | 97 | 1.379801% |
Noise dominated data is calculated using 1-second bins in cleaned event files. If a bin has >2000 counts, and if more than 50% of those come from <1% of pixels, then it is considered to be noise-dominated and hence unusable.
| Quadrant | # 1 sec bins | Bins with >0 counts | Bins with >2000 counts | High rate bins dominated by noise | Noise dominated (total time) | Noise dominated (detector-on time) | Marked lightcurve |
|---|---|---|---|---|---|---|---|
| A | 7615 | 7031 | 245 | 245 | 3.22% | 3.48% | 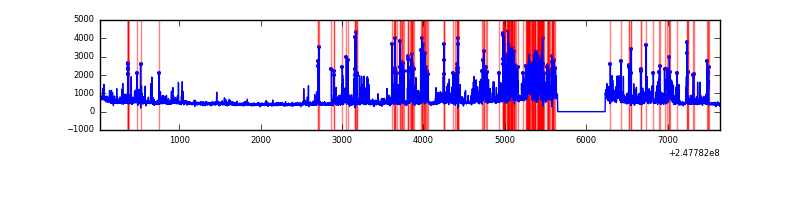 |
| B | 7615 | 7031 | 456 | 456 | 5.99% | 6.49% | 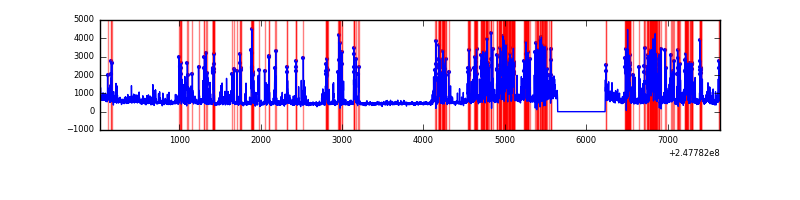 |
| C | 7615 | 7031 | 0 | 0 | 0.00% | 0.00% | 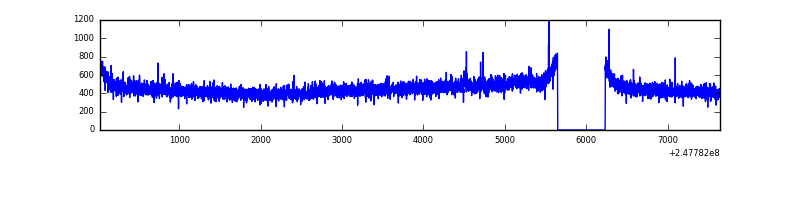 |
| D | 7615 | 7031 | 67 | 67 | 0.88% | 0.95% | 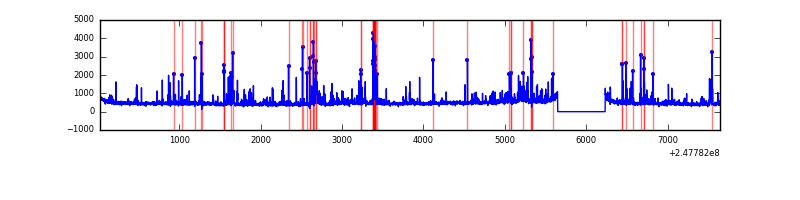 |
Top three noisy pixels from each quadrant. If the there are fewer than three noisy pixels in the level2.evt file, extra rows are filled as -1
| Pixel properties | Quadrant properties | ||||||
|---|---|---|---|---|---|---|---|
| Quadrant | DetID | PixID | Counts | Sigma | Mean | Median | Sigma |
| A | 8 | 5 | 1667656 | 9956.78 | 820 | 803 | 167.4 |
| A | 1 | 162 | 28430 | 165.03 | 820 | 803 | 167.4 |
| A | 9 | 143 | 24533 | 141.75 | 820 | 803 | 167.4 |
| B | 4 | 239 | 1552409 | 10225.26 | 800 | 782 | 151.7 |
| B | 3 | 64 | 655334 | 4313.51 | 800 | 782 | 151.7 |
| B | 11 | 51 | 126396 | 827.8 | 800 | 782 | 151.7 |
| C | 12 | 4 | 7320 | 35.13 | 807 | 811 | 185.3 |
| C | 13 | 61 | 5938 | 27.67 | 807 | 811 | 185.3 |
| C | 0 | 207 | 5035 | 22.8 | 807 | 811 | 185.3 |
| D | 13 | 104 | 202557 | 1039.3 | 803 | 781 | 194.1 |
| D | 2 | 33 | 155321 | 796.0 | 803 | 781 | 194.1 |
| D | 2 | 120 | 97088 | 496.05 | 803 | 781 | 194.1 |
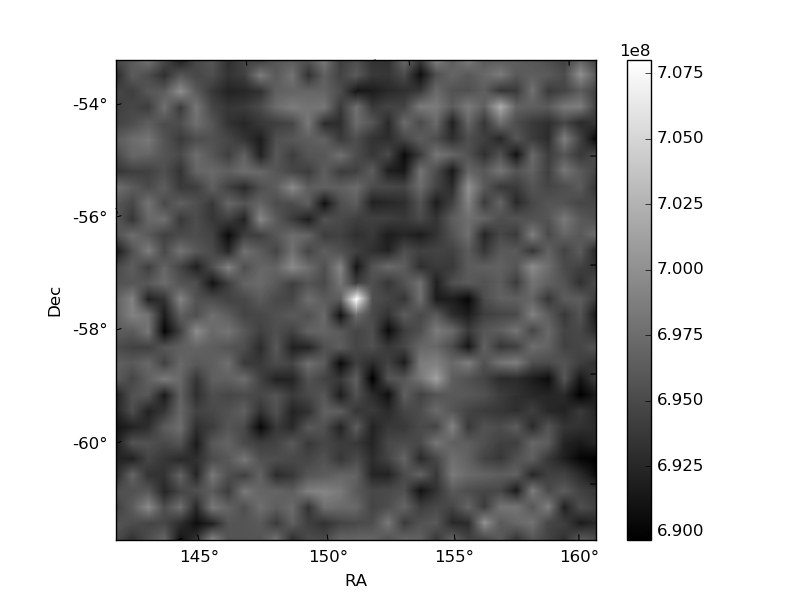
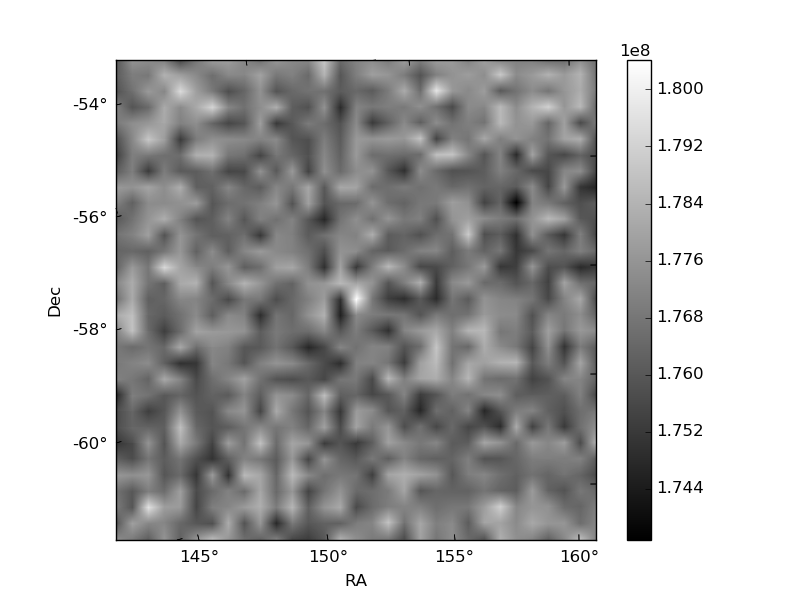
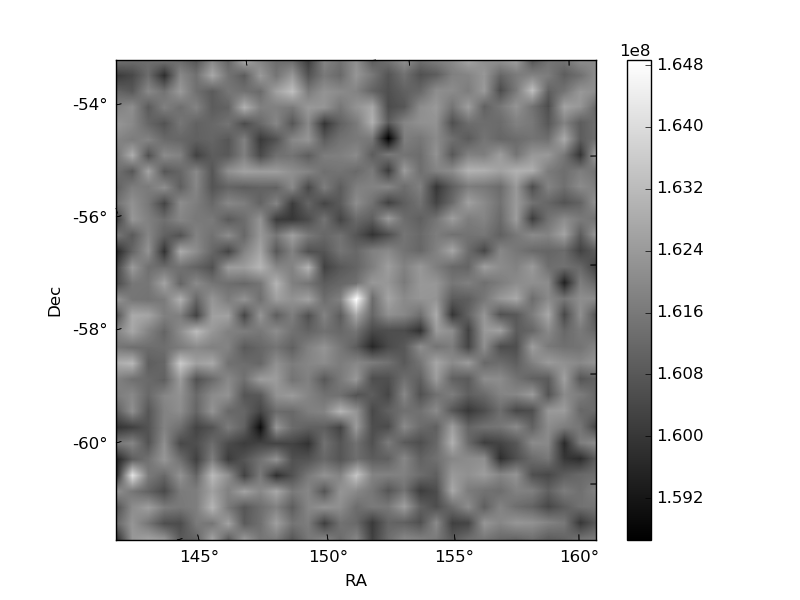
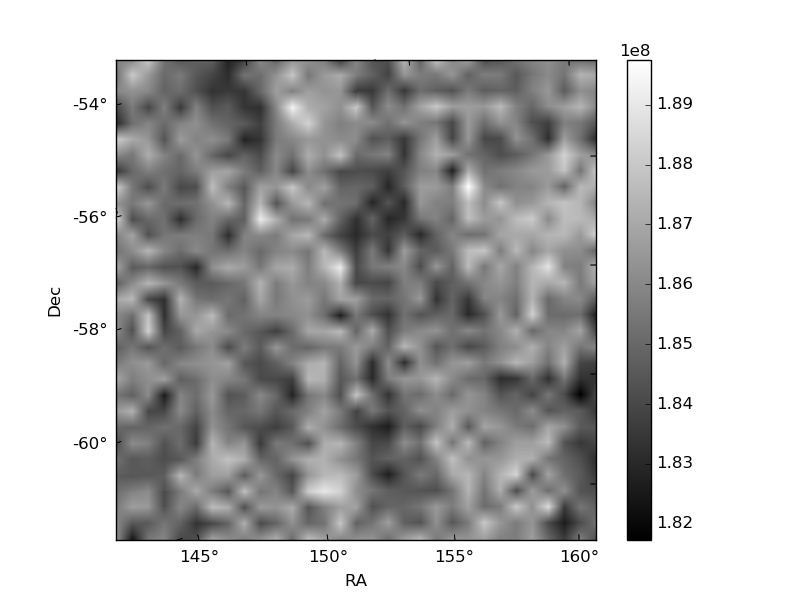
Histogram calculated using DETX and DETY for each event in the final _common_clean file
| Quadrant A | 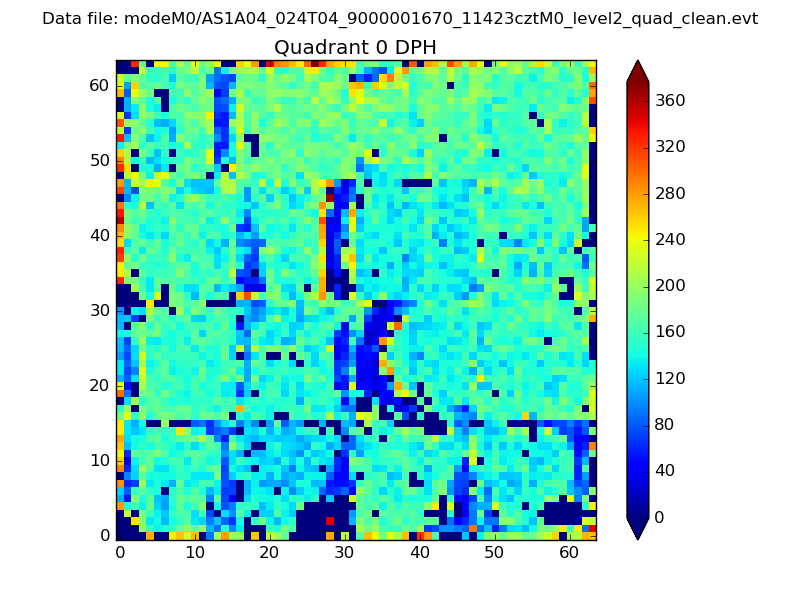 |
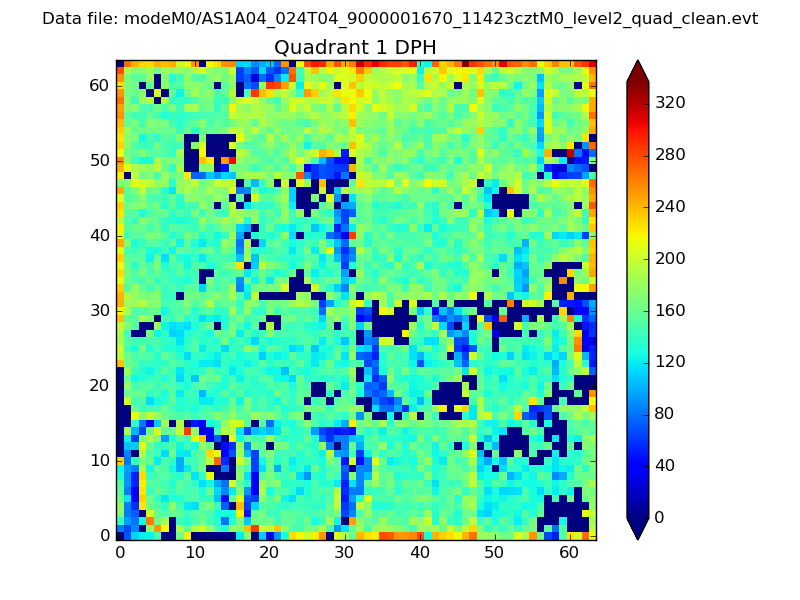 |
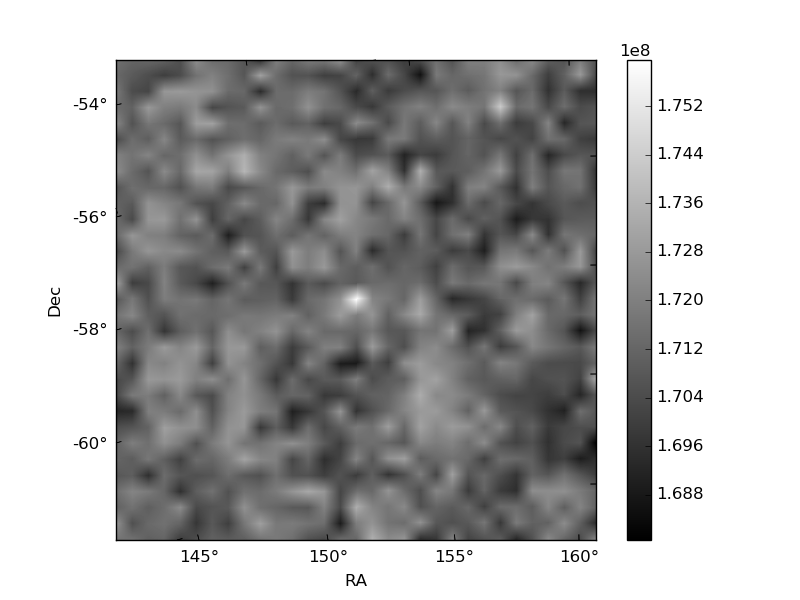
Quadrant B |
|---|---|---|---|
| Quadrant D | 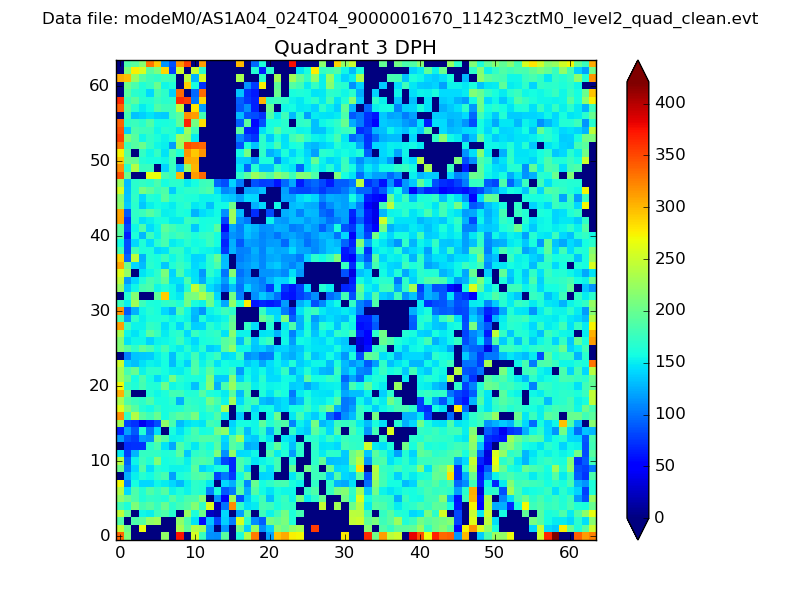 |
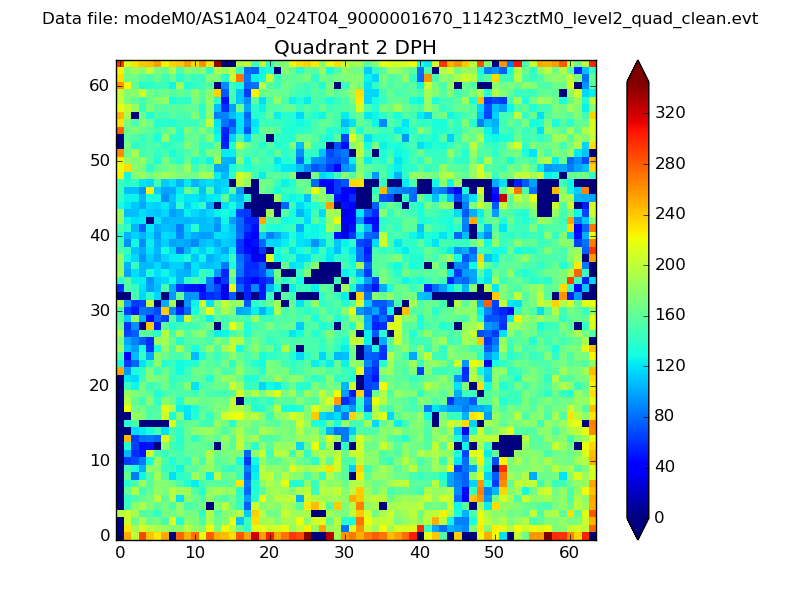 |
Quadrant C |
| Plot type | Count rate plots | Images |
|---|---|---|
| Comparison with Poisson distribution Blue bars denote a histogram of data divided into 1 sec bins. Red curve is a Poisson curve with rate = median count rate of data. |
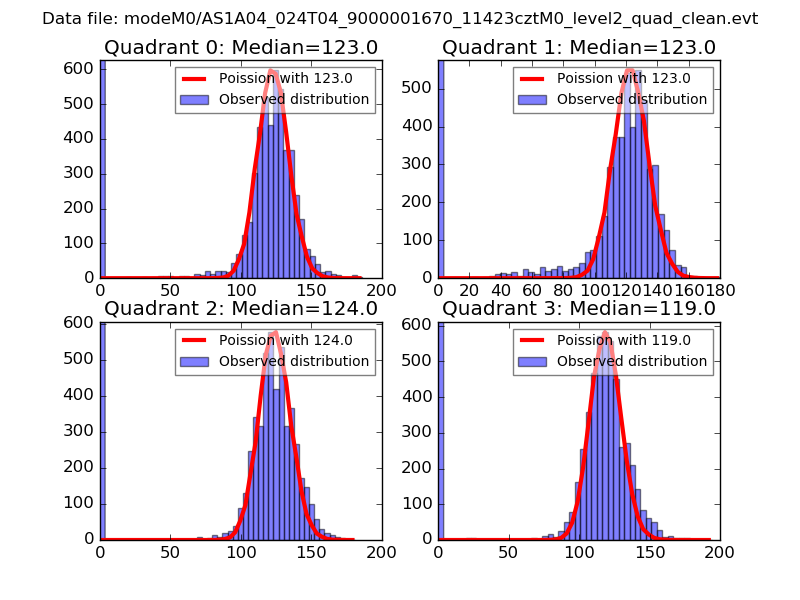 |
 |
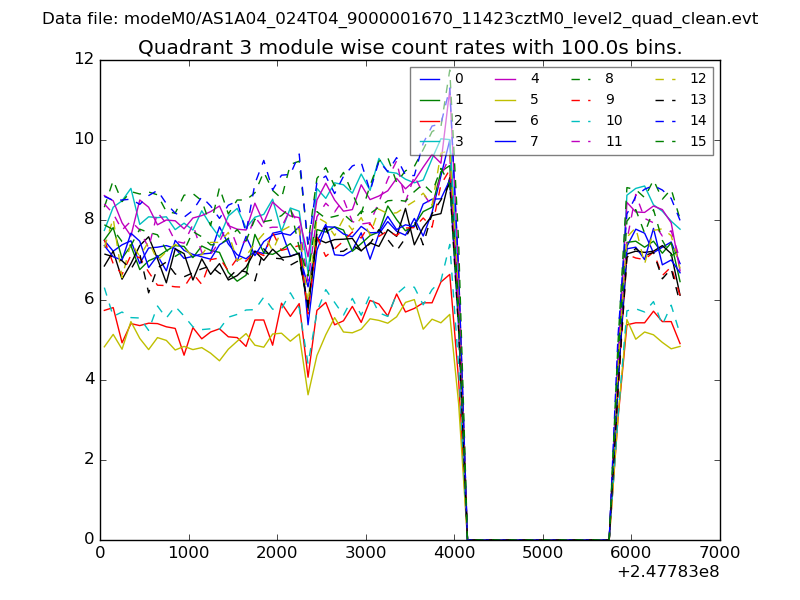
| Quadrant-wise count rates Data is divided into 100 sec bins |
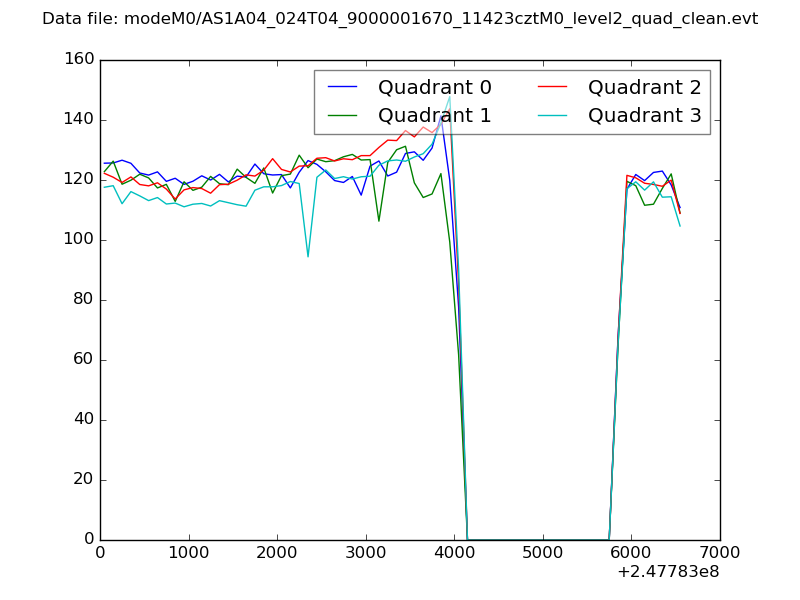 |
|
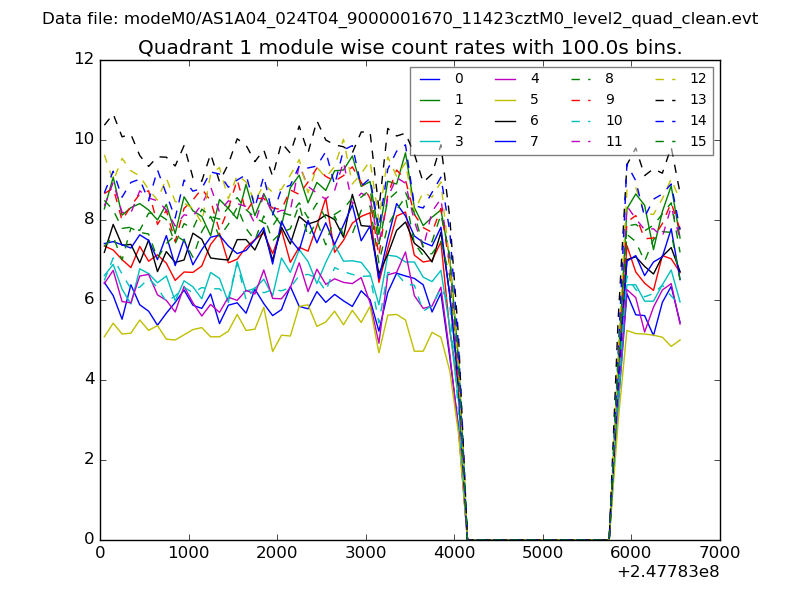
| Module-wise count rates for Quadrant A Data is divided into 100 sec bins |
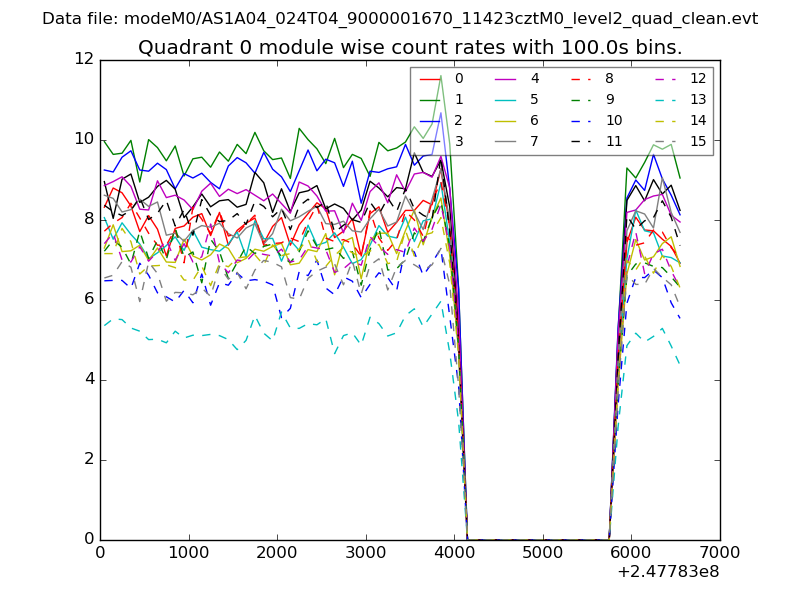 |
 |
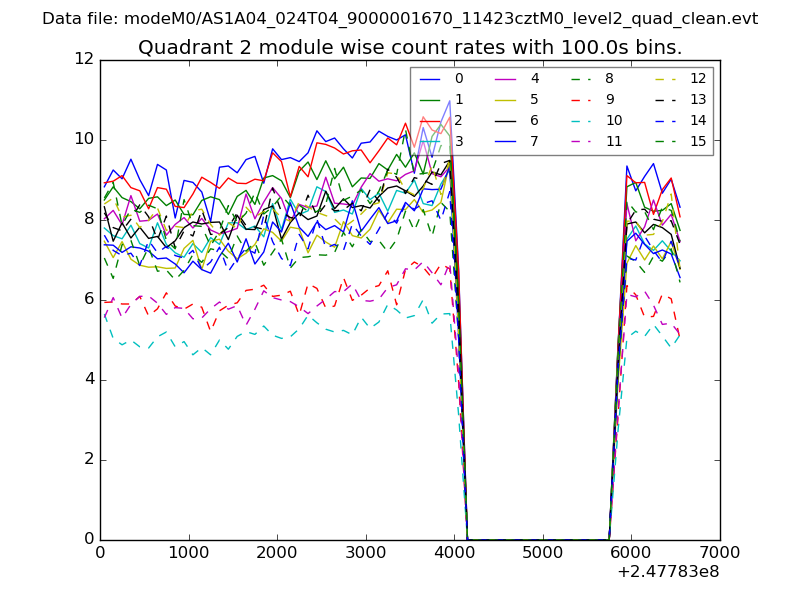
| Module-wise count rates for Quadrant B Data is divided into 100 sec bins |
 |
 |
| Module-wise count rates for Quadrant C Data is divided into 100 sec bins |
 |
 |
| Module-wise count rates for Quadrant D Data is divided into 100 sec bins |
 |
 |
| Parameter | Plot |
|---|---|
| CZT HV Monitor | 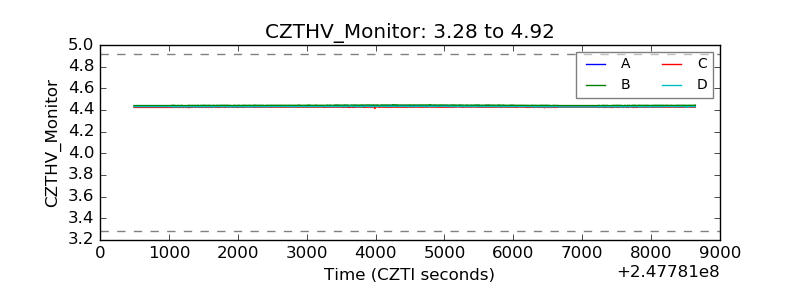 |
| D_VDD | 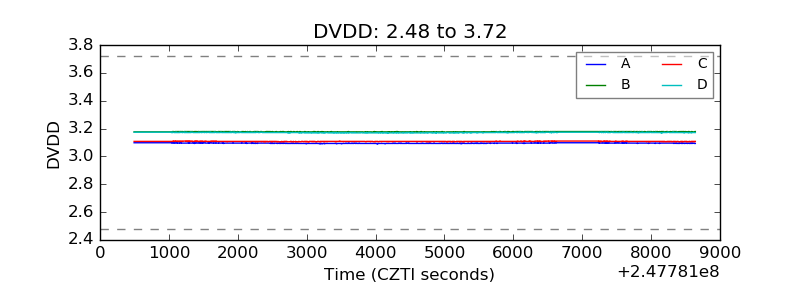 |
| Temperature 1 |  |
| Veto HV Monitor | 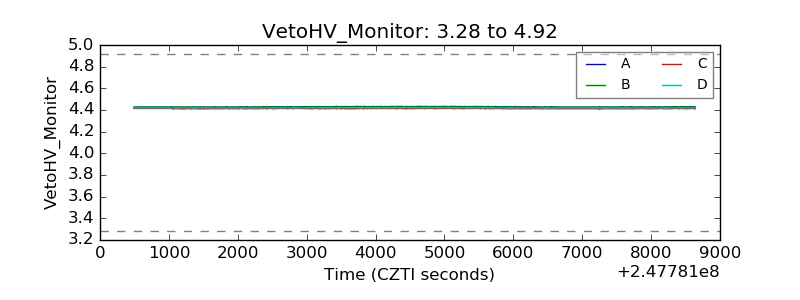 |
| Veto LLD |  |
| Alpha Counter | 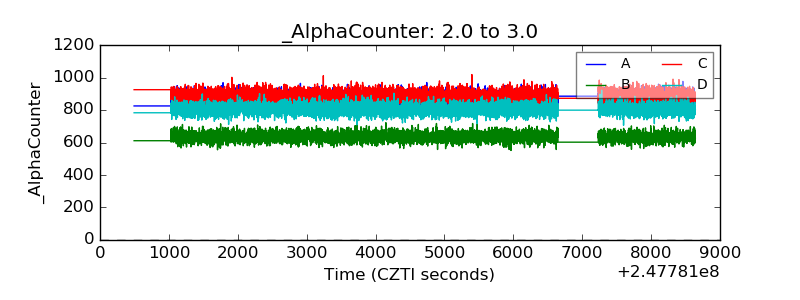 |
| _CPM_Rate | 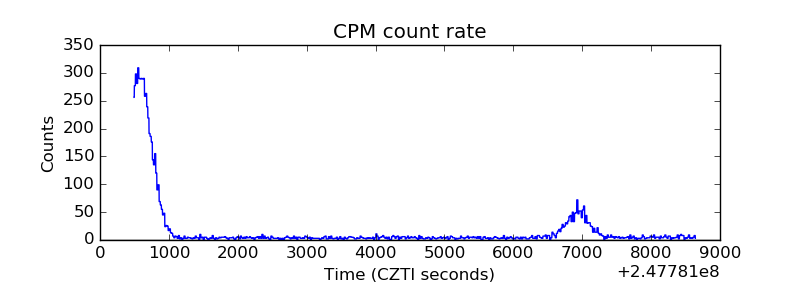 |
| CZT Counter | 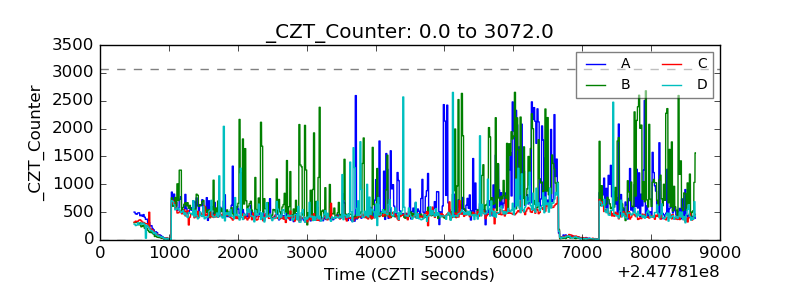 |
| +2.5 Volts monitor |  |
| +5 Volts monitor |  |
| _ROLL_ROT | 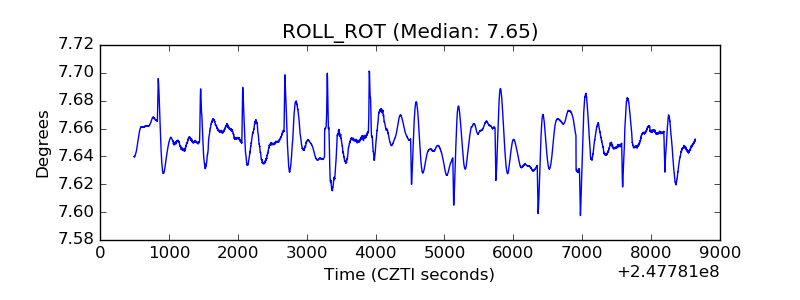 |
| _Roll_DEC | 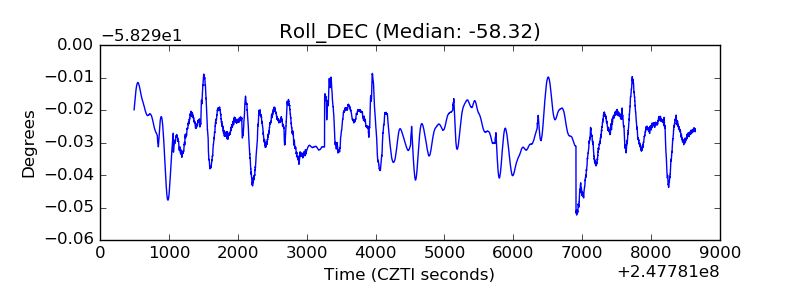 |
| _Roll_RA | 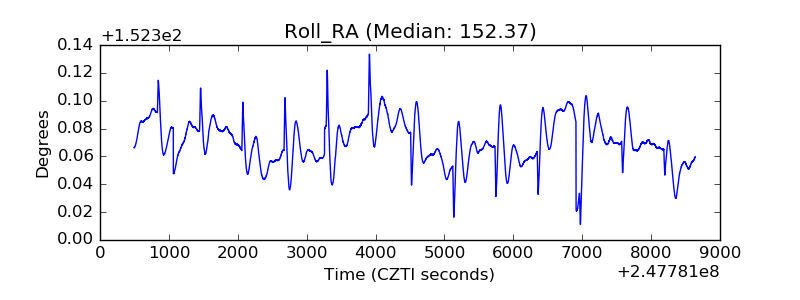 |
| Veto Counter | 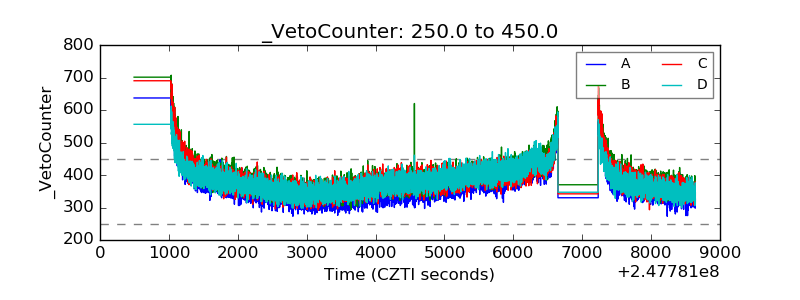 |