| Param | Original file | Final file |
|---|---|---|
| Filename | modeM0/AS1A04_024T04_9000001670_11425cztM0_level2.evt | modeM0/AS1A04_024T04_9000001670_11425cztM0_level2_quad_clean.evt |
| Size (bytes) | 619,450,560 | 108,650,880 |
| Size | 590.8 MB | 103.6 MB |
| Events in quadrant A | 3,744,127 | 697,751 |
| Events in quadrant B | 6,684,317 | 681,101 |
| Events in quadrant C | 3,566,126 | 699,271 |
| Events in quadrant D | 4,229,064 | 662,094 |
| Mode M0 | |||
|---|---|---|---|
| Quadrant | BADHDUFLAG | Total packets | Discarded packets |
| A | 0 | 16539 | 3 |
| B | 0 | 25258 | 2 |
| C | 0 | 16249 | 2 |
| D | 0 | 18081 | 2 |
| Mode SS | |||
|---|---|---|---|
| Quadrant | BADHDUFLAG | Total packets | Discarded packets |
| A | 0 | 160 | 0 |
| B | 0 | 160 | 0 |
| C | 0 | 160 | 0 |
| D | 0 | 160 | 0 |
| Quadrant | Total seconds | Saturated seconds | Saturation percentage |
|---|---|---|---|
| A | 7906 | 54 | 0.683026% |
| B | 7906 | 962 | 12.167974% |
| C | 7906 | 39 | 0.493296% |
| D | 7906 | 137 | 1.732861% |
Noise dominated data is calculated using 1-second bins in cleaned event files. If a bin has >2000 counts, and if more than 50% of those come from <1% of pixels, then it is considered to be noise-dominated and hence unusable.
| Quadrant | # 1 sec bins | Bins with >0 counts | Bins with >2000 counts | High rate bins dominated by noise | Noise dominated (total time) | Noise dominated (detector-on time) | Marked lightcurve |
|---|---|---|---|---|---|---|---|
| A | 7966 | 7907 | 0 | 0 | 0.00% | 0.00% | 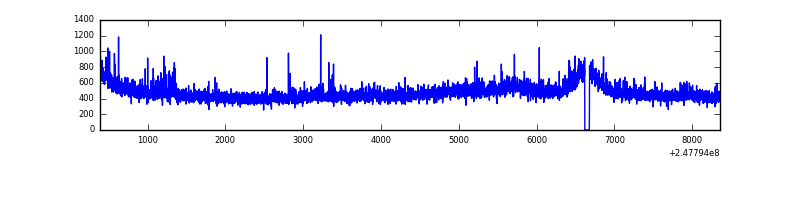 |
| B | 7966 | 7907 | 462 | 462 | 5.80% | 5.84% | 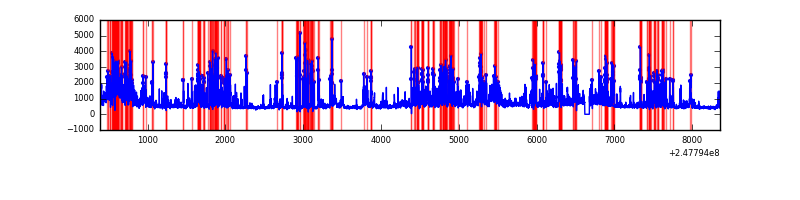 |
| C | 7966 | 7907 | 1 | 1 | 0.01% | 0.01% | 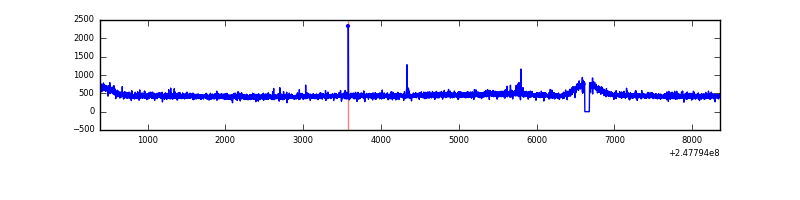 |
| D | 7966 | 7907 | 78 | 78 | 0.98% | 0.99% | 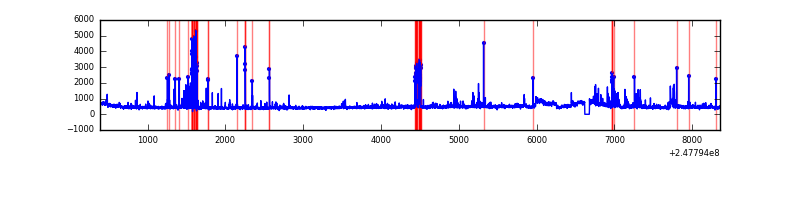 |
Top three noisy pixels from each quadrant. If the there are fewer than three noisy pixels in the level2.evt file, extra rows are filled as -1
| Pixel properties | Quadrant properties | ||||||
|---|---|---|---|---|---|---|---|
| Quadrant | DetID | PixID | Counts | Sigma | Mean | Median | Sigma |
| A | 1 | 162 | 53870 | 278.19 | 929 | 910 | 190.4 |
| A | 1 | 178 | 29605 | 150.73 | 929 | 910 | 190.4 |
| A | 8 | 5 | 26378 | 133.78 | 929 | 910 | 190.4 |
| B | 4 | 239 | 1529255 | 9006.2 | 898 | 875 | 169.7 |
| B | 3 | 64 | 1091856 | 6428.76 | 898 | 875 | 169.7 |
| B | 15 | 204 | 186374 | 1093.08 | 898 | 875 | 169.7 |
| C | 12 | 4 | 7734 | 32.3 | 909 | 912 | 211.2 |
| C | 13 | 61 | 6846 | 28.1 | 909 | 912 | 211.2 |
| C | 0 | 207 | 5837 | 23.32 | 909 | 912 | 211.2 |
| D | 10 | 253 | 168653 | 770.74 | 898 | 869 | 217.7 |
| D | 1 | 52 | 163802 | 748.46 | 898 | 869 | 217.7 |
| D | 13 | 172 | 145742 | 665.5 | 898 | 869 | 217.7 |
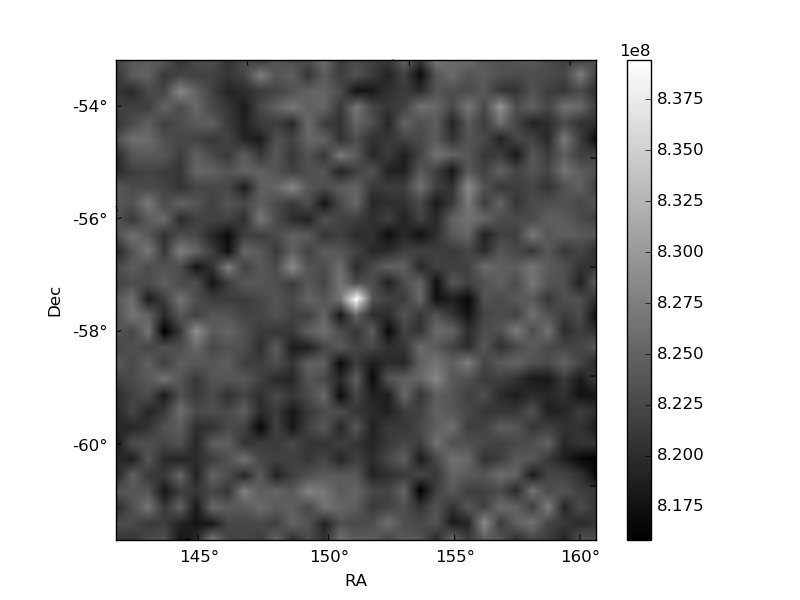
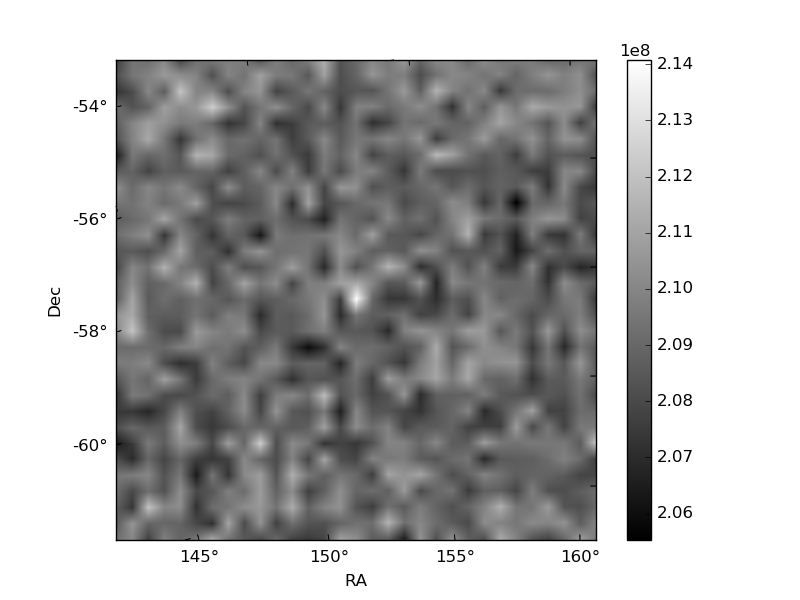
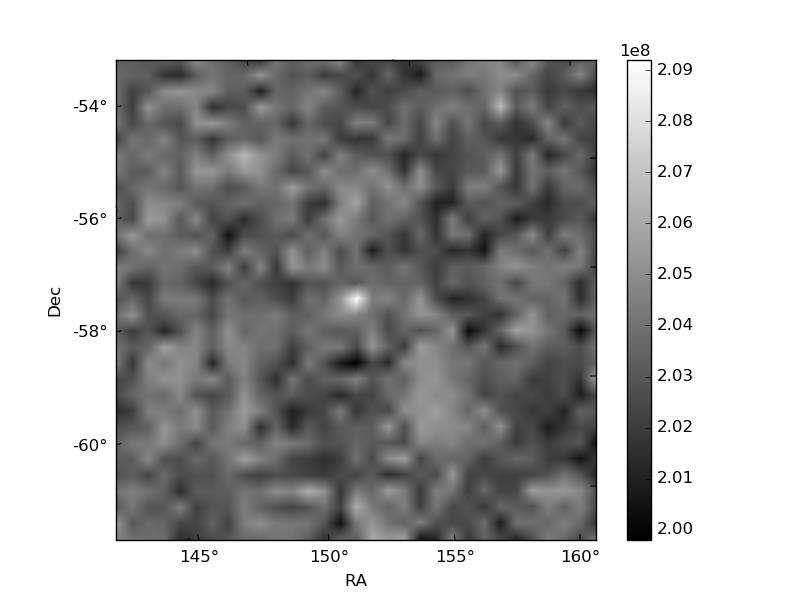
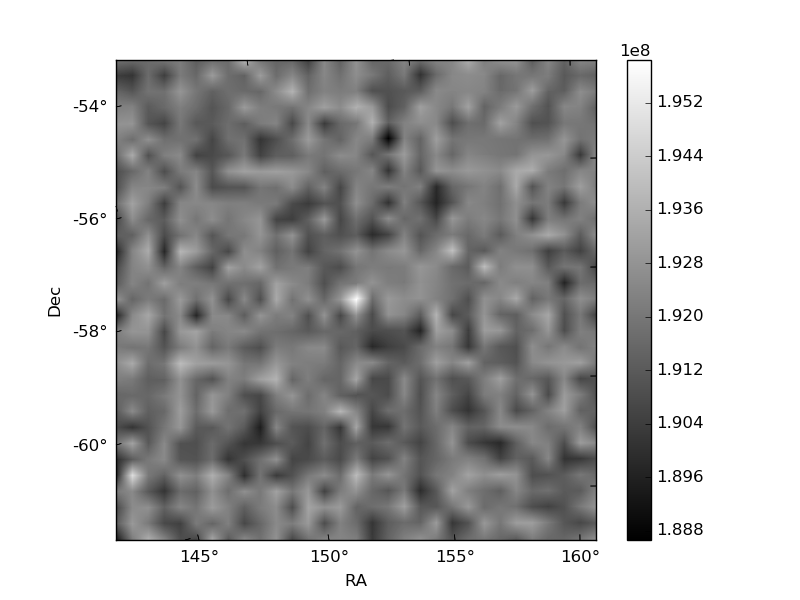
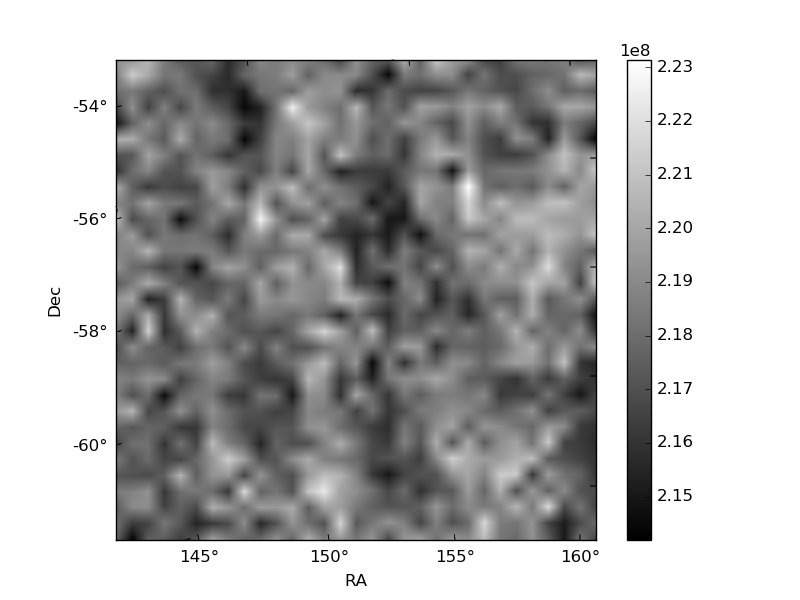
Histogram calculated using DETX and DETY for each event in the final _common_clean file
| Quadrant A | 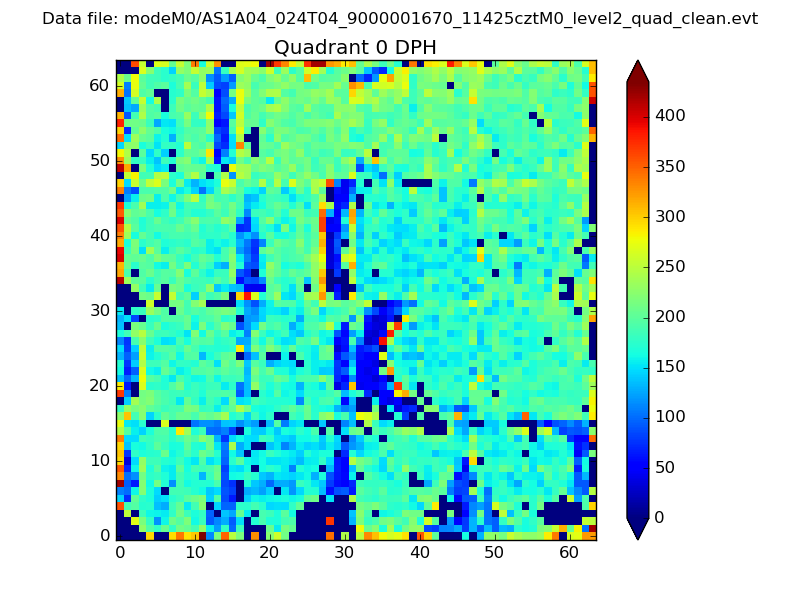 |
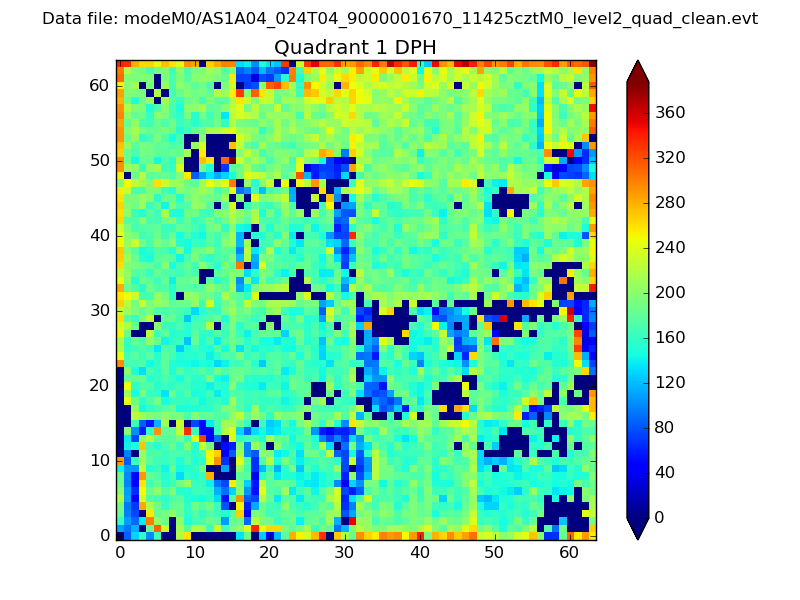 |
Quadrant B |
|---|---|---|---|
| Quadrant D | 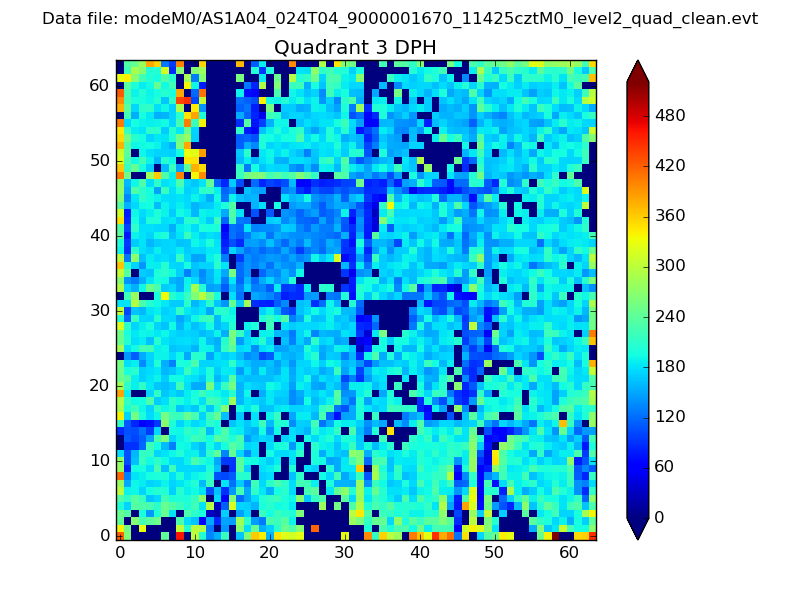 |
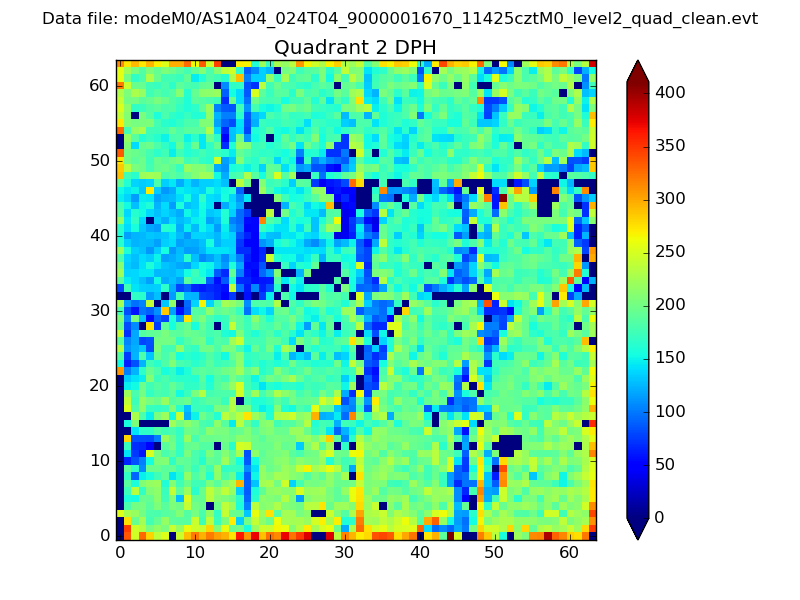 |
Quadrant C |
| Plot type | Count rate plots | Images |
|---|---|---|
| Comparison with Poisson distribution Blue bars denote a histogram of data divided into 1 sec bins. Red curve is a Poisson curve with rate = median count rate of data. |
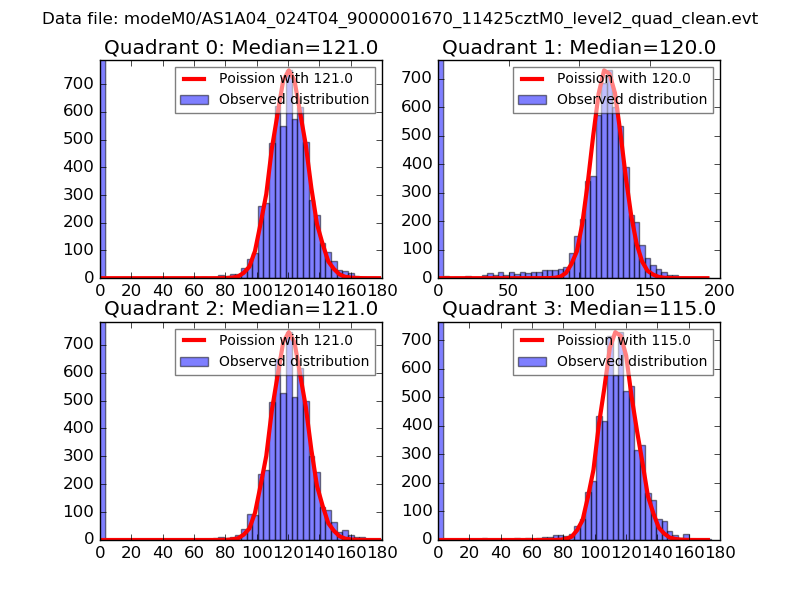 |
 |
| Quadrant-wise count rates Data is divided into 100 sec bins |
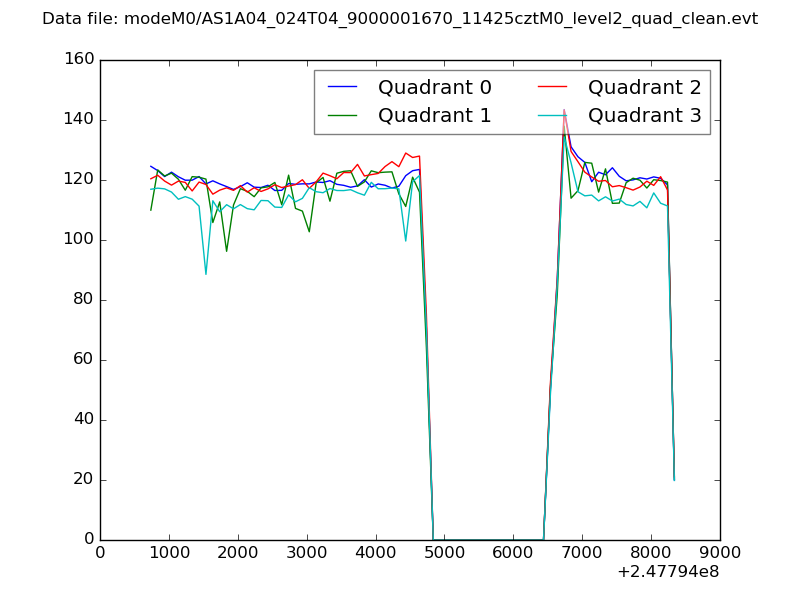 |
|
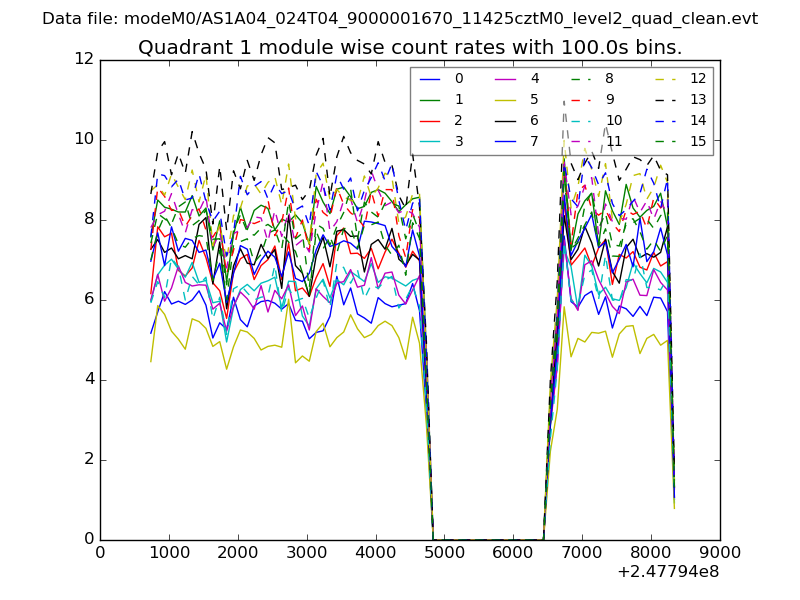
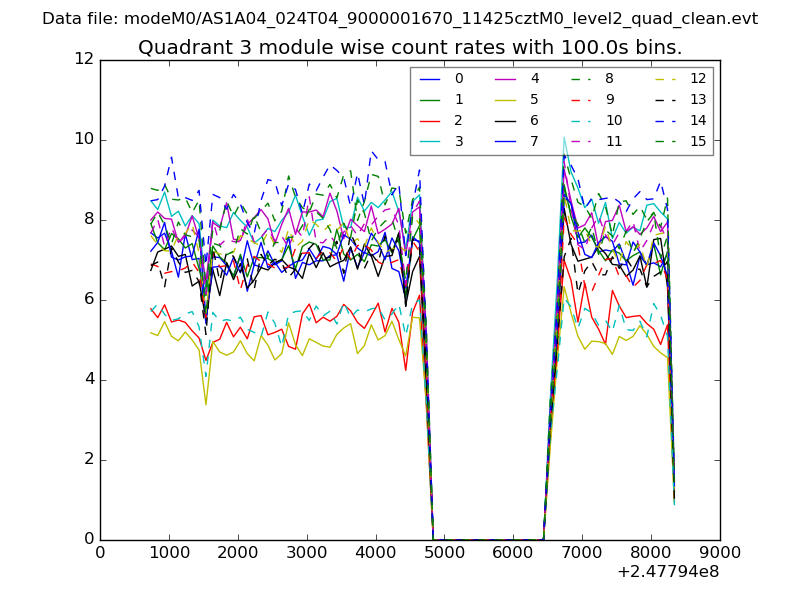
| Module-wise count rates for Quadrant A Data is divided into 100 sec bins |
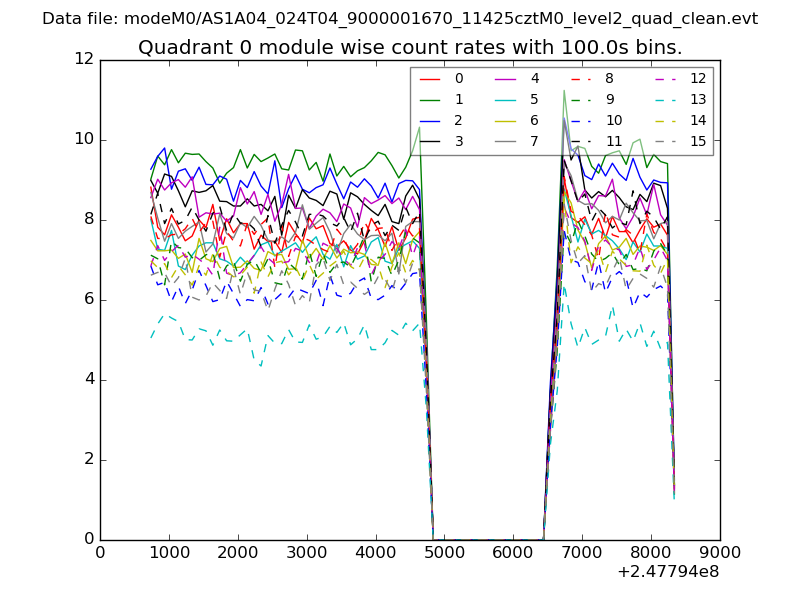 |
 |
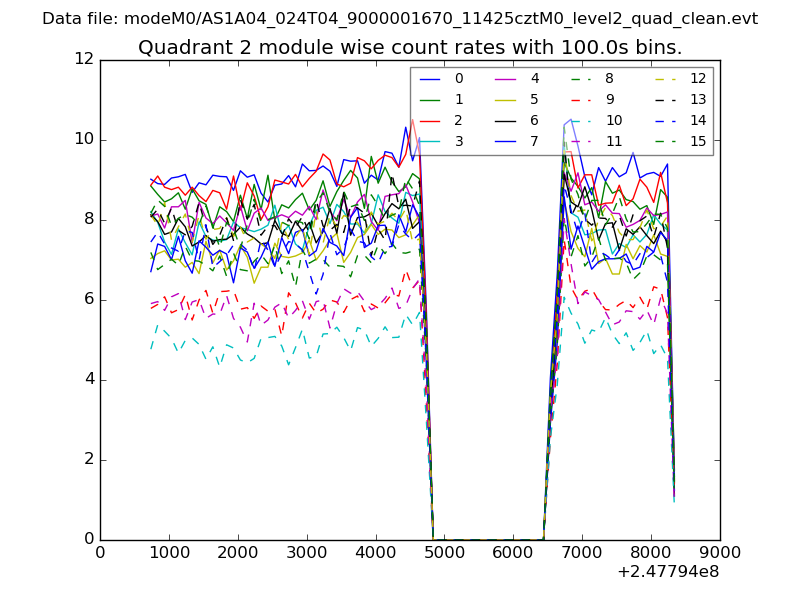
| Module-wise count rates for Quadrant B Data is divided into 100 sec bins |
 |
 |
| Module-wise count rates for Quadrant C Data is divided into 100 sec bins |
 |
 |
| Module-wise count rates for Quadrant D Data is divided into 100 sec bins |
 |
 |
| Parameter | Plot |
|---|---|
| CZT HV Monitor | 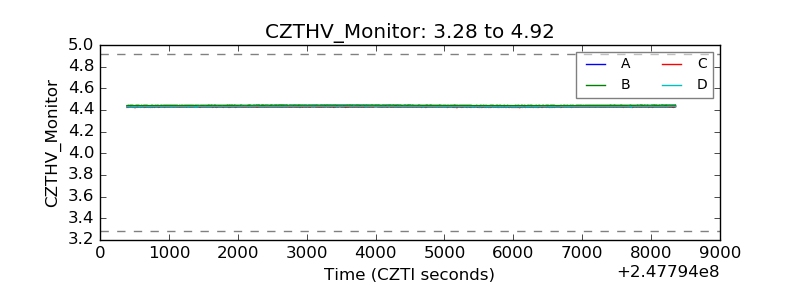 |
| D_VDD | 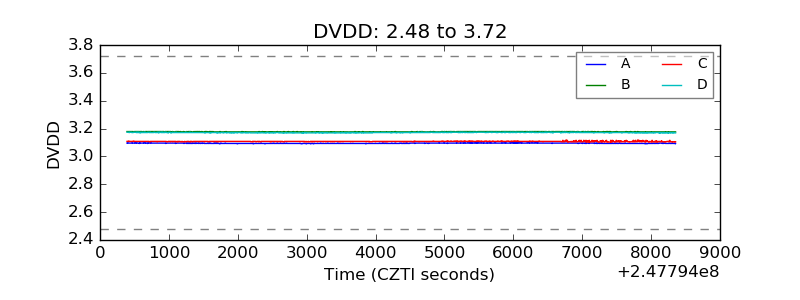 |
| Temperature 1 | 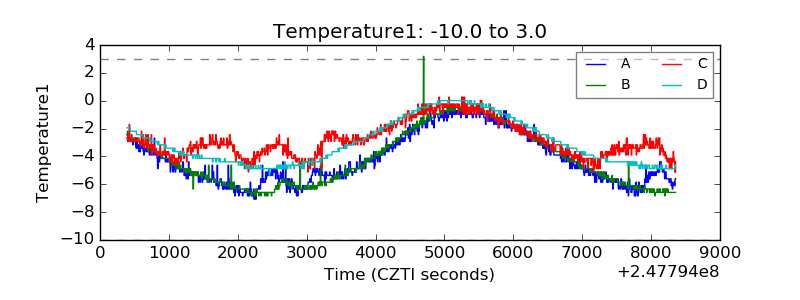 |
| Veto HV Monitor | 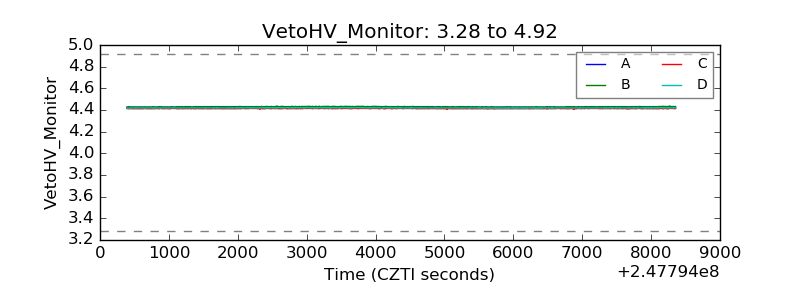 |
| Veto LLD | 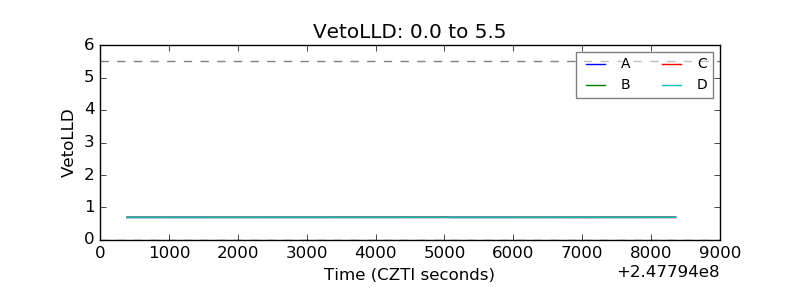 |
| Alpha Counter | 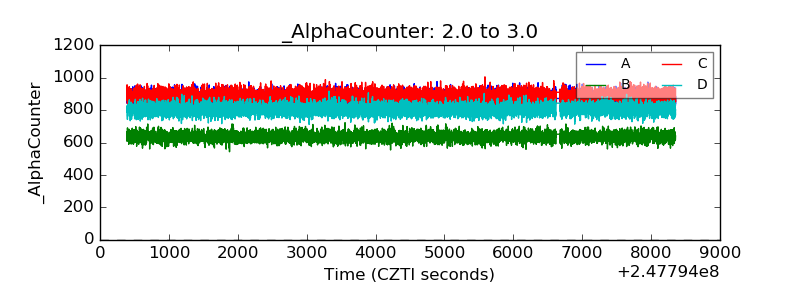 |
| _CPM_Rate | 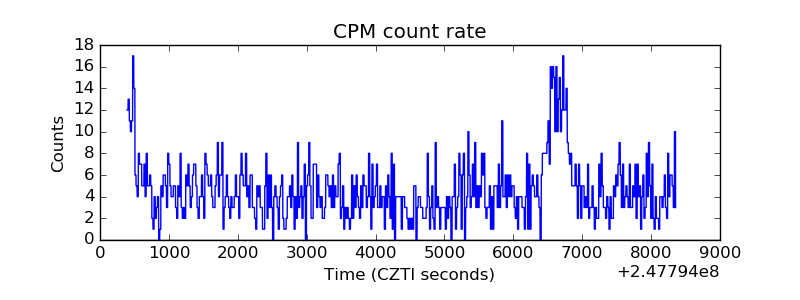 |
| CZT Counter | 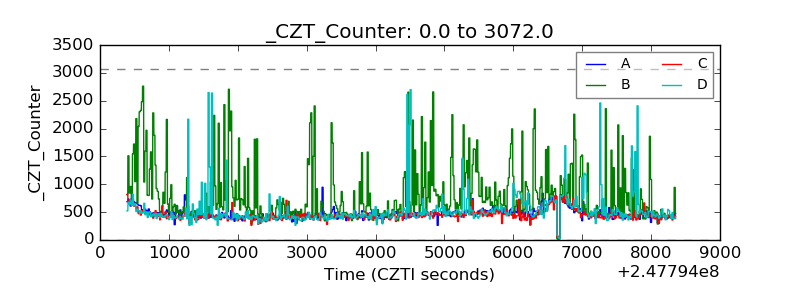 |
| +2.5 Volts monitor | 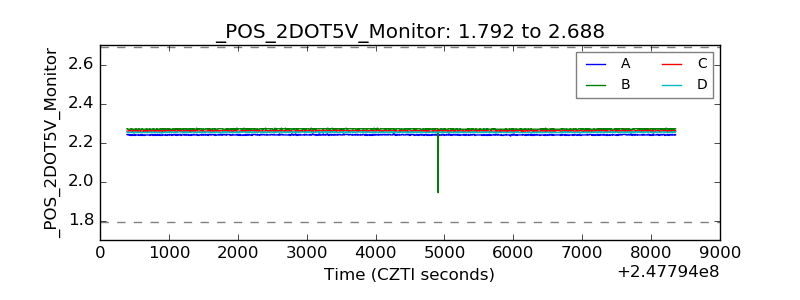 |
| +5 Volts monitor |  |
| _ROLL_ROT | 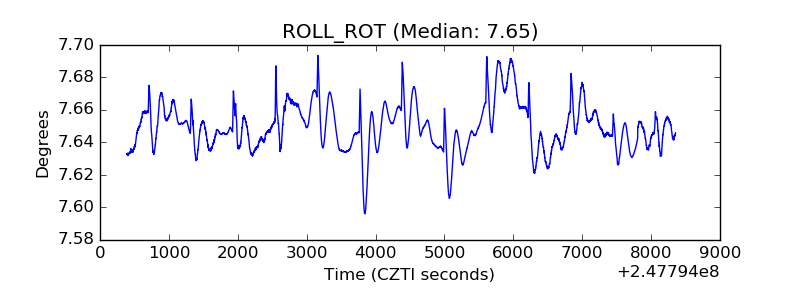 |
| _Roll_DEC | 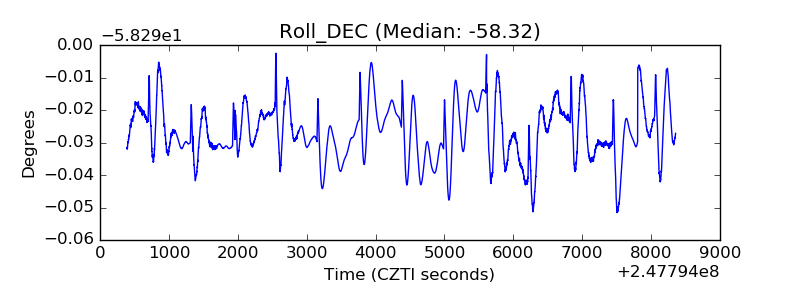 |
| _Roll_RA | 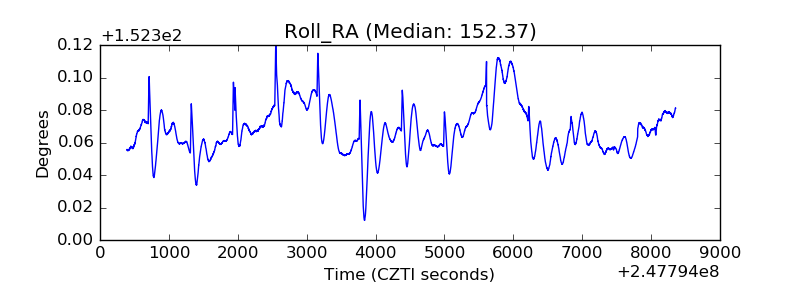 |
| Veto Counter | 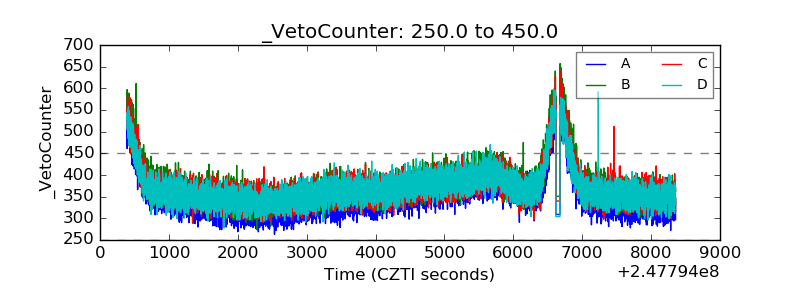 |