| Param | Original file | Final file |
|---|---|---|
| Filename | modeM0/AS1A04_024T04_9000001670_11428cztM0_level2.evt | modeM0/AS1A04_024T04_9000001670_11428cztM0_level2_quad_clean.evt |
| Size (bytes) | 1,368,267,840 | 213,419,520 |
| Size | 1.3 GB | 203.5 MB |
| Events in quadrant A | 7,779,099 | 1,352,185 |
| Events in quadrant B | 10,803,642 | 1,347,267 |
| Events in quadrant C | 7,348,698 | 1,371,767 |
| Events in quadrant D | 14,383,163 | 1,244,119 |
| Mode M9 | |||
|---|---|---|---|
| Quadrant | BADHDUFLAG | Total packets | Discarded packets |
| A | 0 | 9 | 0 |
| B | 0 | 9 | 0 |
| C | 0 | 9 | 0 |
| D | 0 | 9 | 0 |
| Mode M0 | |||
|---|---|---|---|
| Quadrant | BADHDUFLAG | Total packets | Discarded packets |
| A | 0 | 34115 | 2 |
| B | 0 | 43049 | 2 |
| C | 0 | 33565 | 2 |
| D | 0 | 54172 | 2 |
| Mode SS | |||
|---|---|---|---|
| Quadrant | BADHDUFLAG | Total packets | Discarded packets |
| A | 0 | 336 | 0 |
| B | 0 | 336 | 0 |
| C | 0 | 336 | 0 |
| D | 0 | 336 | 0 |
| Quadrant | Total seconds | Saturated seconds | Saturation percentage |
|---|---|---|---|
| A | 16653 | 50 | 0.300246% |
| B | 16653 | 793 | 4.761905% |
| C | 16653 | 42 | 0.252207% |
| D | 16653 | 1279 | 7.680298% |
Noise dominated data is calculated using 1-second bins in cleaned event files. If a bin has >2000 counts, and if more than 50% of those come from <1% of pixels, then it is considered to be noise-dominated and hence unusable.
| Quadrant | # 1 sec bins | Bins with >0 counts | Bins with >2000 counts | High rate bins dominated by noise | Noise dominated (total time) | Noise dominated (detector-on time) | Marked lightcurve |
|---|---|---|---|---|---|---|---|
| A | 17548 | 16655 | 3 | 3 | 0.02% | 0.02% | 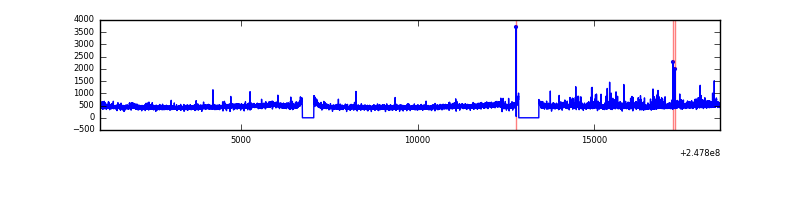 |
| B | 17548 | 16655 | 411 | 411 | 2.34% | 2.47% | 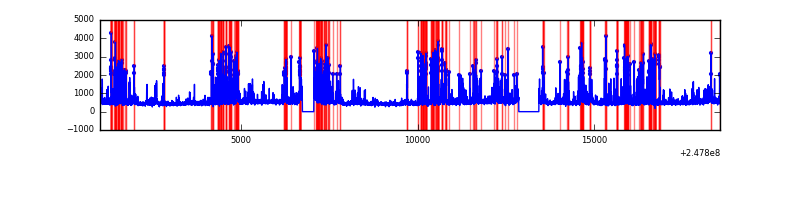 |
| C | 17548 | 16655 | 0 | 0 | 0.00% | 0.00% | 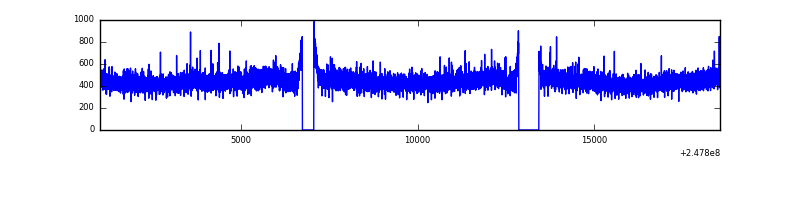 |
| D | 17548 | 16655 | 1009 | 1009 | 5.75% | 6.06% | 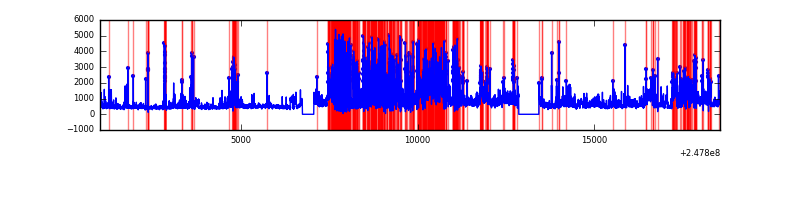 |
Top three noisy pixels from each quadrant. If the there are fewer than three noisy pixels in the level2.evt file, extra rows are filled as -1
| Pixel properties | Quadrant properties | ||||||
|---|---|---|---|---|---|---|---|
| Quadrant | DetID | PixID | Counts | Sigma | Mean | Median | Sigma |
| A | 13 | 251 | 144848 | 368.28 | 1913 | 1873 | 388.2 |
| A | 1 | 162 | 84704 | 213.36 | 1913 | 1873 | 388.2 |
| A | 8 | 15 | 52731 | 131.0 | 1913 | 1873 | 388.2 |
| B | 4 | 239 | 2395279 | 6711.67 | 1893 | 1849 | 356.6 |
| B | 3 | 64 | 546998 | 1528.71 | 1893 | 1849 | 356.6 |
| B | 15 | 204 | 147427 | 408.23 | 1893 | 1849 | 356.6 |
| C | 13 | 250 | 15179 | 30.78 | 1873 | 1882 | 432.0 |
| C | 8 | 128 | 15099 | 30.6 | 1873 | 1882 | 432.0 |
| C | 13 | 61 | 13678 | 27.31 | 1873 | 1882 | 432.0 |
| D | 1 | 52 | 3751891 | 8593.87 | 1815 | 1766 | 436.4 |
| D | 13 | 152 | 2865159 | 6561.81 | 1815 | 1766 | 436.4 |
| D | 9 | 85 | 171936 | 389.97 | 1815 | 1766 | 436.4 |
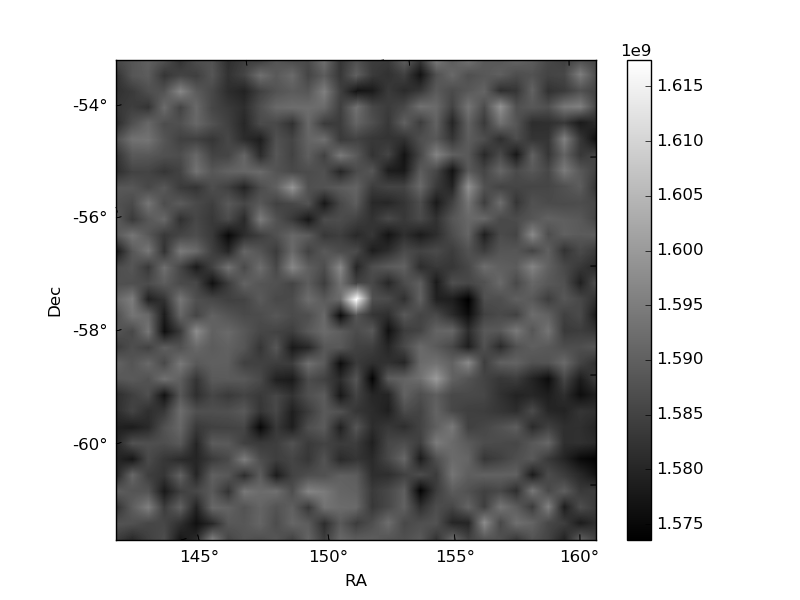
Histogram calculated using DETX and DETY for each event in the final _common_clean file
| Quadrant A | 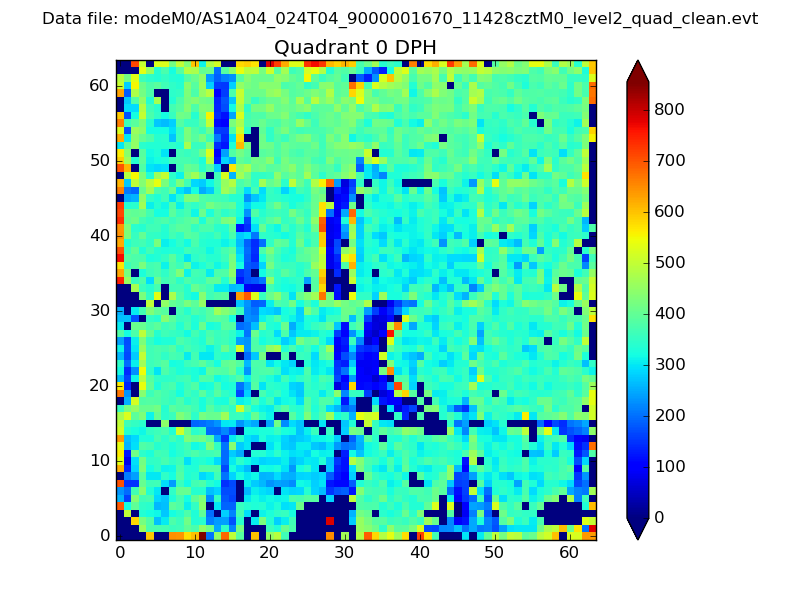 |
 |
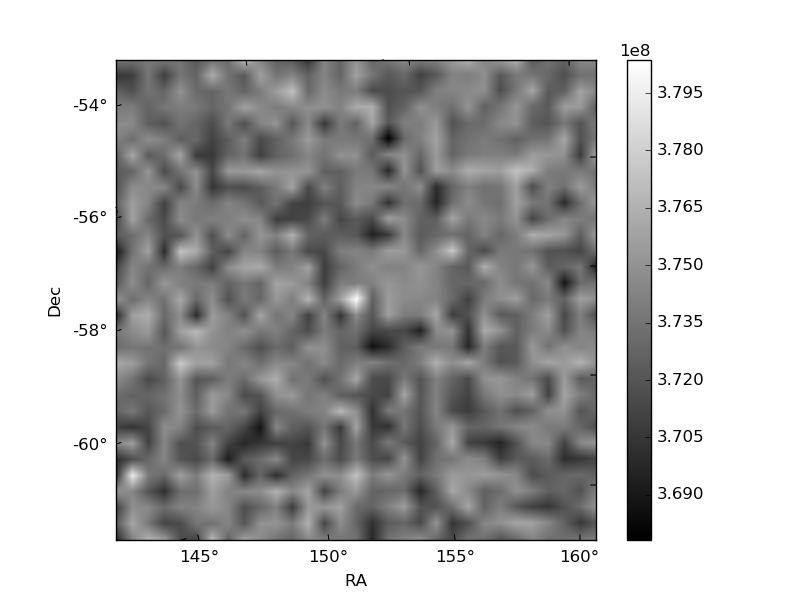
Quadrant B |
|---|---|---|---|
| Quadrant D | 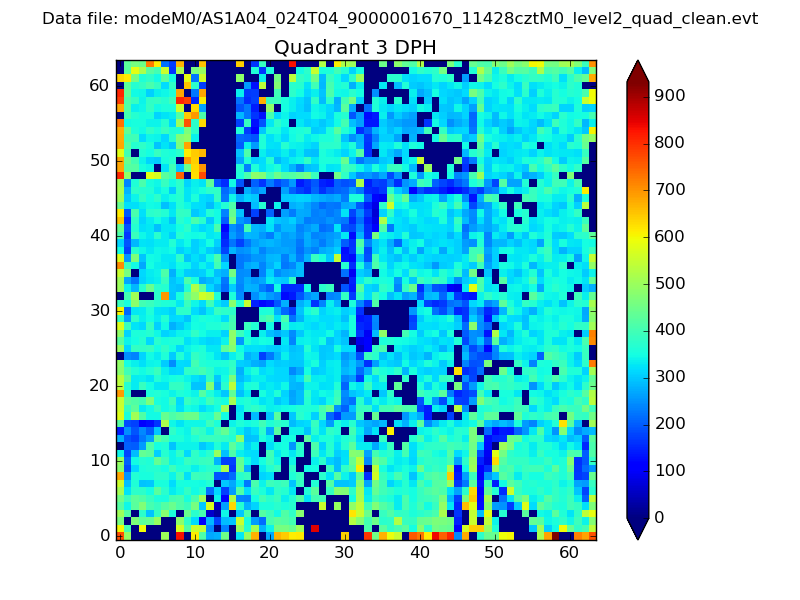 |
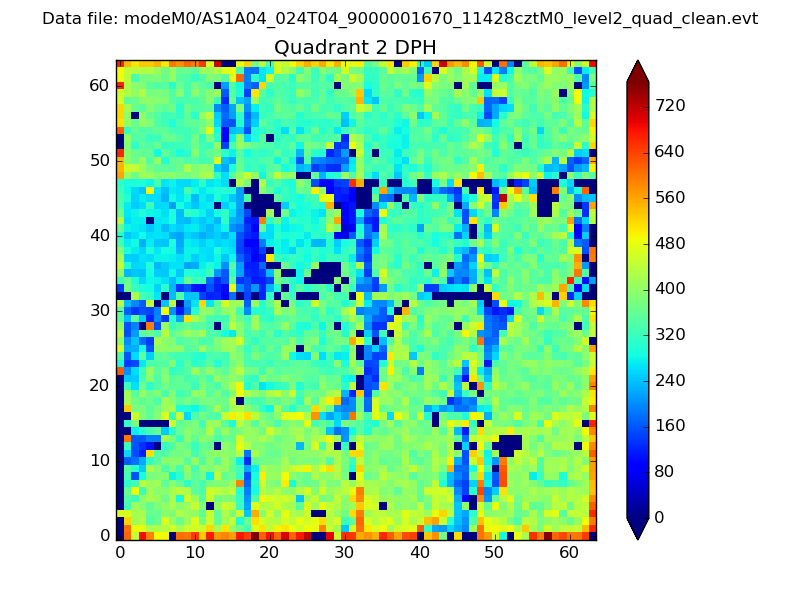 |
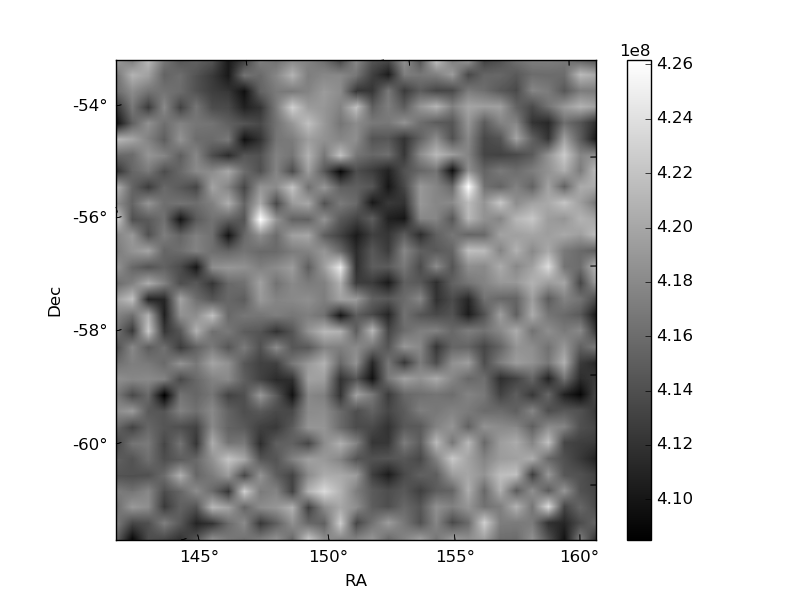
Quadrant C |
| Plot type | Count rate plots | Images |
|---|---|---|
| Comparison with Poisson distribution Blue bars denote a histogram of data divided into 1 sec bins. Red curve is a Poisson curve with rate = median count rate of data. |
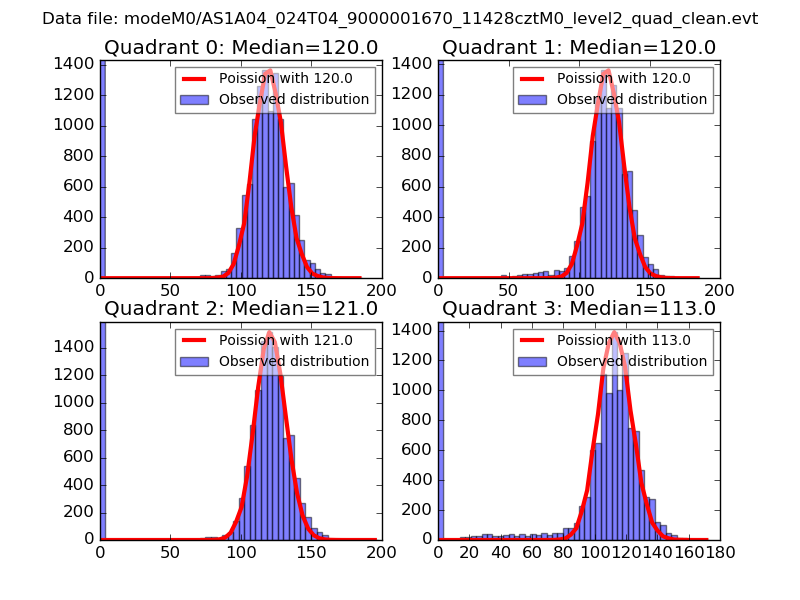 |
 |
| Quadrant-wise count rates Data is divided into 100 sec bins |
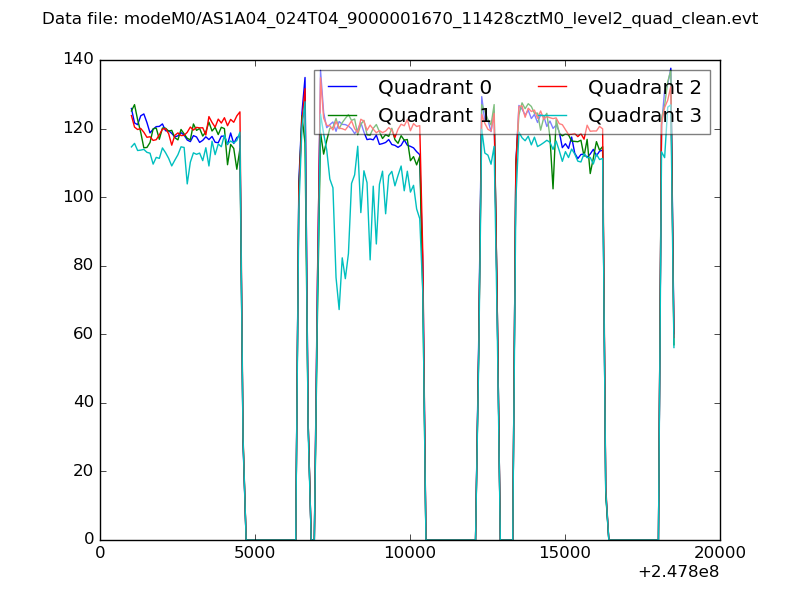 |
|
| Module-wise count rates for Quadrant A Data is divided into 100 sec bins |
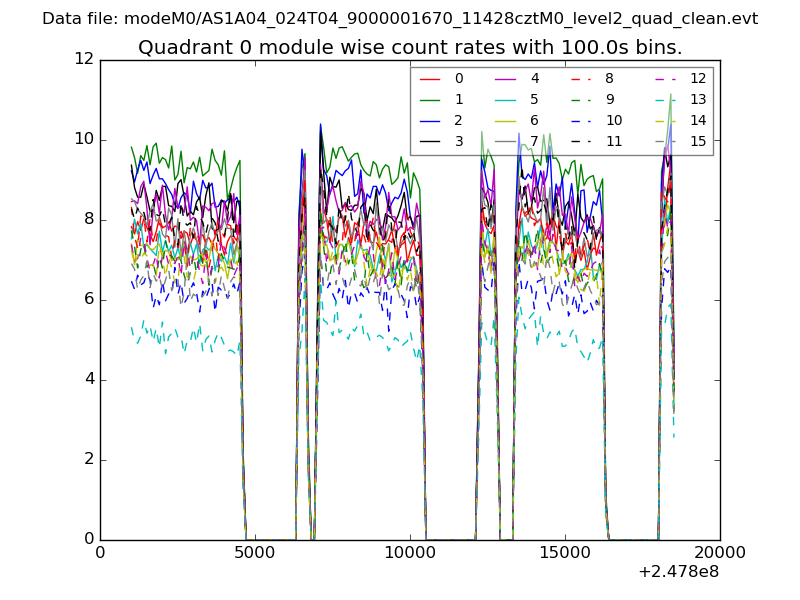 |
 |
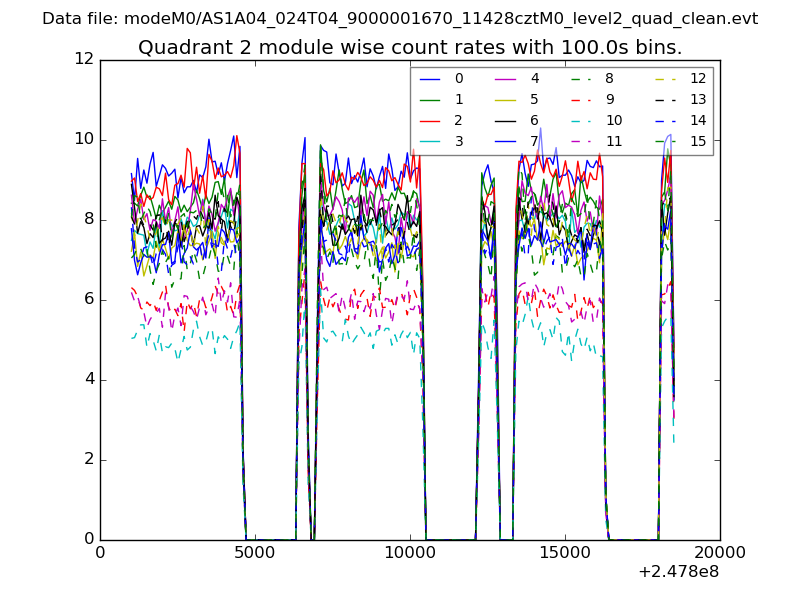
| Module-wise count rates for Quadrant B Data is divided into 100 sec bins |
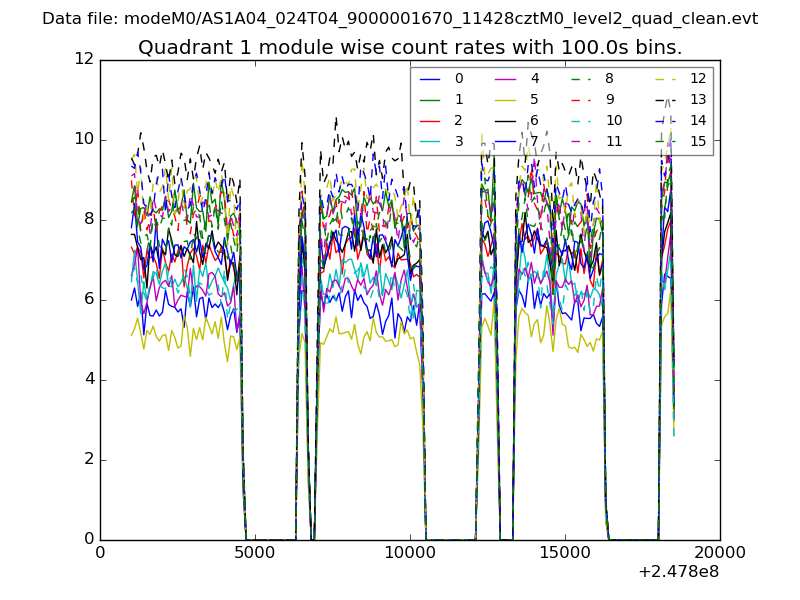 |
 |
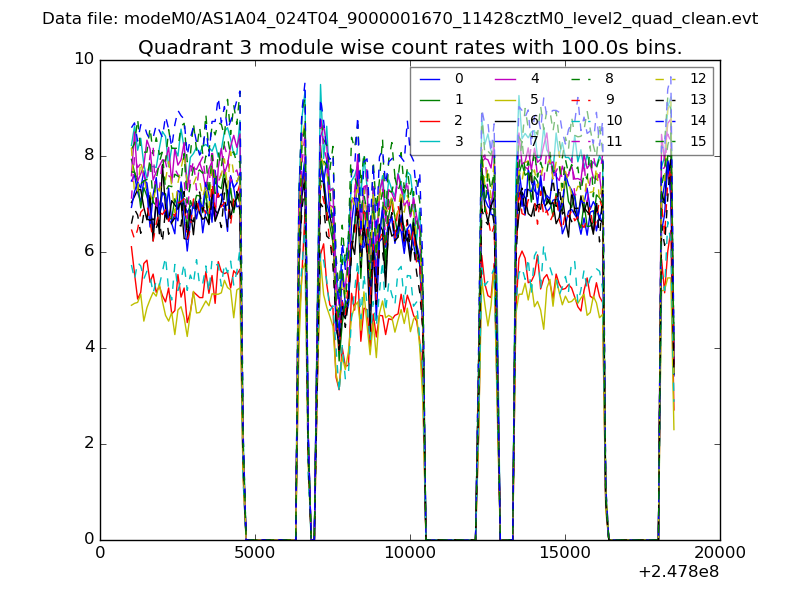
| Module-wise count rates for Quadrant C Data is divided into 100 sec bins |
 |
 |
| Module-wise count rates for Quadrant D Data is divided into 100 sec bins |
 |
 |
| Parameter | Plot |
|---|---|
| CZT HV Monitor | 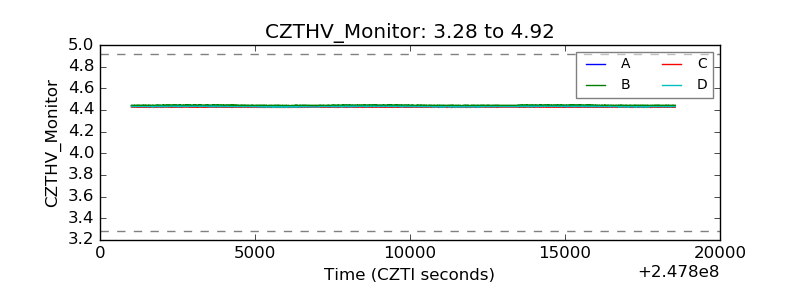 |
| D_VDD | 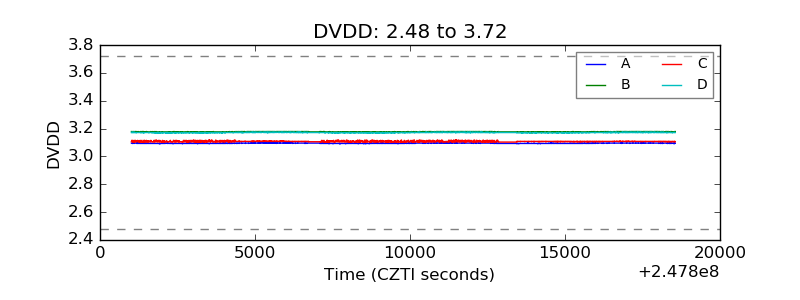 |
| Temperature 1 | 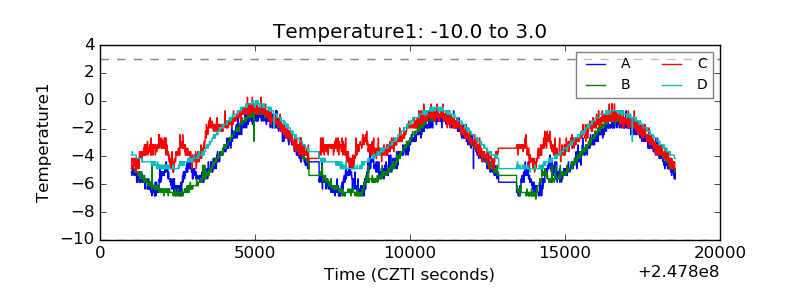 |
| Veto HV Monitor | 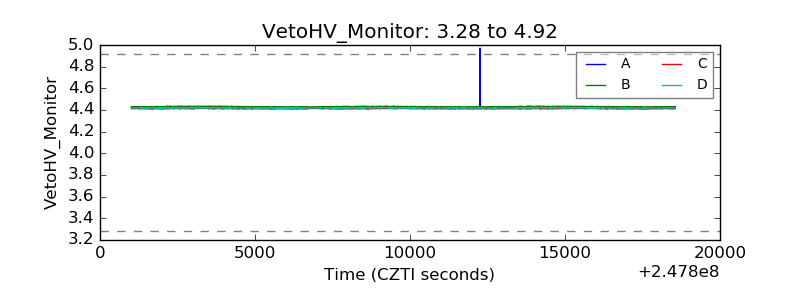 |
| Veto LLD | 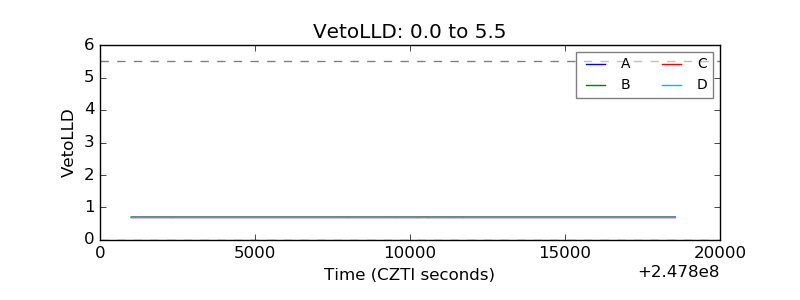 |
| Alpha Counter | 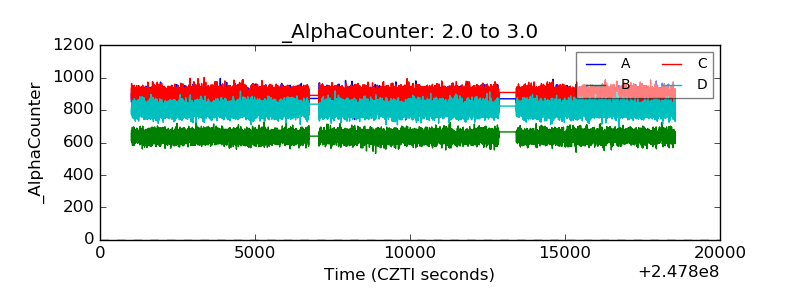 |
| _CPM_Rate | 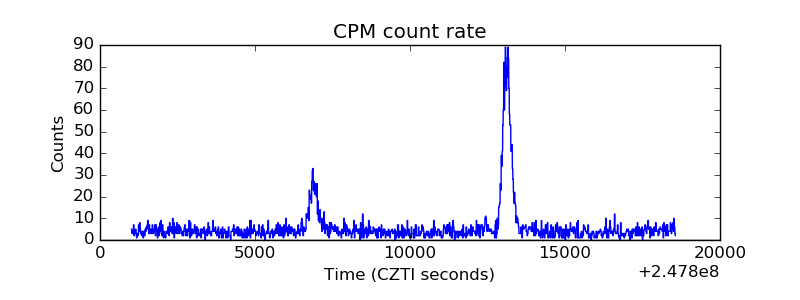 |
| CZT Counter | 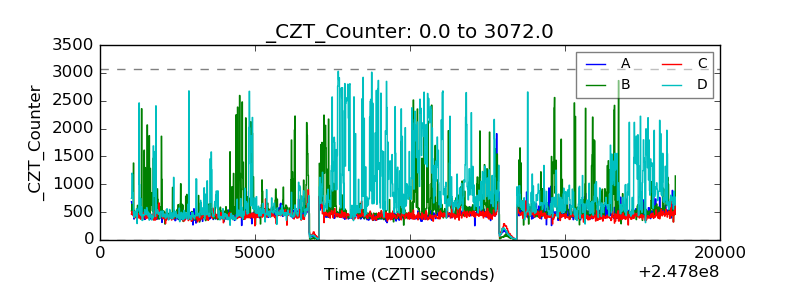 |
| +2.5 Volts monitor | 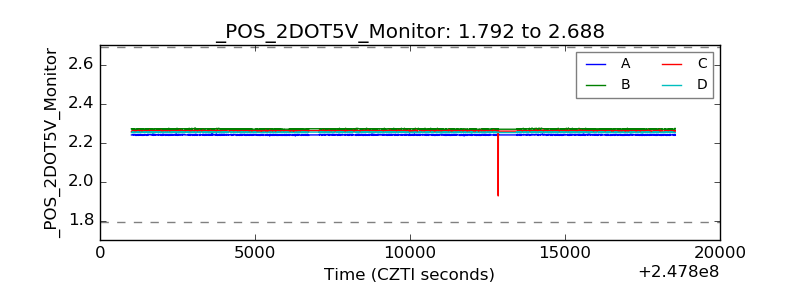 |
| +5 Volts monitor |  |
| _ROLL_ROT | 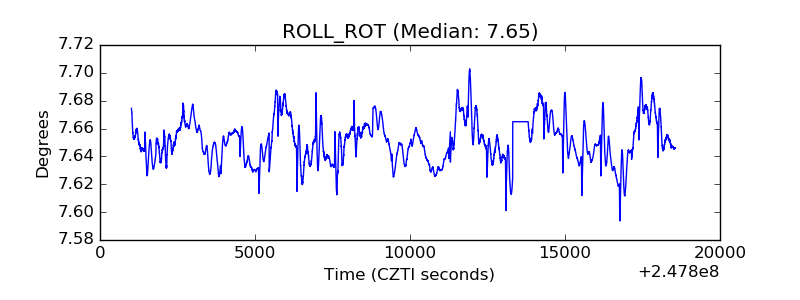 |
| _Roll_DEC | 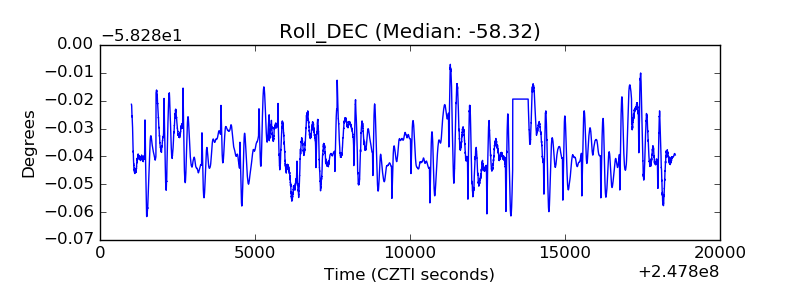 |
| _Roll_RA | 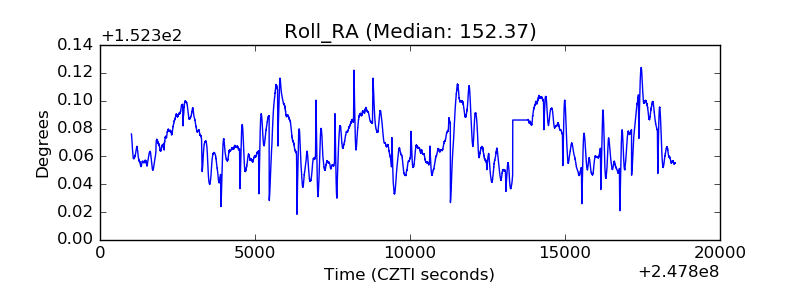 |
| Veto Counter | 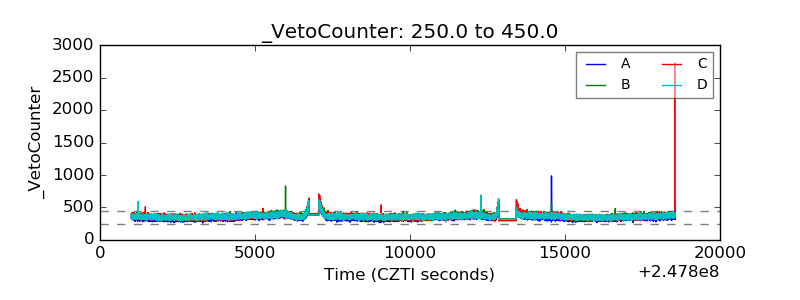 |