| Param | Original file | Final file |
|---|---|---|
| Filename | modeM0/AS1A04_021T02_9000001676cztM0_level2.fits | modeM0/AS1A04_021T02_9000001676cztM0_level2_quad_clean.evt |
| Size (bytes) | 577,281,600 | 603,210,240 |
| Size | 550.5 MB | 575.3 MB |
| Events in quadrant A | 3,510,002 | 3,598,813 |
| Events in quadrant B | 3,289,274 | 3,405,699 |
| Events in quadrant C | 3,485,962 | 3,757,323 |
| Events in quadrant D | 2,979,816 | 3,290,626 |
| Mode M9 | |||
|---|---|---|---|
| Quadrant | BADHDUFLAG | Total packets | Discarded packets |
| A | 0 | 84 | 0 |
| B | 0 | 84 | 0 |
| C | 0 | 84 | 0 |
| D | 0 | 84 | 0 |
| Mode SS | |||
|---|---|---|---|
| Quadrant | BADHDUFLAG | Total packets | Discarded packets |
| A | 0 | 1252 | 0 |
| B | 0 | 1252 | 0 |
| C | 0 | 1252 | 0 |
| D | 0 | 1252 | 0 |
| Mode M0 | |||
|---|---|---|---|
| Quadrant | BADHDUFLAG | Total packets | Discarded packets |
| A | 0 | 133802 | 0 |
| B | 0 | 166357 | 0 |
| C | 0 | 126277 | 0 |
| D | 0 | 151199 | 0 |
| Quadrant | Total seconds | Saturated seconds | Saturation percentage |
|---|---|---|---|
| A | 61465 | 797 | 1.296673% |
| B | 61465 | 3717 | 6.047344% |
| C | 61465 | 473 | 0.769544% |
| D | 61465 | 2074 | 3.374278% |
Noise dominated data is calculated using 1-second bins in cleaned event files. If a bin has >2000 counts, and if more than 50% of those come from <1% of pixels, then it is considered to be noise-dominated and hence unusable.
| Quadrant | # 1 sec bins | Bins with >0 counts | Bins with >2000 counts | High rate bins dominated by noise | Noise dominated (total time) | Noise dominated (detector-on time) | Marked lightcurve |
|---|---|---|---|---|---|---|---|
| A | 69900 | 61464 | 0 | 0 | 0.00% | 0.00% | 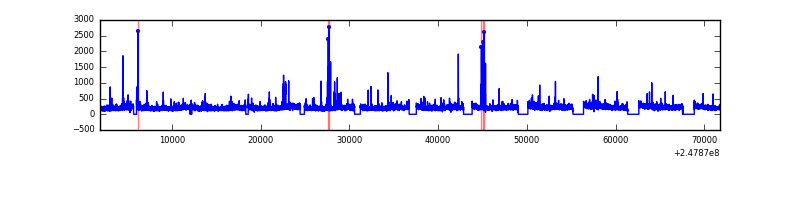 |
| B | 69900 | 61457 | 0 | 0 | 0.00% | 0.00% | 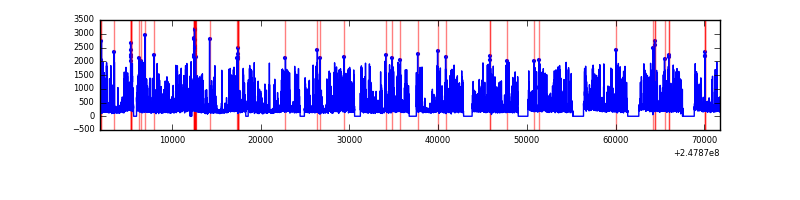 |
| C | 69900 | 61464 | 0 | 0 | 0.00% | 0.00% |  |
| D | 69900 | 61420 | 0 | 0 | 0.00% | 0.00% | 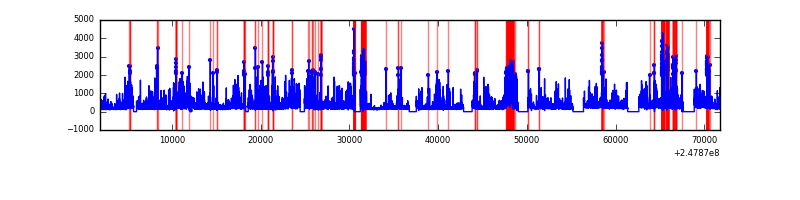 |
Top three noisy pixels from each quadrant. If the there are fewer than three noisy pixels in the level2.evt file, extra rows are filled as -1
| Pixel properties | Quadrant properties | ||||||
|---|---|---|---|---|---|---|---|
| Quadrant | DetID | PixID | Counts | Sigma | Mean | Median | Sigma |
| A | 0 | 29 | 3366 | 10.89 | 915 | 854 | 230.7 |
| A | 7 | 110 | 2892 | 8.83 | 915 | 854 | 230.7 |
| A | 9 | 19 | 2655 | 7.81 | 915 | 854 | 230.7 |
| B | 2 | 9 | 2864 | 11.85 | 868 | 826 | 172.0 |
| B | 3 | 17 | 2285 | 8.48 | 868 | 826 | 172.0 |
| B | 14 | 254 | 2238 | 8.21 | 868 | 826 | 172.0 |
| C | 1 | 81 | 2603 | 7.32 | 917 | 851 | 239.5 |
| C | 1 | 80 | 2586 | 7.25 | 917 | 851 | 239.5 |
| C | 12 | 250 | 2582 | 7.23 | 917 | 851 | 239.5 |
| D | 6 | 231 | 2181 | 6.21 | 849 | 772 | 227.0 |
| D | 3 | 14 | 2160 | 6.11 | 849 | 772 | 227.0 |
| D | 4 | 160 | 2093 | 5.82 | 849 | 772 | 227.0 |
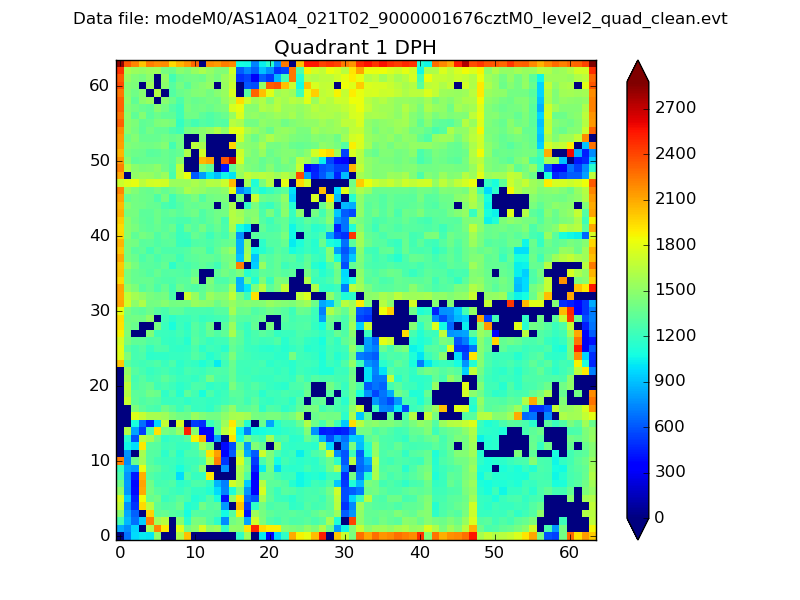
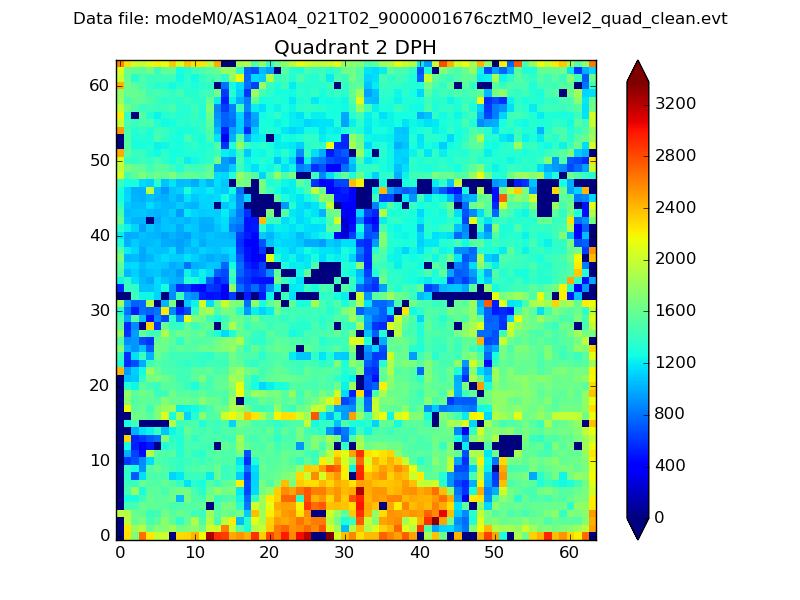
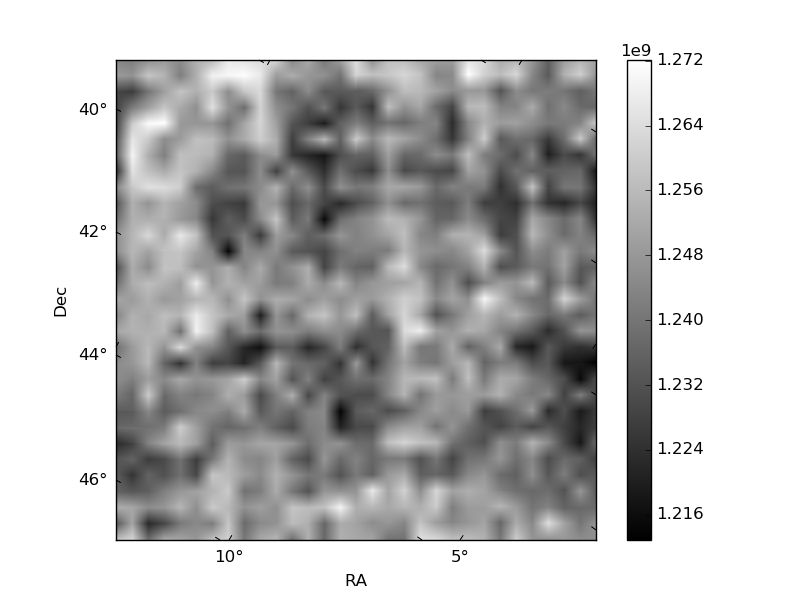
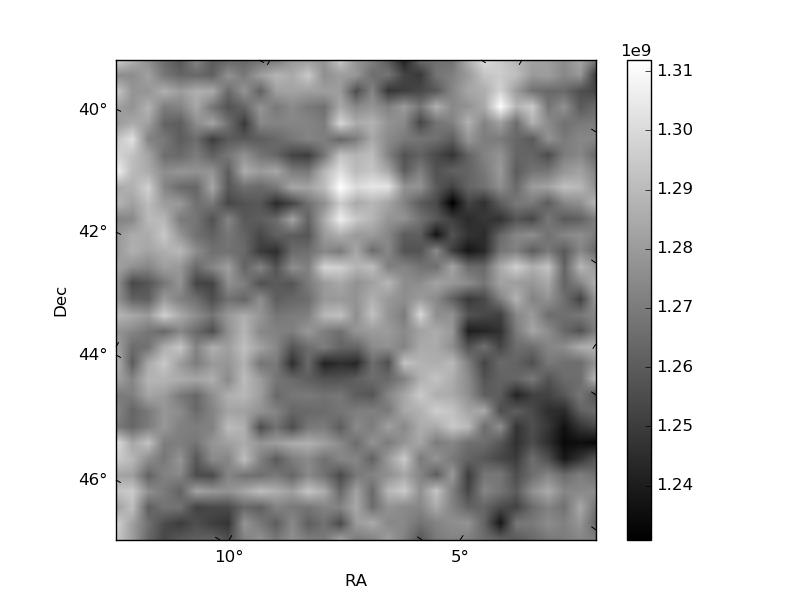
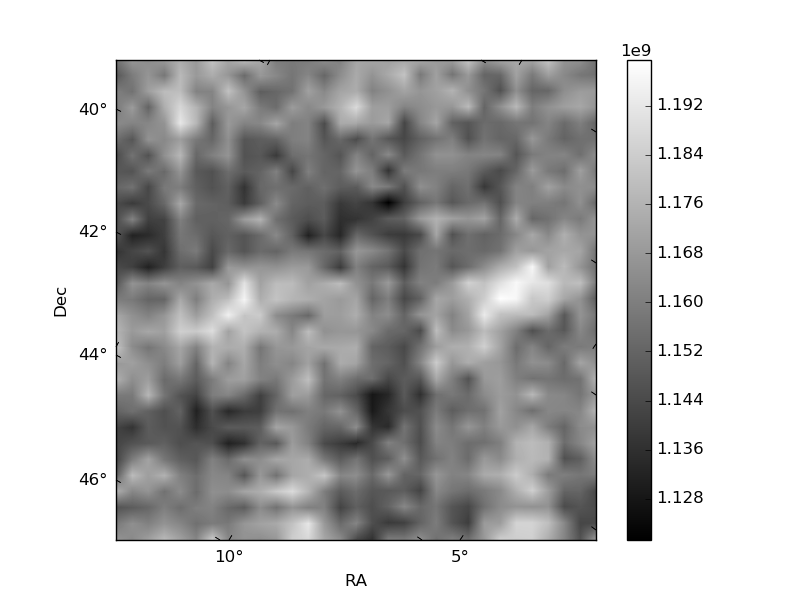
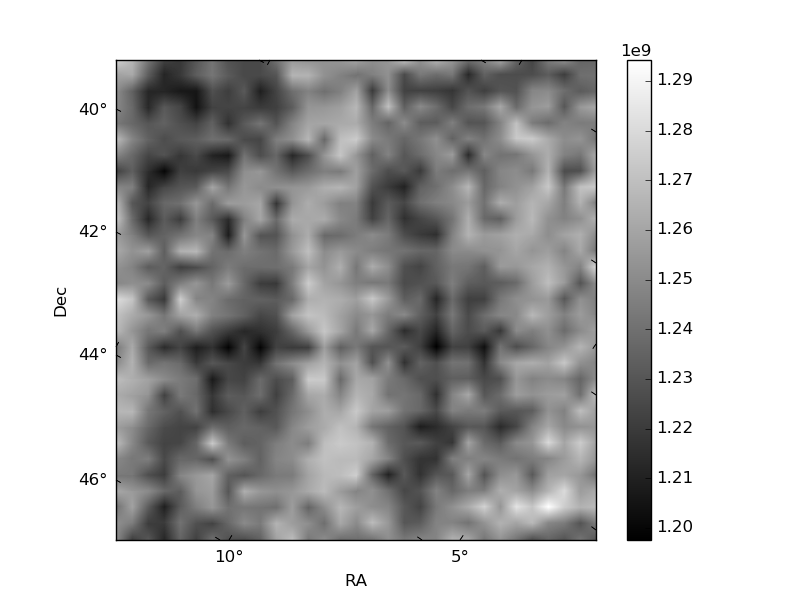
Histogram calculated using DETX and DETY for each event in the final _common_clean file
| Quadrant A | 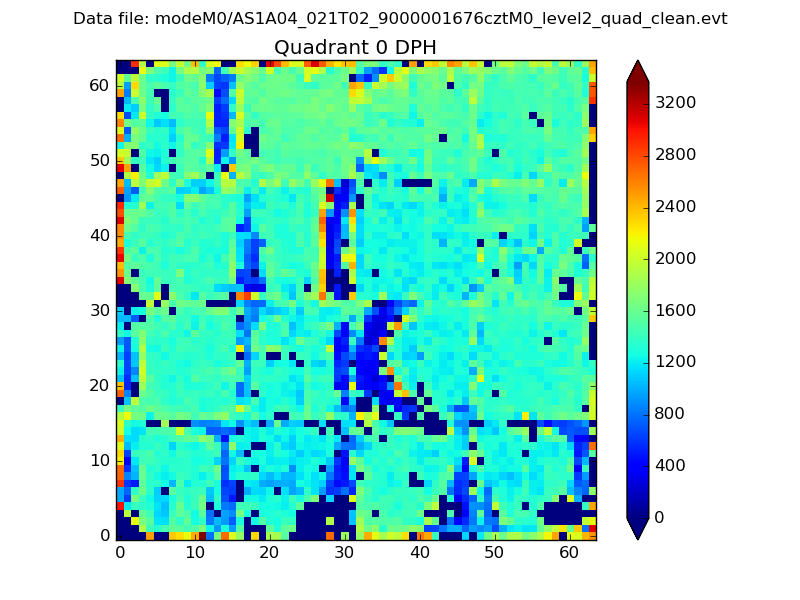 |
 |
Quadrant B |
|---|---|---|---|
| Quadrant D | 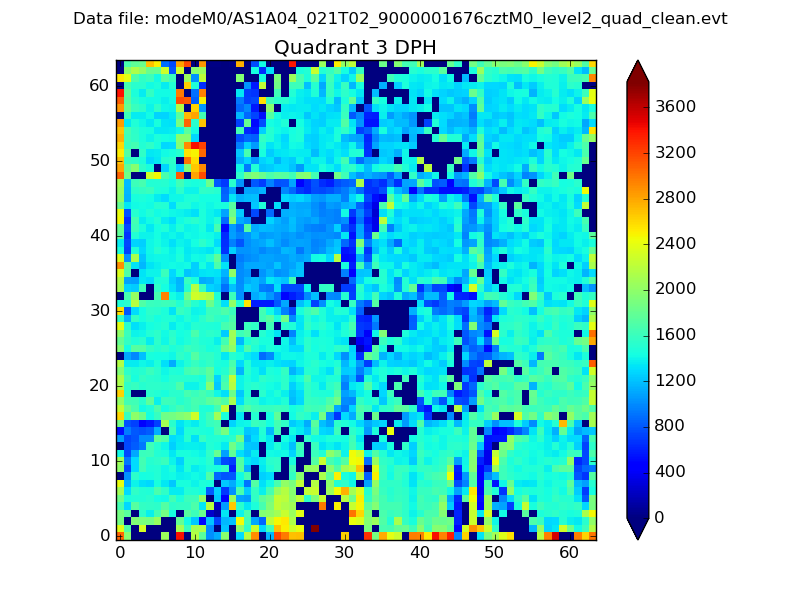 |
 |
Quadrant C |
| Plot type | Count rate plots | Images |
|---|---|---|
| Comparison with Poisson distribution Blue bars denote a histogram of data divided into 1 sec bins. Red curve is a Poisson curve with rate = median count rate of data. |
 |
 |
| Quadrant-wise count rates Data is divided into 100 sec bins |
 |
|
| Module-wise count rates for Quadrant A Data is divided into 100 sec bins |
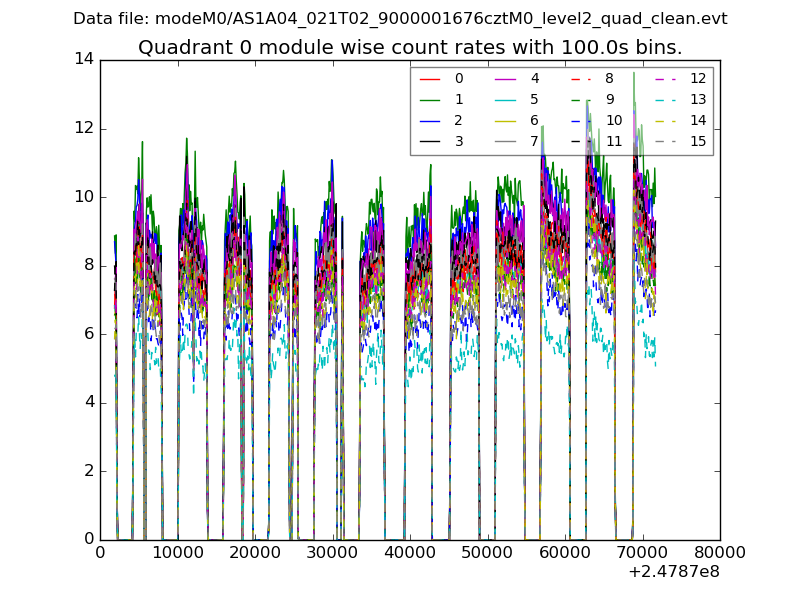 |
 |
| Module-wise count rates for Quadrant B Data is divided into 100 sec bins |
 |
 |
| Module-wise count rates for Quadrant C Data is divided into 100 sec bins |
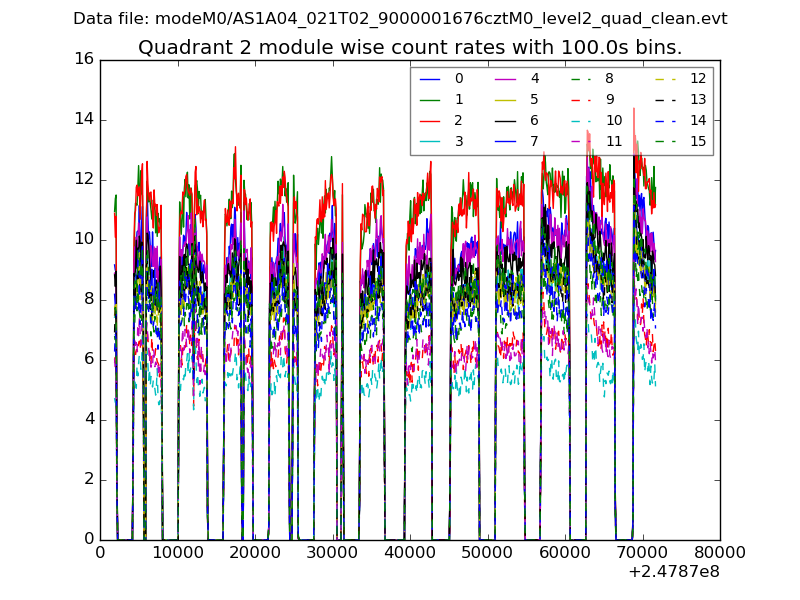 |
 |
| Module-wise count rates for Quadrant D Data is divided into 100 sec bins |
 |
 |
| Parameter | Plot |
|---|---|
| CZT HV Monitor | 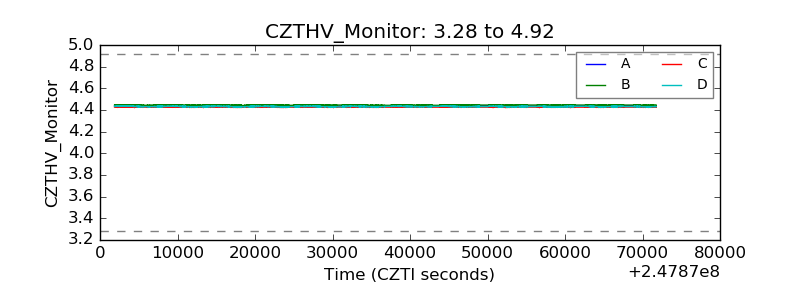 |
| D_VDD | 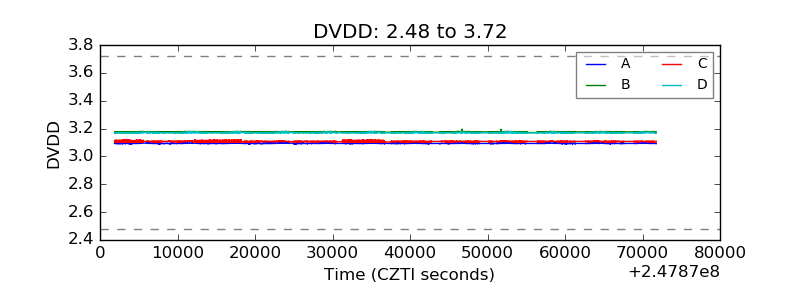 |
| Temperature 1 |  |
| Veto HV Monitor | 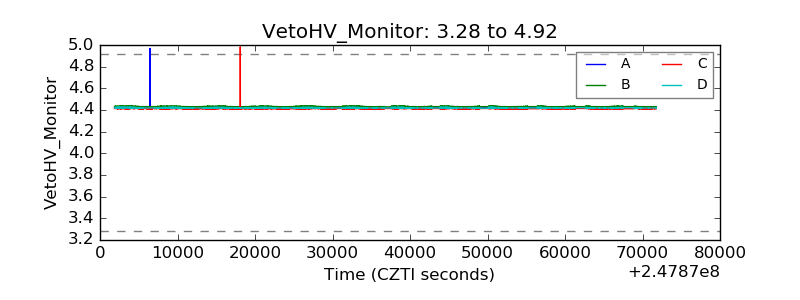 |
| Veto LLD | 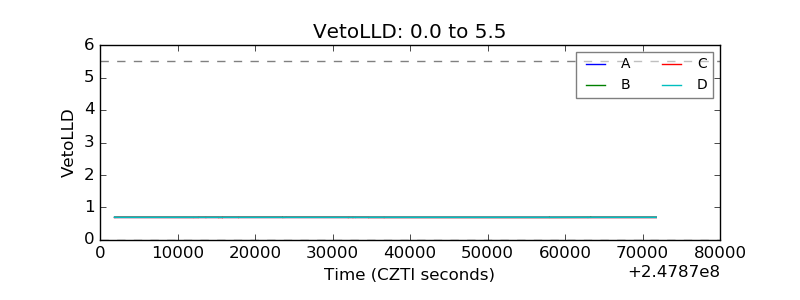 |
| Alpha Counter | 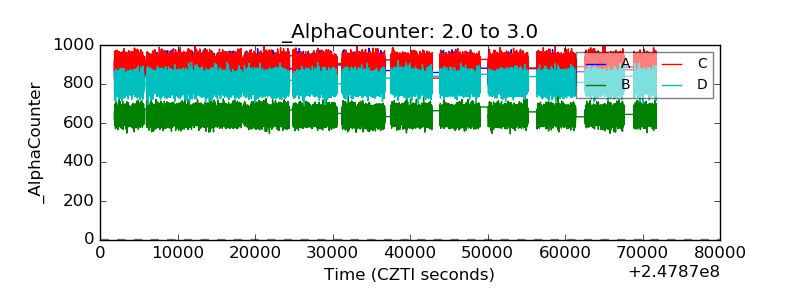 |
| _CPM_Rate |  |
| CZT Counter | 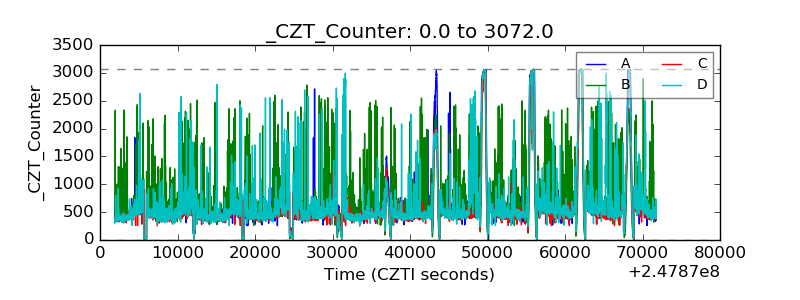 |
| +2.5 Volts monitor |  |
| +5 Volts monitor |  |
| _ROLL_ROT | 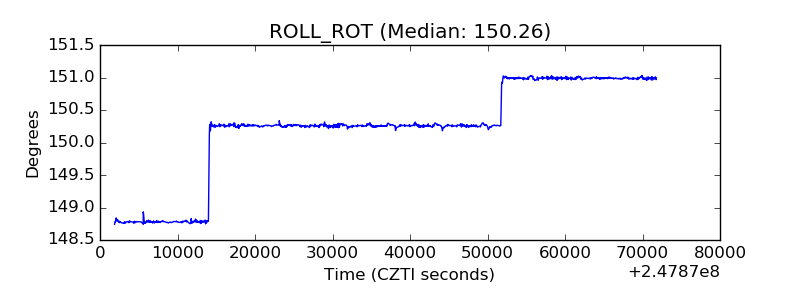 |
| _Roll_DEC | 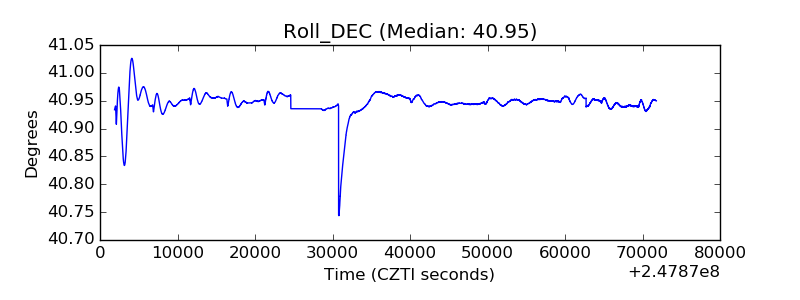 |
| _Roll_RA |  |
| Veto Counter |  |