| Param | Original file | Final file |
|---|---|---|
| Filename | modeM0/AS1A04_021T02_9000001676_11438cztM0_level2.evt | modeM0/AS1A04_021T02_9000001676_11438cztM0_level2_quad_clean.evt |
| Size (bytes) | 383,719,680 | 65,033,280 |
| Size | 365.9 MB | 62.0 MB |
| Events in quadrant A | 2,584,063 | 393,303 |
| Events in quadrant B | 3,644,195 | 384,461 |
| Events in quadrant C | 2,445,856 | 425,591 |
| Events in quadrant D | 2,587,491 | 395,878 |
| Mode M9 | |||
|---|---|---|---|
| Quadrant | BADHDUFLAG | Total packets | Discarded packets |
| A | 0 | 4 | 0 |
| B | 0 | 4 | 0 |
| C | 0 | 4 | 0 |
| D | 0 | 4 | 0 |
| Mode SS | |||
|---|---|---|---|
| Quadrant | BADHDUFLAG | Total packets | Discarded packets |
| A | 0 | 108 | 0 |
| B | 0 | 108 | 0 |
| C | 0 | 108 | 0 |
| D | 0 | 108 | 0 |
| Mode M0 | |||
|---|---|---|---|
| Quadrant | BADHDUFLAG | Total packets | Discarded packets |
| A | 0 | 11240 | 1 |
| B | 0 | 14383 | 0 |
| C | 0 | 10886 | 0 |
| D | 0 | 11484 | 0 |
| Quadrant | Total seconds | Saturated seconds | Saturation percentage |
|---|---|---|---|
| A | 5277 | 38 | 0.720106% |
| B | 5277 | 290 | 5.495547% |
| C | 5277 | 17 | 0.322153% |
| D | 5277 | 32 | 0.606405% |
Noise dominated data is calculated using 1-second bins in cleaned event files. If a bin has >2000 counts, and if more than 50% of those come from <1% of pixels, then it is considered to be noise-dominated and hence unusable.
| Quadrant | # 1 sec bins | Bins with >0 counts | Bins with >2000 counts | High rate bins dominated by noise | Noise dominated (total time) | Noise dominated (detector-on time) | Marked lightcurve |
|---|---|---|---|---|---|---|---|
| A | 5617 | 5278 | 4 | 4 | 0.07% | 0.08% | 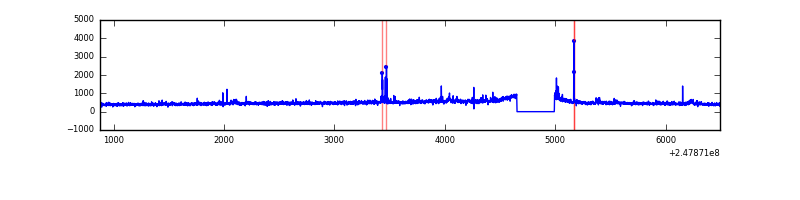 |
| B | 5617 | 5278 | 137 | 137 | 2.44% | 2.60% | 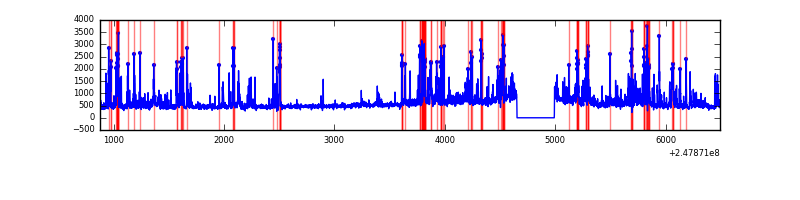 |
| C | 5617 | 5278 | 0 | 0 | 0.00% | 0.00% | 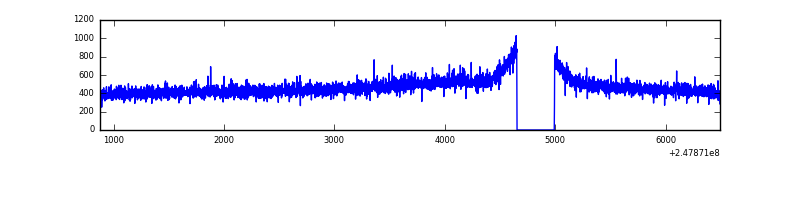 |
| D | 5617 | 5278 | 14 | 14 | 0.25% | 0.27% | 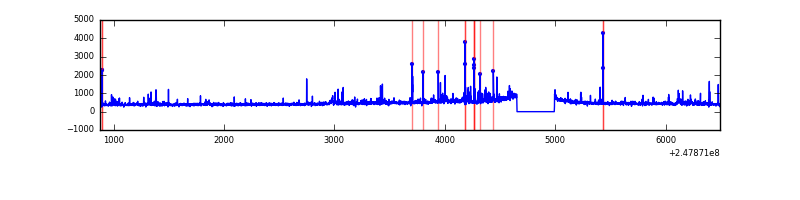 |
Top three noisy pixels from each quadrant. If the there are fewer than three noisy pixels in the level2.evt file, extra rows are filled as -1
| Pixel properties | Quadrant properties | ||||||
|---|---|---|---|---|---|---|---|
| Quadrant | DetID | PixID | Counts | Sigma | Mean | Median | Sigma |
| A | 9 | 143 | 41460 | 313.62 | 630 | 616 | 130.2 |
| A | 1 | 162 | 34843 | 262.81 | 630 | 616 | 130.2 |
| A | 1 | 178 | 19487 | 144.9 | 630 | 616 | 130.2 |
| B | 4 | 239 | 614770 | 5139.08 | 619 | 601 | 119.5 |
| B | 3 | 64 | 190516 | 1589.12 | 619 | 601 | 119.5 |
| B | 10 | 245 | 166420 | 1387.49 | 619 | 601 | 119.5 |
| C | 8 | 128 | 7404 | 46.22 | 623 | 628 | 146.6 |
| C | 13 | 61 | 4600 | 27.09 | 623 | 628 | 146.6 |
| C | 8 | 112 | 4314 | 25.14 | 623 | 628 | 146.6 |
| D | 1 | 52 | 74187 | 488.91 | 616 | 597 | 150.5 |
| D | 10 | 253 | 41318 | 270.54 | 616 | 597 | 150.5 |
| D | 2 | 120 | 31020 | 202.12 | 616 | 597 | 150.5 |
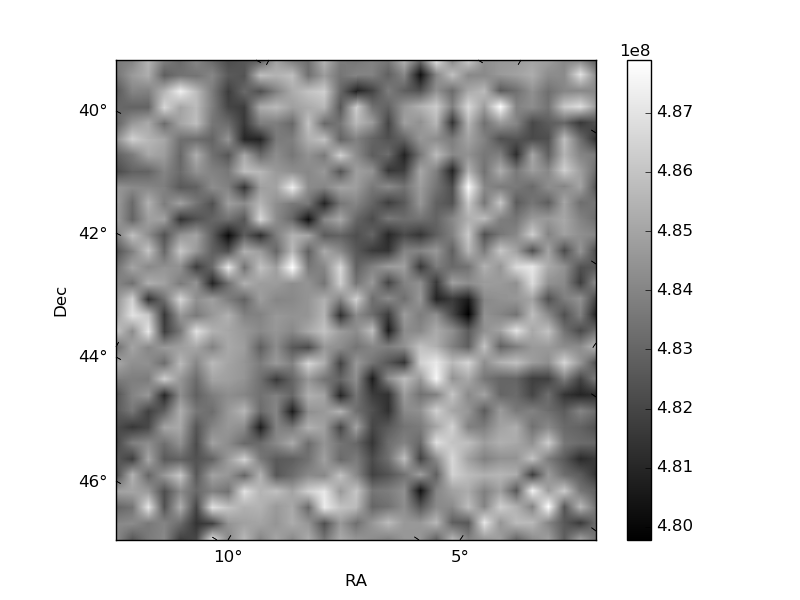
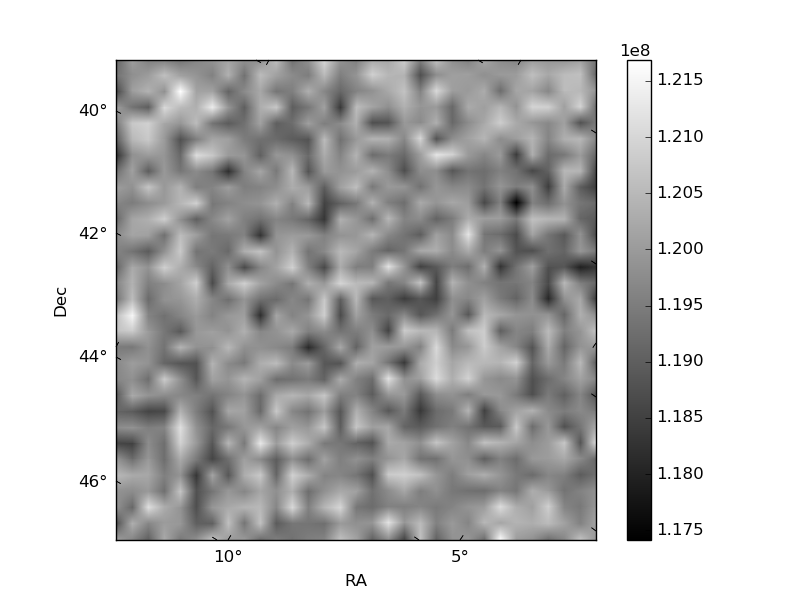
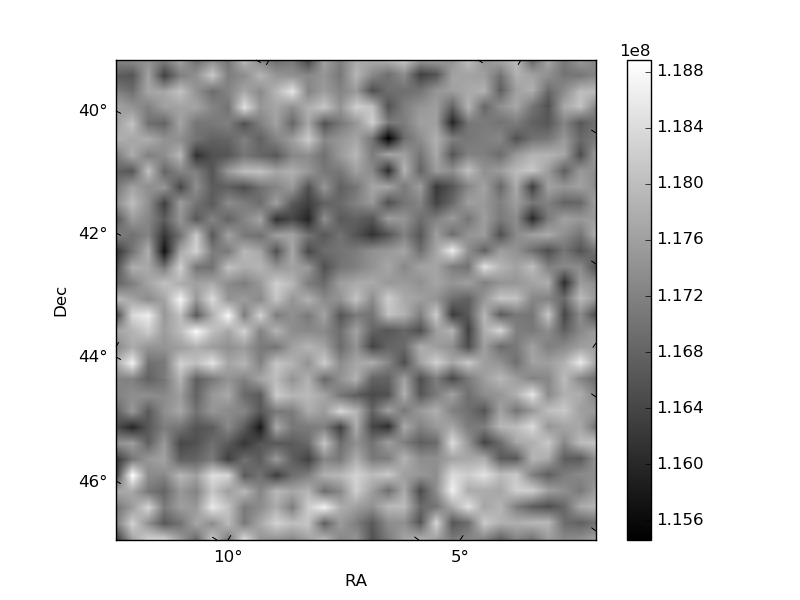
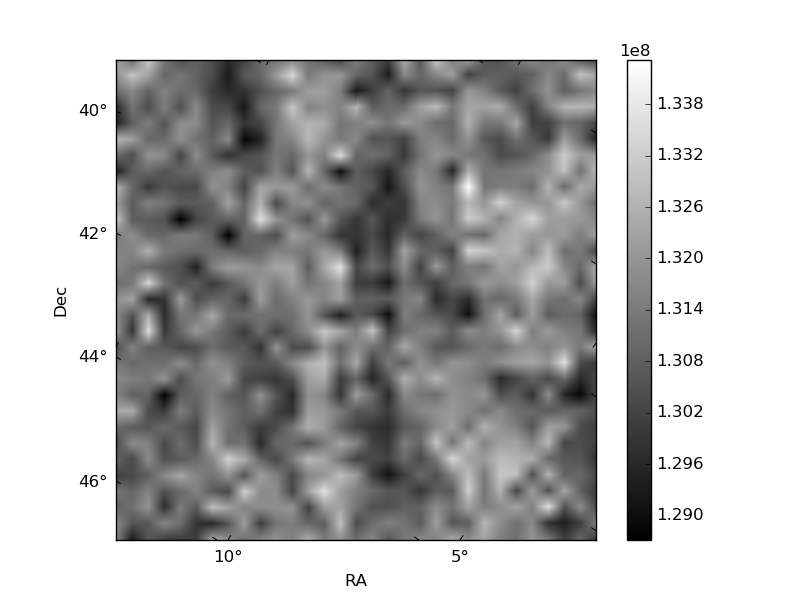
Histogram calculated using DETX and DETY for each event in the final _common_clean file
| Quadrant A | 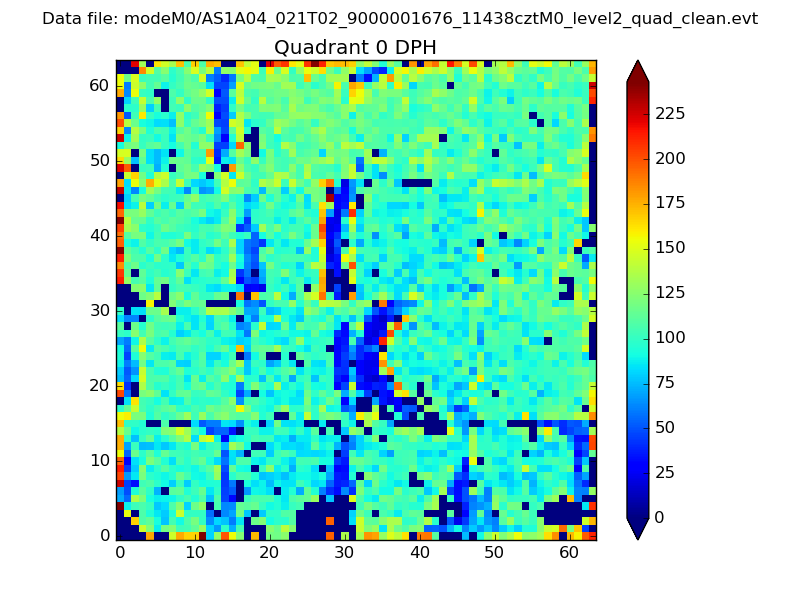 |
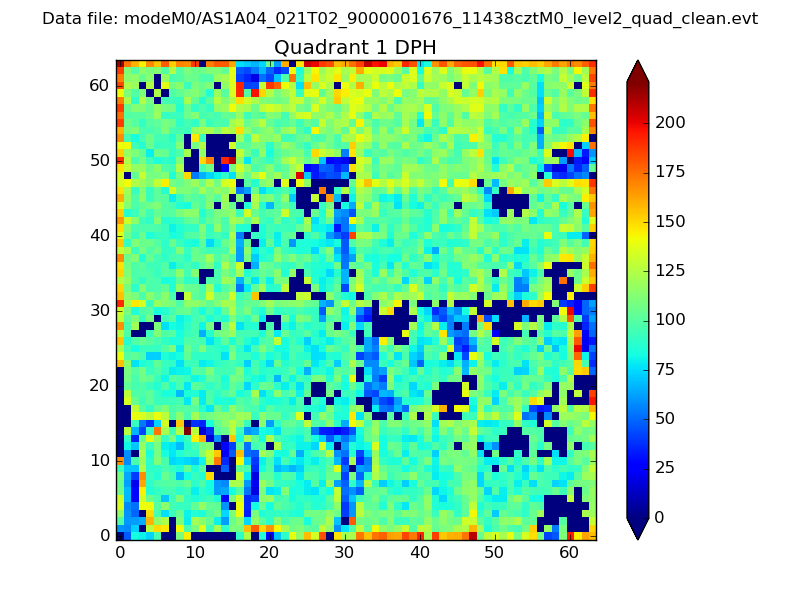 |
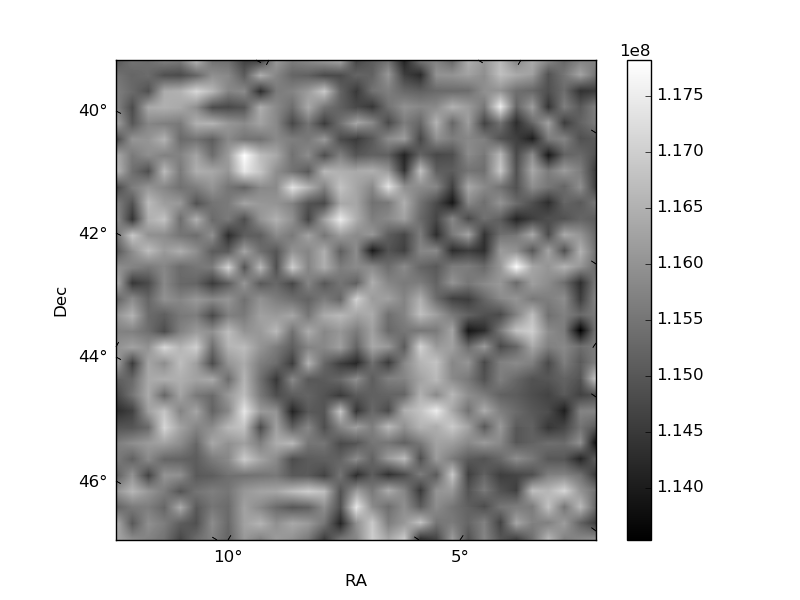
Quadrant B |
|---|---|---|---|
| Quadrant D | 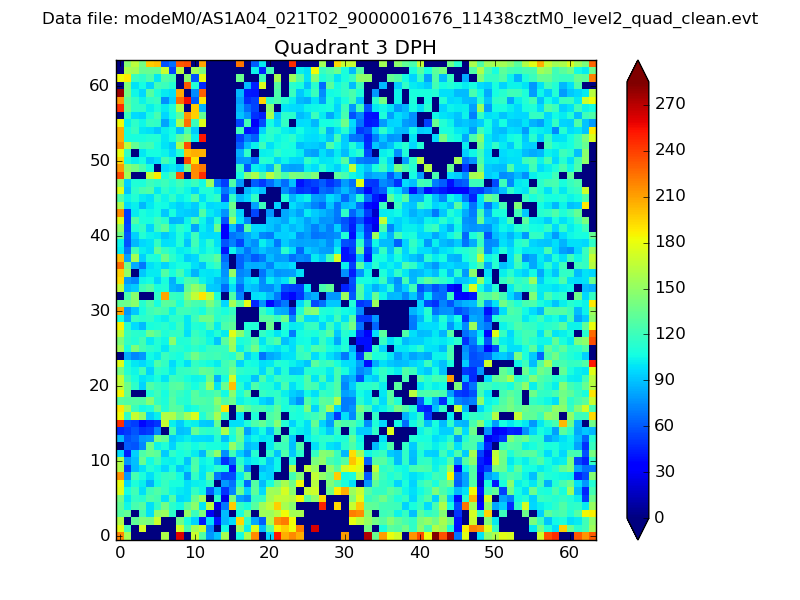 |
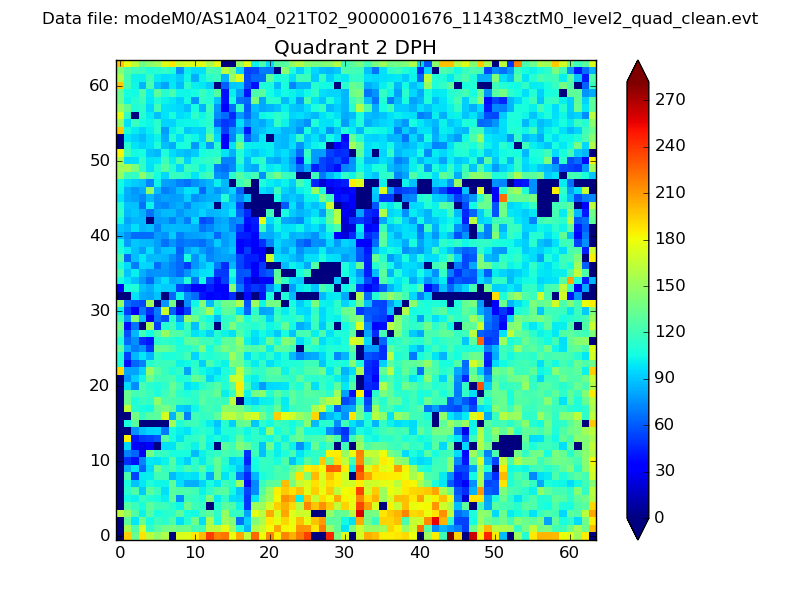 |
Quadrant C |
| Plot type | Count rate plots | Images |
|---|---|---|
| Comparison with Poisson distribution Blue bars denote a histogram of data divided into 1 sec bins. Red curve is a Poisson curve with rate = median count rate of data. |
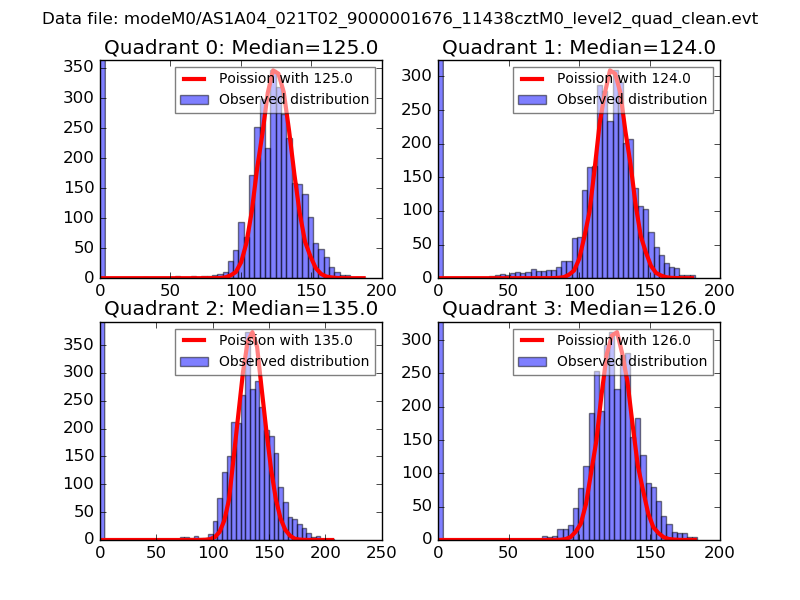 |
 |
| Quadrant-wise count rates Data is divided into 100 sec bins |
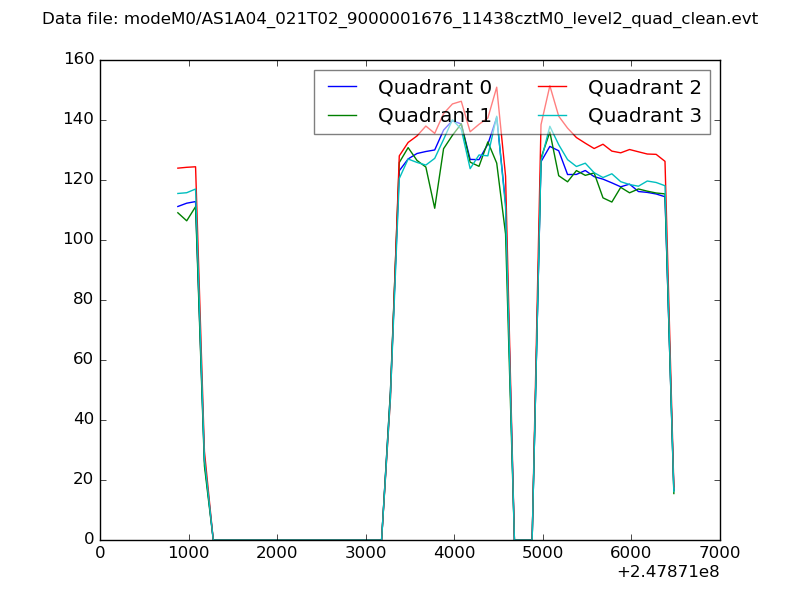 |
|
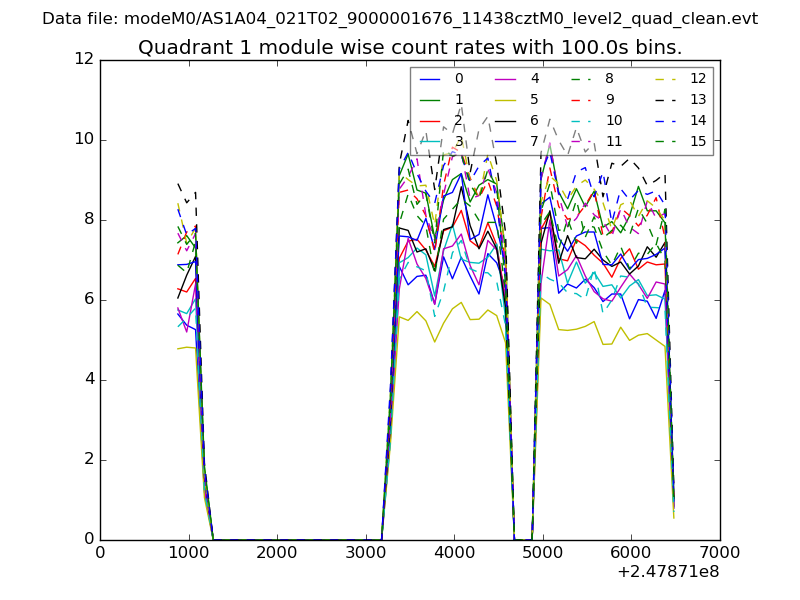
| Module-wise count rates for Quadrant A Data is divided into 100 sec bins |
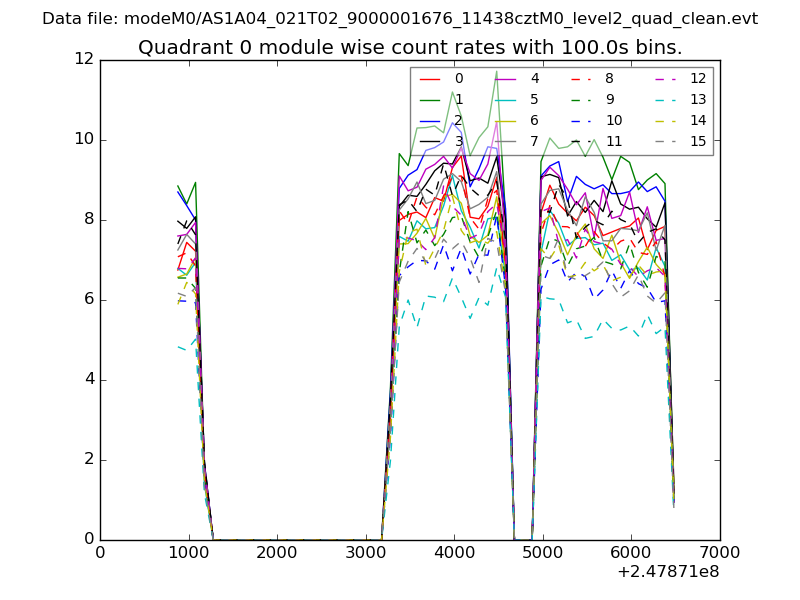 |
 |
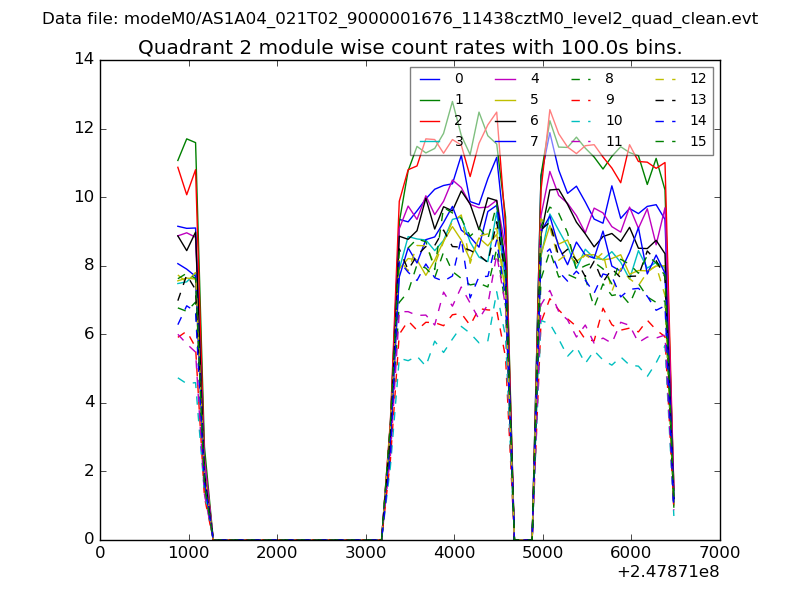
| Module-wise count rates for Quadrant B Data is divided into 100 sec bins |
 |
 |
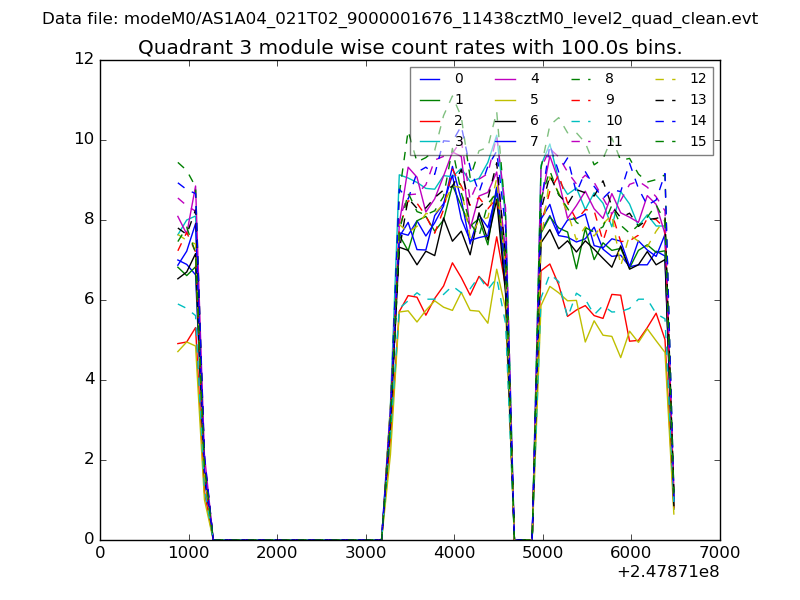
| Module-wise count rates for Quadrant C Data is divided into 100 sec bins |
 |
 |
| Module-wise count rates for Quadrant D Data is divided into 100 sec bins |
 |
 |
| Parameter | Plot |
|---|---|
| CZT HV Monitor | 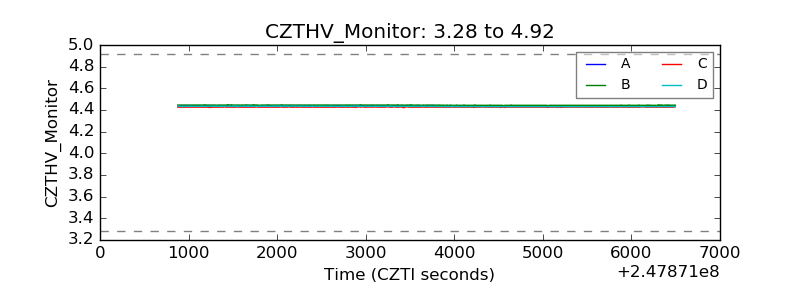 |
| D_VDD | 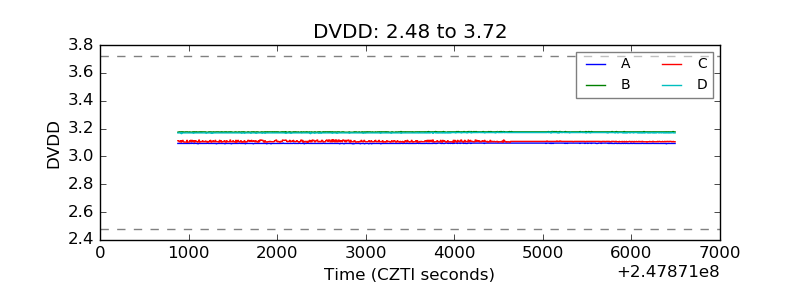 |
| Temperature 1 |  |
| Veto HV Monitor | 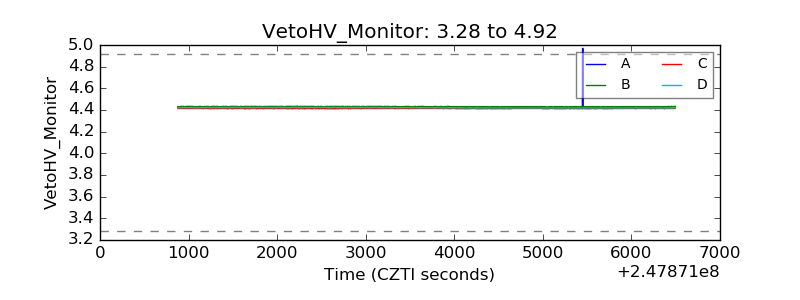 |
| Veto LLD | 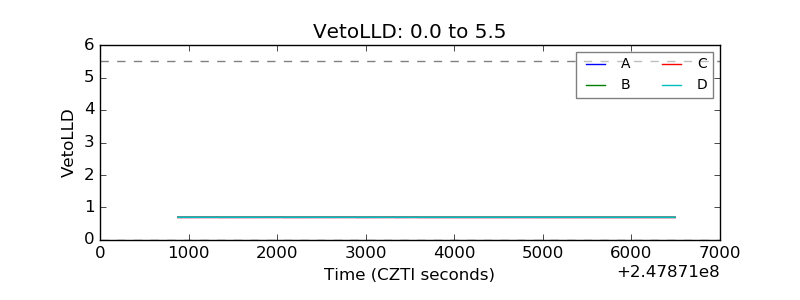 |
| Alpha Counter | 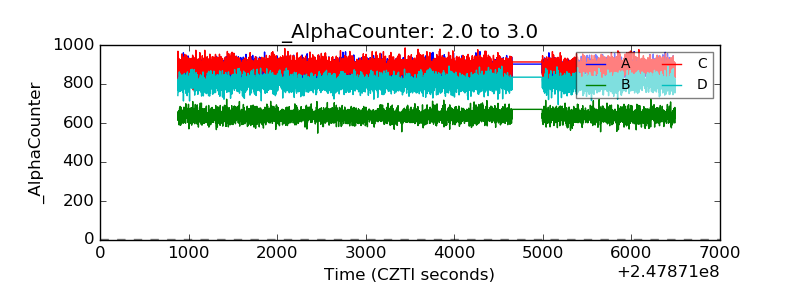 |
| _CPM_Rate | 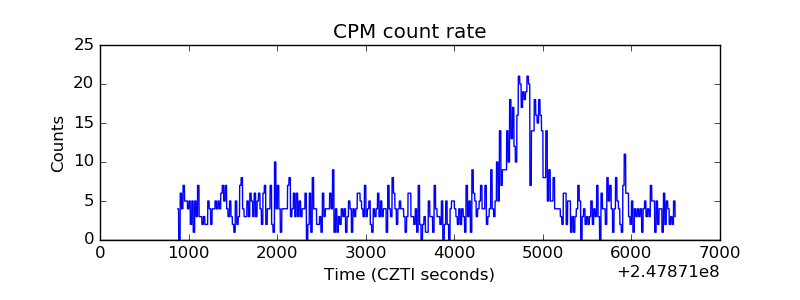 |
| CZT Counter | 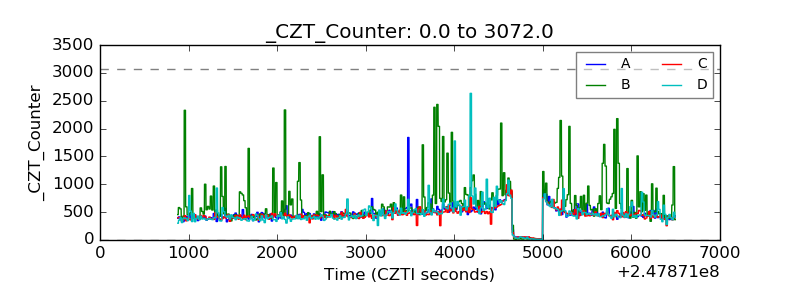 |
| +2.5 Volts monitor |  |
| +5 Volts monitor | 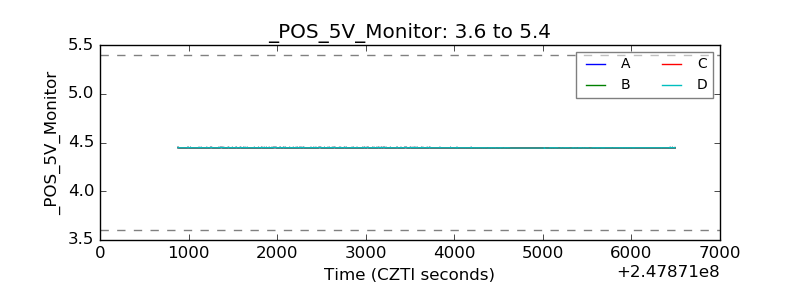 |
| _ROLL_ROT |  |
| _Roll_DEC | 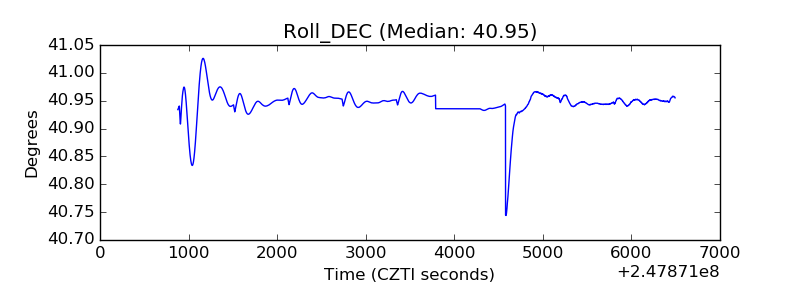 |
| _Roll_RA | 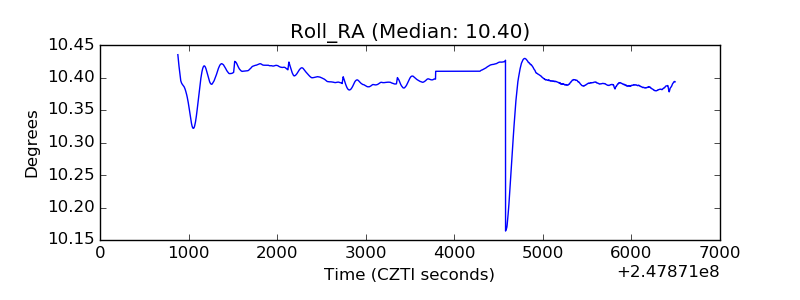 |
| Veto Counter | 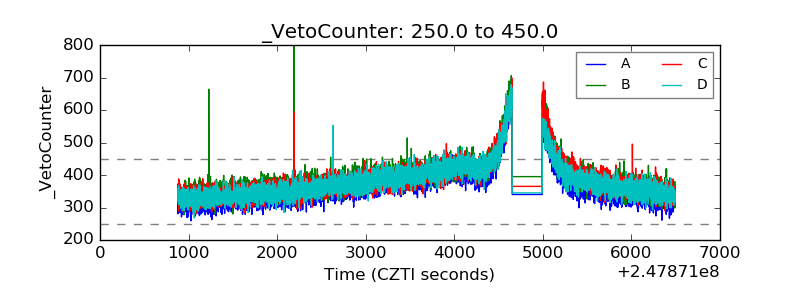 |