| Param | Original file | Final file |
|---|---|---|
| Filename | modeM0/AS1A04_021T02_9000001676_11439cztM0_level2.evt | modeM0/AS1A04_021T02_9000001676_11439cztM0_level2_quad_clean.evt |
| Size (bytes) | 579,994,560 | 111,150,720 |
| Size | 553.1 MB | 106.0 MB |
| Events in quadrant A | 3,660,883 | 697,004 |
| Events in quadrant B | 5,387,432 | 679,314 |
| Events in quadrant C | 3,581,061 | 755,336 |
| Events in quadrant D | 4,410,551 | 695,857 |
| Mode M9 | |||
|---|---|---|---|
| Quadrant | BADHDUFLAG | Total packets | Discarded packets |
| A | 0 | 5 | 0 |
| B | 0 | 5 | 0 |
| C | 0 | 5 | 0 |
| D | 0 | 5 | 0 |
| Mode SS | |||
|---|---|---|---|
| Quadrant | BADHDUFLAG | Total packets | Discarded packets |
| A | 0 | 156 | 0 |
| B | 0 | 156 | 0 |
| C | 0 | 156 | 0 |
| D | 0 | 156 | 0 |
| Mode M0 | |||
|---|---|---|---|
| Quadrant | BADHDUFLAG | Total packets | Discarded packets |
| A | 0 | 16260 | 3 |
| B | 0 | 21270 | 2 |
| C | 0 | 16072 | 2 |
| D | 0 | 18638 | 2 |
| Quadrant | Total seconds | Saturated seconds | Saturation percentage |
|---|---|---|---|
| A | 7755 | 55 | 0.709220% |
| B | 7755 | 487 | 6.279819% |
| C | 7755 | 40 | 0.515796% |
| D | 7755 | 185 | 2.385558% |
Noise dominated data is calculated using 1-second bins in cleaned event files. If a bin has >2000 counts, and if more than 50% of those come from <1% of pixels, then it is considered to be noise-dominated and hence unusable.
| Quadrant | # 1 sec bins | Bins with >0 counts | Bins with >2000 counts | High rate bins dominated by noise | Noise dominated (total time) | Noise dominated (detector-on time) | Marked lightcurve |
|---|---|---|---|---|---|---|---|
| A | 8175 | 7759 | 2 | 2 | 0.02% | 0.03% | 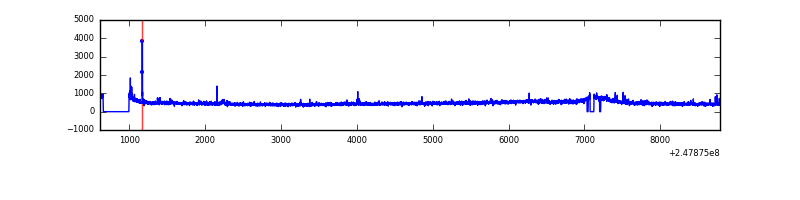 |
| B | 8175 | 7759 | 202 | 202 | 2.47% | 2.60% | 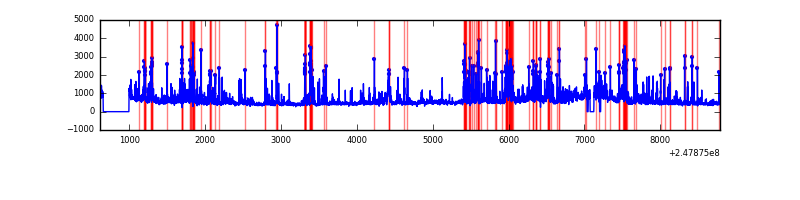 |
| C | 8175 | 7759 | 1 | 1 | 0.01% | 0.01% | 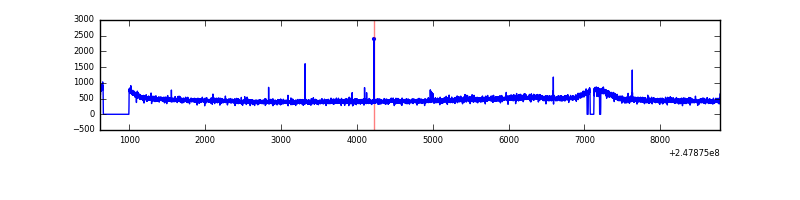 |
| D | 8175 | 7759 | 100 | 100 | 1.22% | 1.29% | 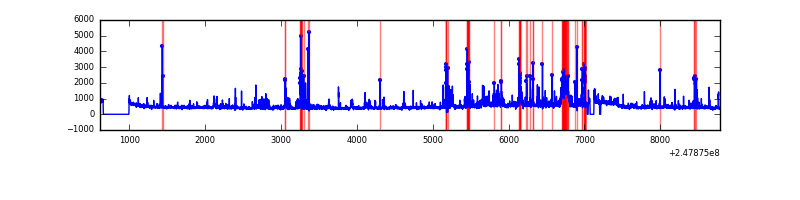 |
Top three noisy pixels from each quadrant. If the there are fewer than three noisy pixels in the level2.evt file, extra rows are filled as -1
| Pixel properties | Quadrant properties | ||||||
|---|---|---|---|---|---|---|---|
| Quadrant | DetID | PixID | Counts | Sigma | Mean | Median | Sigma |
| A | 1 | 162 | 38242 | 200.54 | 910 | 888 | 186.3 |
| A | 1 | 178 | 22478 | 115.91 | 910 | 888 | 186.3 |
| A | 13 | 251 | 22219 | 114.52 | 910 | 888 | 186.3 |
| B | 4 | 239 | 1059136 | 6205.17 | 898 | 875 | 170.5 |
| B | 3 | 64 | 359670 | 2103.81 | 898 | 875 | 170.5 |
| B | 15 | 204 | 161439 | 941.48 | 898 | 875 | 170.5 |
| C | 14 | 234 | 9852 | 41.84 | 914 | 918 | 213.5 |
| C | 13 | 61 | 6713 | 27.14 | 914 | 918 | 213.5 |
| C | 12 | 4 | 6001 | 23.8 | 914 | 918 | 213.5 |
| D | 1 | 52 | 317242 | 1353.49 | 887 | 868 | 233.7 |
| D | 13 | 152 | 218915 | 932.84 | 887 | 868 | 233.7 |
| D | 10 | 253 | 113886 | 483.51 | 887 | 868 | 233.7 |
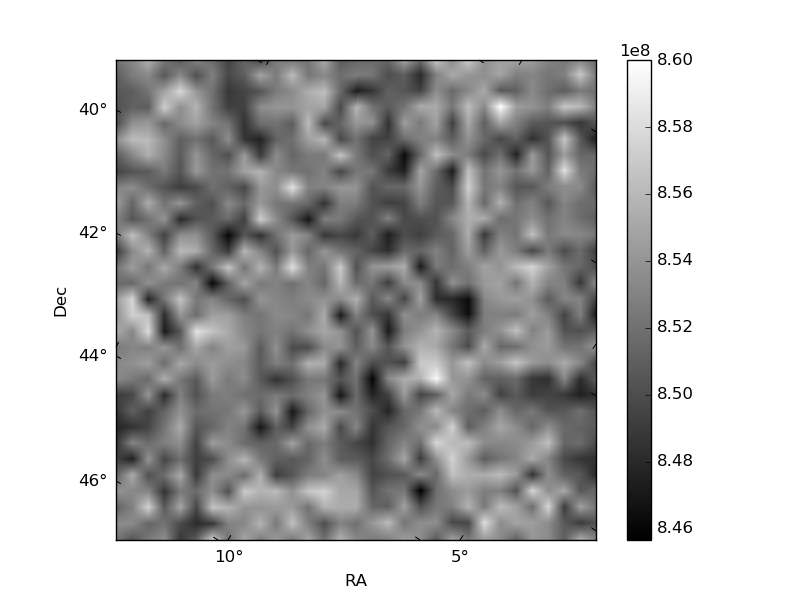
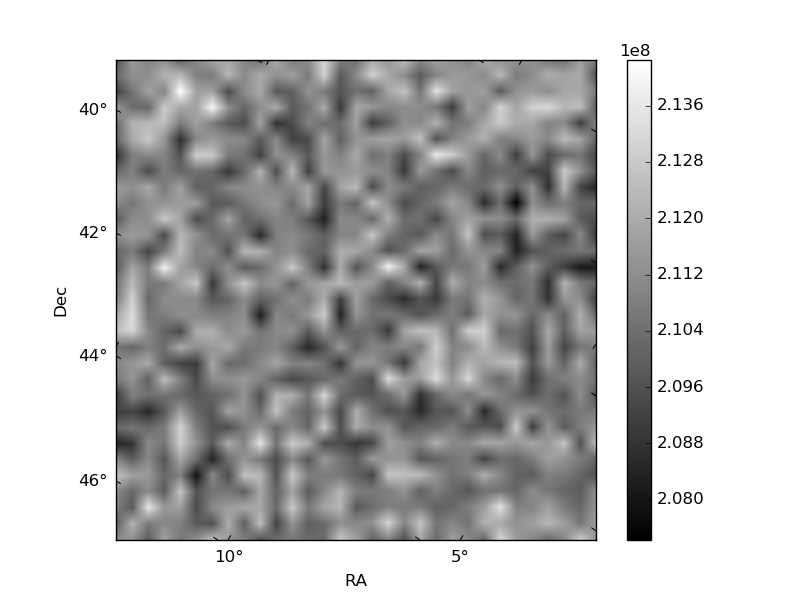
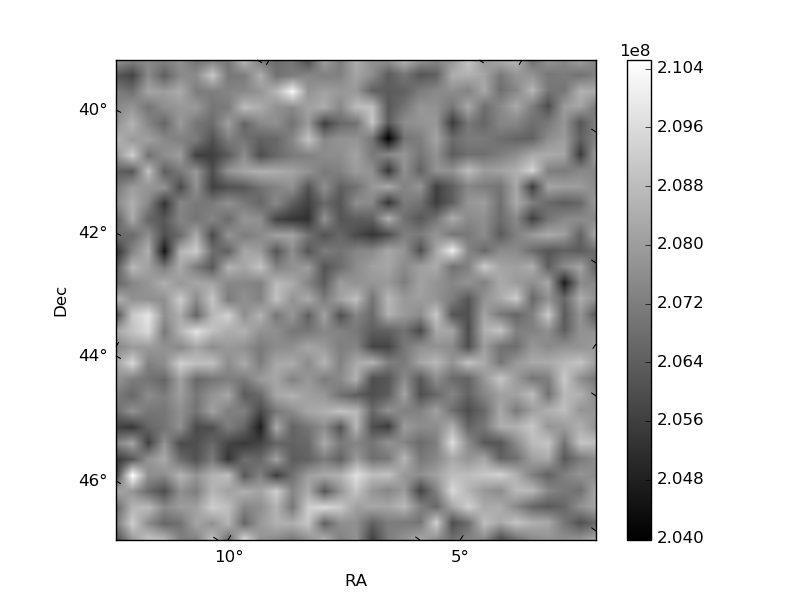
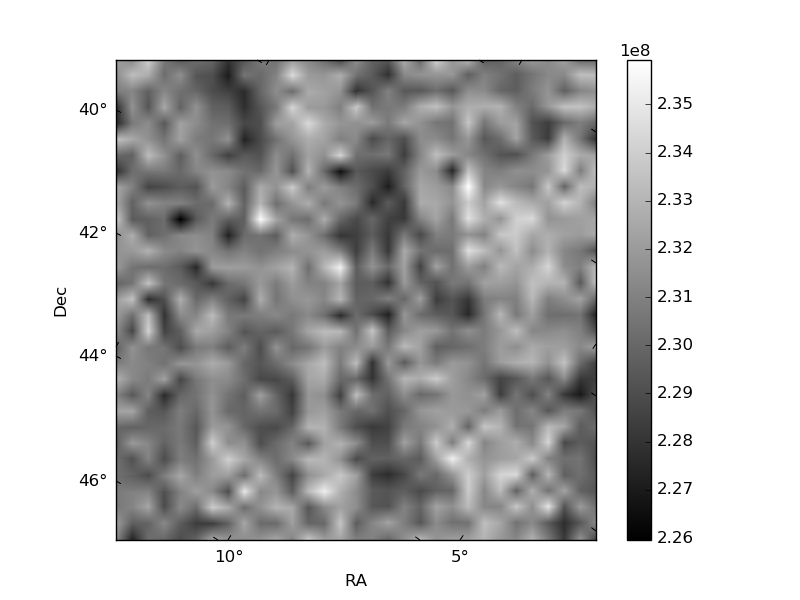
Histogram calculated using DETX and DETY for each event in the final _common_clean file
| Quadrant A | 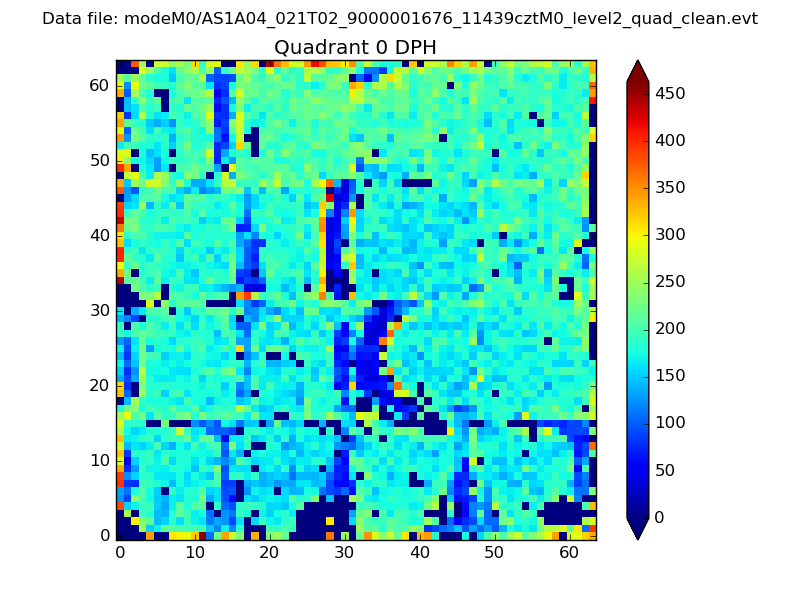 |
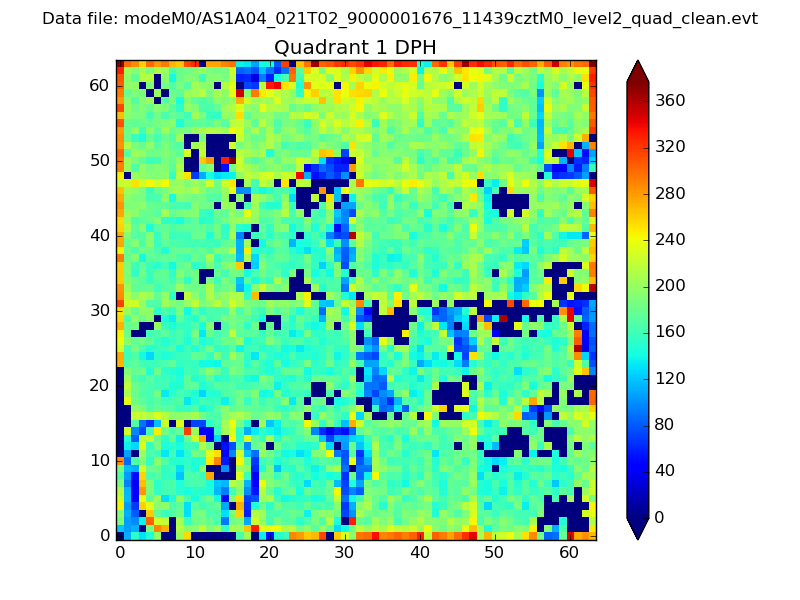 |
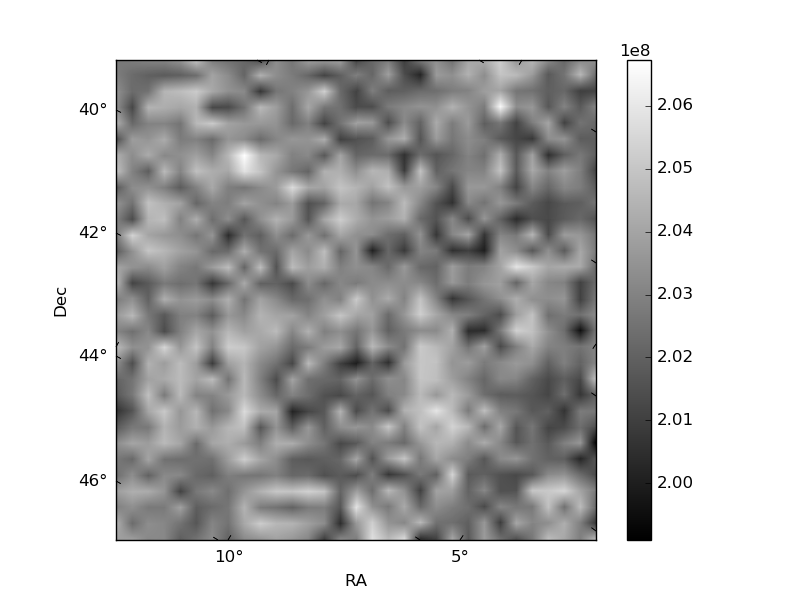
Quadrant B |
|---|---|---|---|
| Quadrant D | 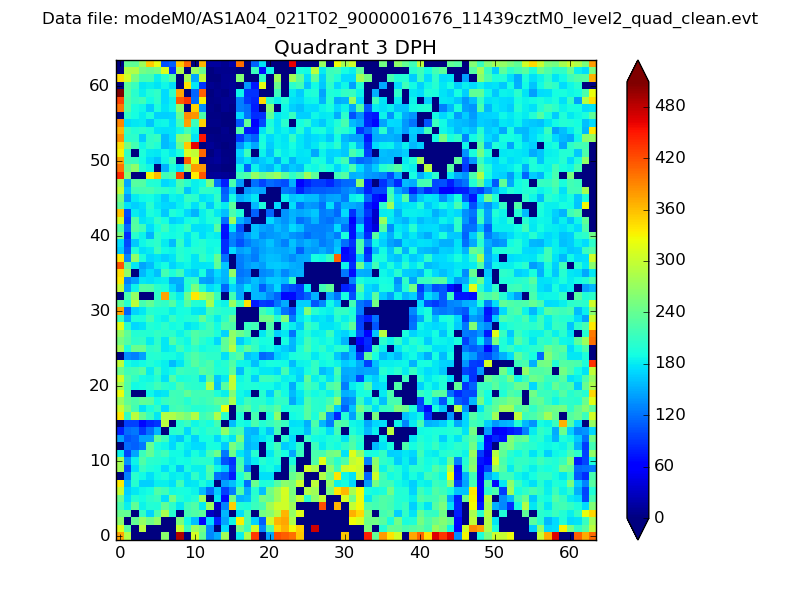 |
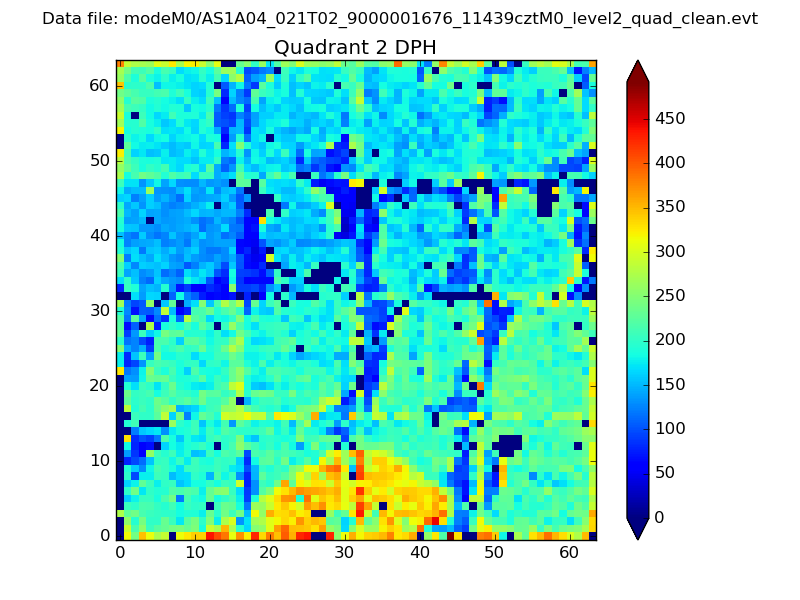 |
Quadrant C |
| Plot type | Count rate plots | Images |
|---|---|---|
| Comparison with Poisson distribution Blue bars denote a histogram of data divided into 1 sec bins. Red curve is a Poisson curve with rate = median count rate of data. |
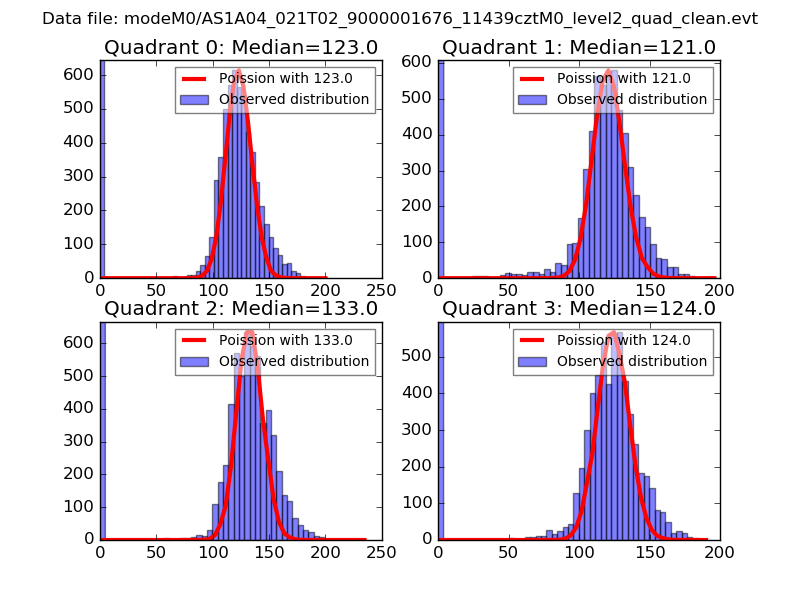 |
 |
| Quadrant-wise count rates Data is divided into 100 sec bins |
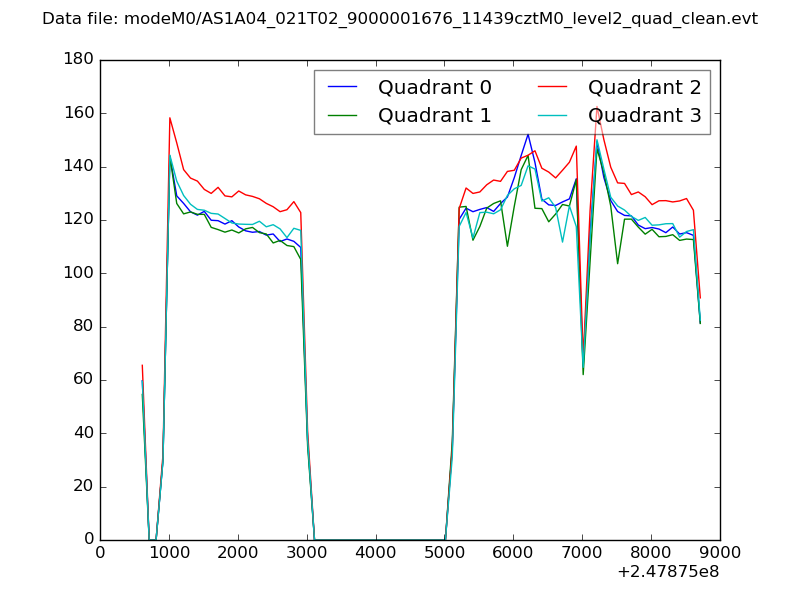 |
|
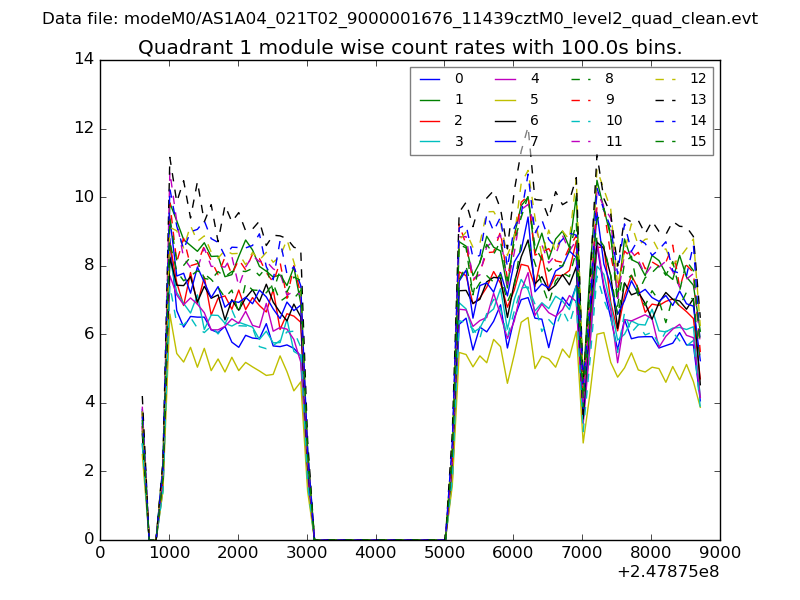
| Module-wise count rates for Quadrant A Data is divided into 100 sec bins |
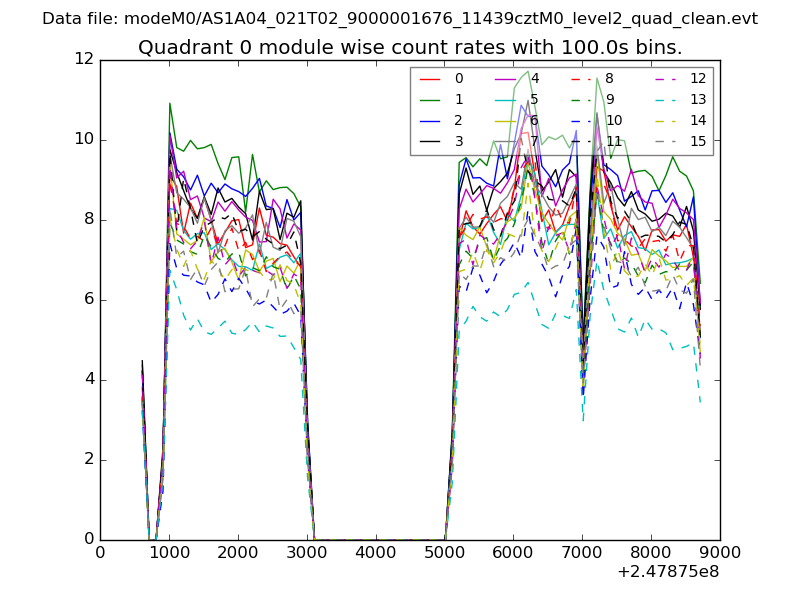 |
 |
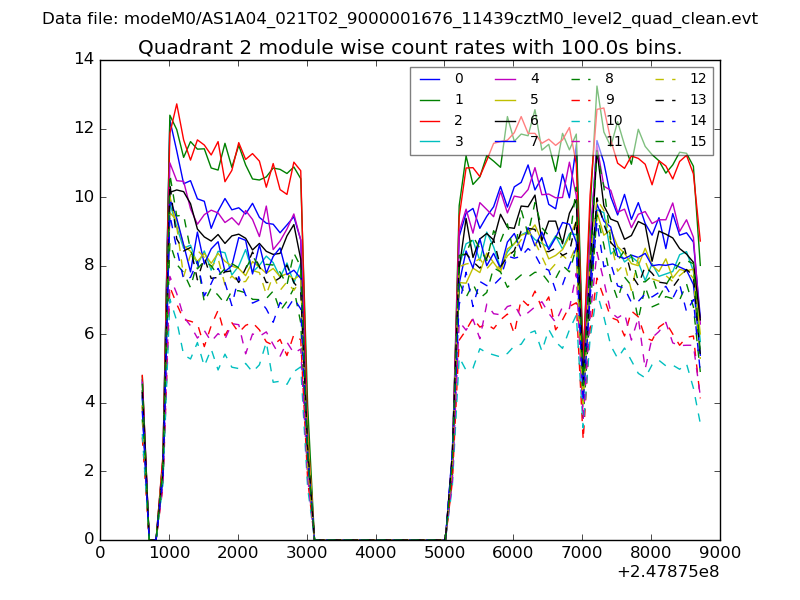
| Module-wise count rates for Quadrant B Data is divided into 100 sec bins |
 |
 |
| Module-wise count rates for Quadrant C Data is divided into 100 sec bins |
 |
 |
| Module-wise count rates for Quadrant D Data is divided into 100 sec bins |
 |
 |
| Parameter | Plot |
|---|---|
| CZT HV Monitor | 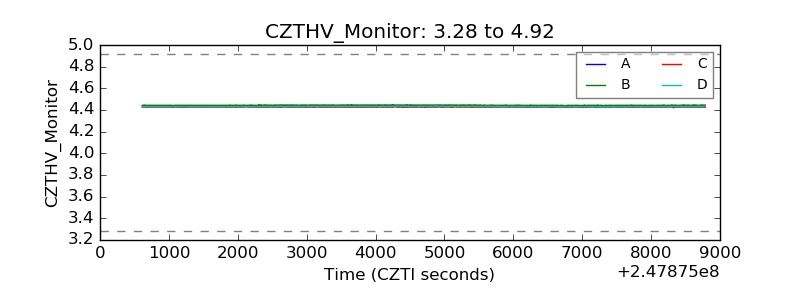 |
| D_VDD | 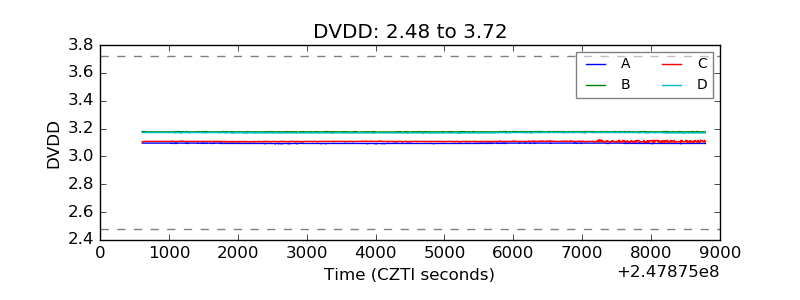 |
| Temperature 1 |  |
| Veto HV Monitor | 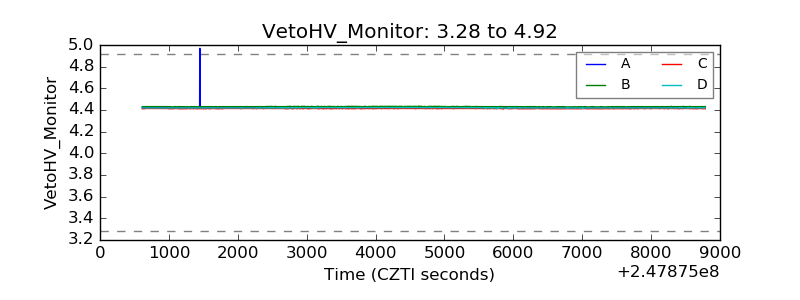 |
| Veto LLD | 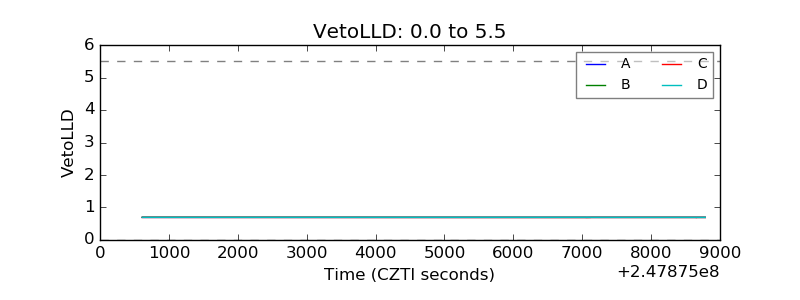 |
| Alpha Counter | 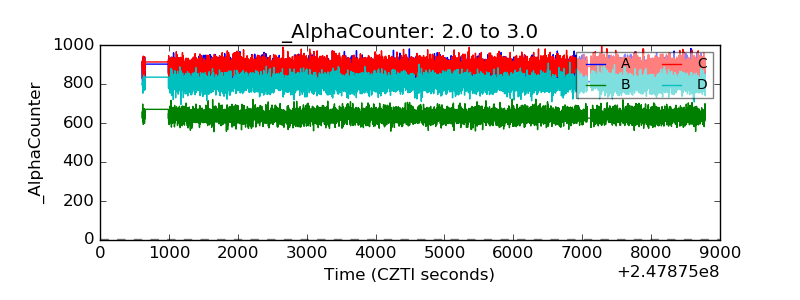 |
| _CPM_Rate | 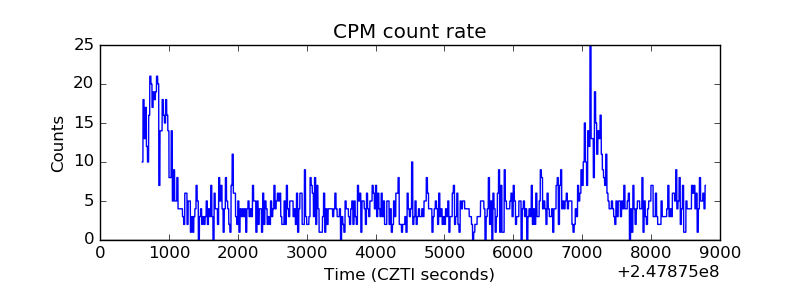 |
| CZT Counter | 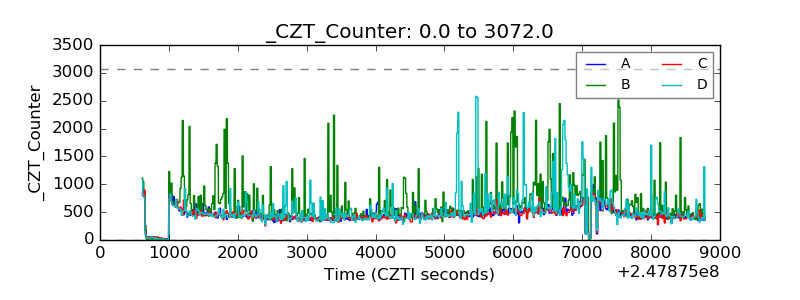 |
| +2.5 Volts monitor |  |
| +5 Volts monitor |  |
| _ROLL_ROT |  |
| _Roll_DEC | 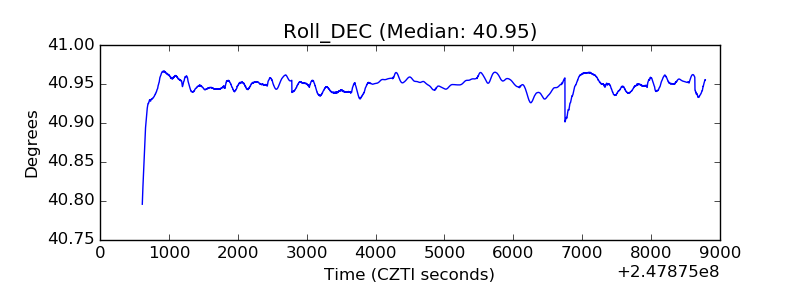 |
| _Roll_RA | 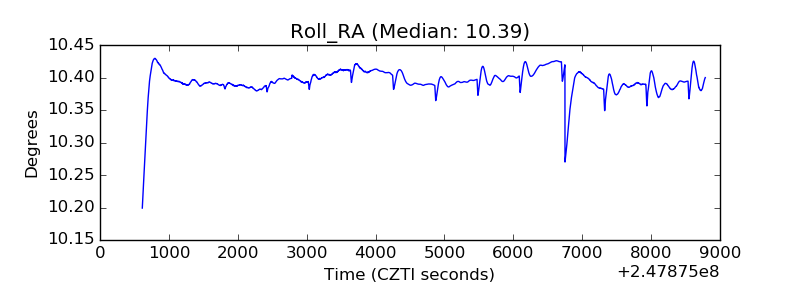 |
| Veto Counter | 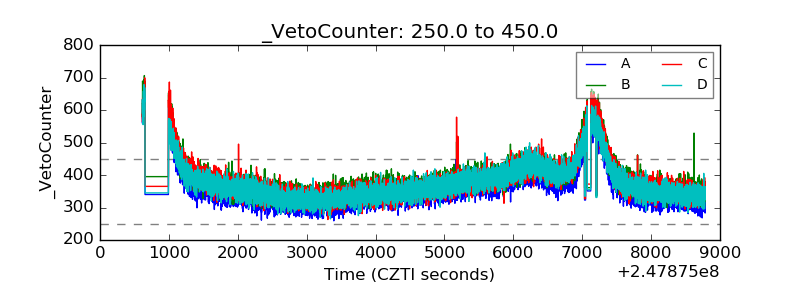 |