| Param | Original file | Final file |
|---|---|---|
| Filename | modeM0/AS1A04_021T02_9000001676_11440cztM0_level2.evt | modeM0/AS1A04_021T02_9000001676_11440cztM0_level2_quad_clean.evt |
| Size (bytes) | 649,797,120 | 121,060,800 |
| Size | 619.7 MB | 115.5 MB |
| Events in quadrant A | 4,238,600 | 757,230 |
| Events in quadrant B | 5,810,532 | 734,813 |
| Events in quadrant C | 4,050,694 | 817,643 |
| Events in quadrant D | 4,988,963 | 751,987 |
| Mode M9 | |||
|---|---|---|---|
| Quadrant | BADHDUFLAG | Total packets | Discarded packets |
| A | 0 | 3 | 0 |
| B | 0 | 3 | 0 |
| C | 0 | 3 | 0 |
| D | 0 | 3 | 0 |
| Mode SS | |||
|---|---|---|---|
| Quadrant | BADHDUFLAG | Total packets | Discarded packets |
| A | 0 | 180 | 0 |
| B | 0 | 180 | 0 |
| C | 0 | 180 | 0 |
| D | 0 | 180 | 0 |
| Mode M0 | |||
|---|---|---|---|
| Quadrant | BADHDUFLAG | Total packets | Discarded packets |
| A | 0 | 18352 | 4 |
| B | 0 | 23261 | 3 |
| C | 0 | 18027 | 3 |
| D | 0 | 20959 | 3 |
| Quadrant | Total seconds | Saturated seconds | Saturation percentage |
|---|---|---|---|
| A | 8703 | 53 | 0.608985% |
| B | 8703 | 508 | 5.837068% |
| C | 8703 | 37 | 0.425141% |
| D | 8703 | 227 | 2.608296% |
Noise dominated data is calculated using 1-second bins in cleaned event files. If a bin has >2000 counts, and if more than 50% of those come from <1% of pixels, then it is considered to be noise-dominated and hence unusable.
| Quadrant | # 1 sec bins | Bins with >0 counts | Bins with >2000 counts | High rate bins dominated by noise | Noise dominated (total time) | Noise dominated (detector-on time) | Marked lightcurve |
|---|---|---|---|---|---|---|---|
| A | 9068 | 8707 | 1 | 1 | 0.01% | 0.01% | 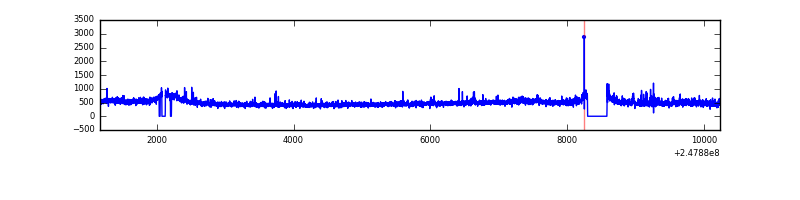 |
| B | 9068 | 8707 | 228 | 228 | 2.51% | 2.62% | 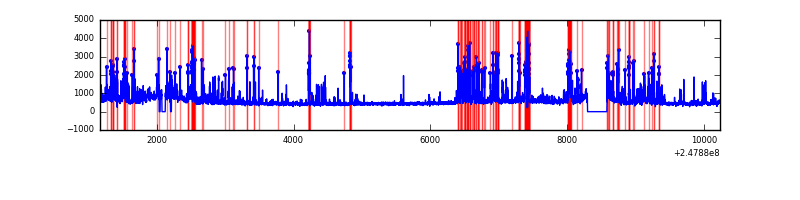 |
| C | 9068 | 8707 | 0 | 0 | 0.00% | 0.00% | 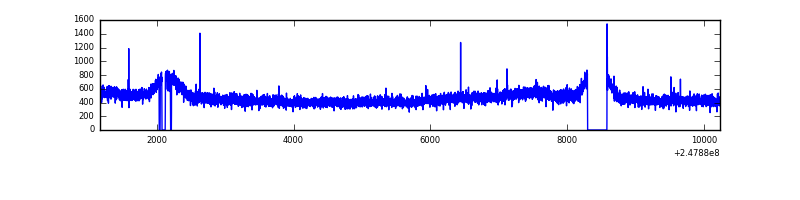 |
| D | 9068 | 8707 | 137 | 137 | 1.51% | 1.57% | 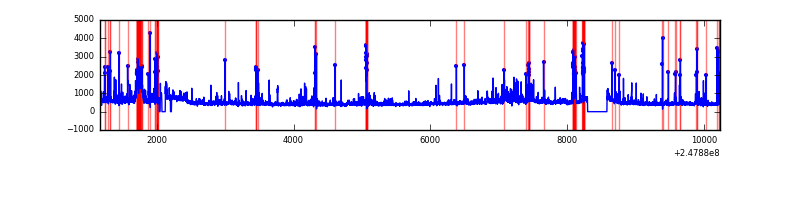 |
Top three noisy pixels from each quadrant. If the there are fewer than three noisy pixels in the level2.evt file, extra rows are filled as -1
| Pixel properties | Quadrant properties | ||||||
|---|---|---|---|---|---|---|---|
| Quadrant | DetID | PixID | Counts | Sigma | Mean | Median | Sigma |
| A | 1 | 162 | 89094 | 420.34 | 1028 | 1002 | 209.6 |
| A | 1 | 178 | 54761 | 256.52 | 1028 | 1002 | 209.6 |
| A | 1 | 161 | 45787 | 213.7 | 1028 | 1002 | 209.6 |
| B | 4 | 239 | 1082840 | 5572.89 | 1012 | 985 | 194.1 |
| B | 3 | 64 | 265827 | 1364.26 | 1012 | 985 | 194.1 |
| B | 15 | 204 | 126646 | 647.31 | 1012 | 985 | 194.1 |
| C | 8 | 128 | 10479 | 39.27 | 1031 | 1038 | 240.4 |
| C | 13 | 61 | 7568 | 27.16 | 1031 | 1038 | 240.4 |
| C | 12 | 4 | 7532 | 27.01 | 1031 | 1038 | 240.4 |
| D | 1 | 52 | 323712 | 1327.67 | 1009 | 982 | 243.1 |
| D | 13 | 152 | 249267 | 1021.41 | 1009 | 982 | 243.1 |
| D | 9 | 85 | 141322 | 577.34 | 1009 | 982 | 243.1 |
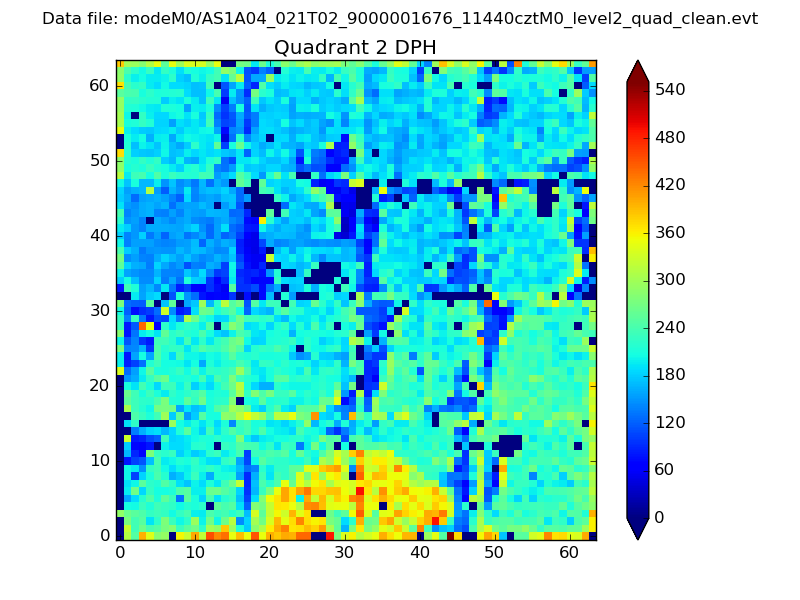
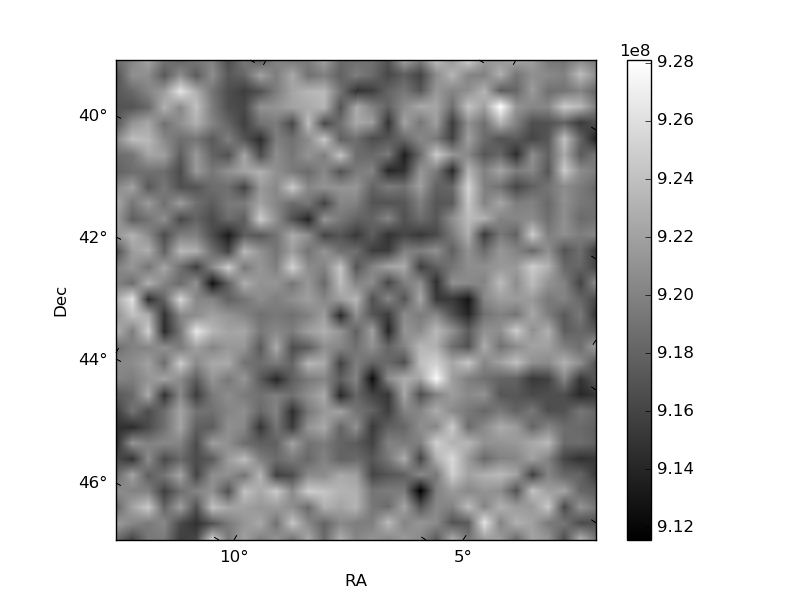
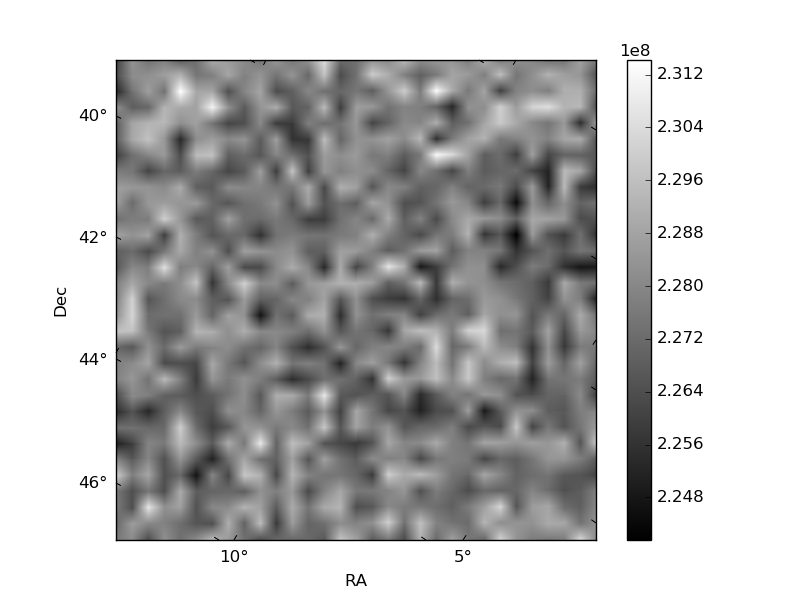
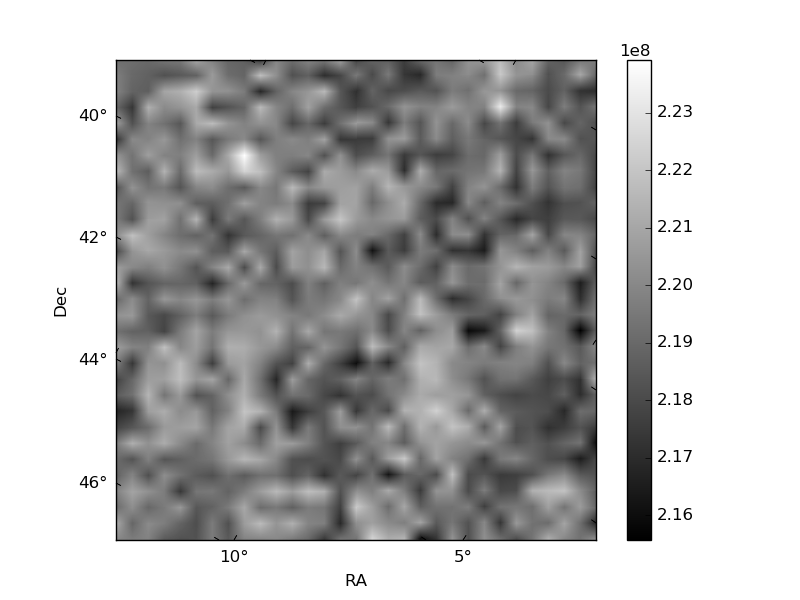
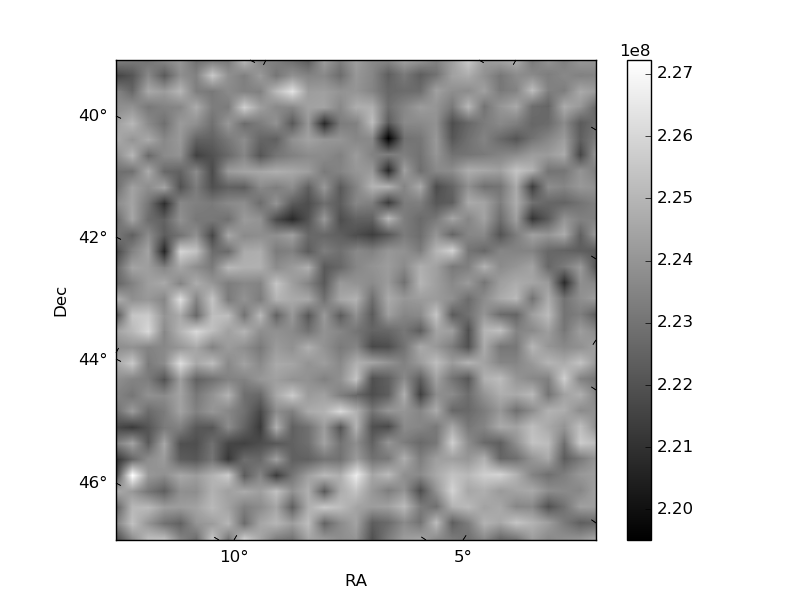
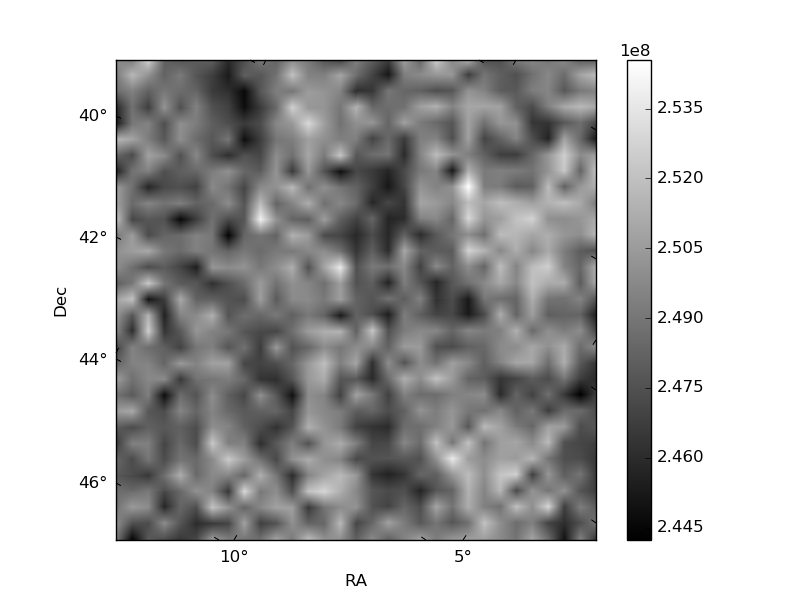
Histogram calculated using DETX and DETY for each event in the final _common_clean file
| Quadrant A | 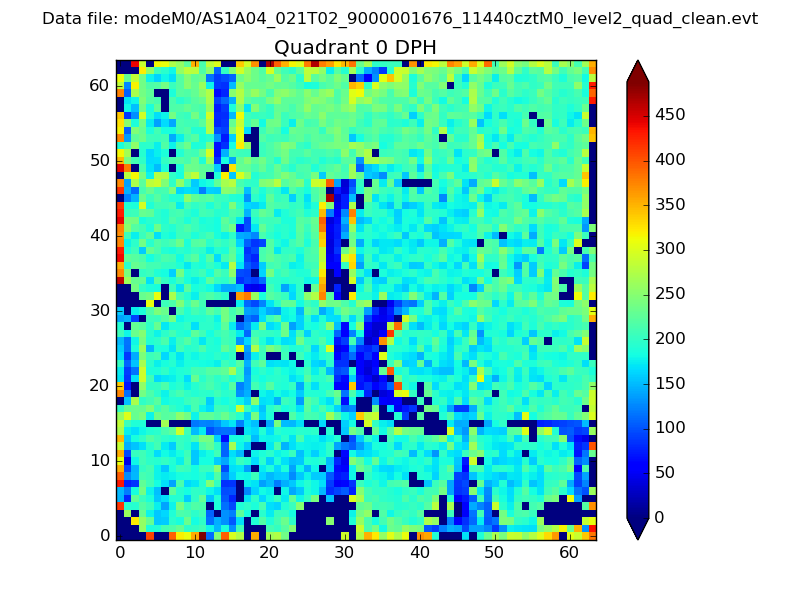 |
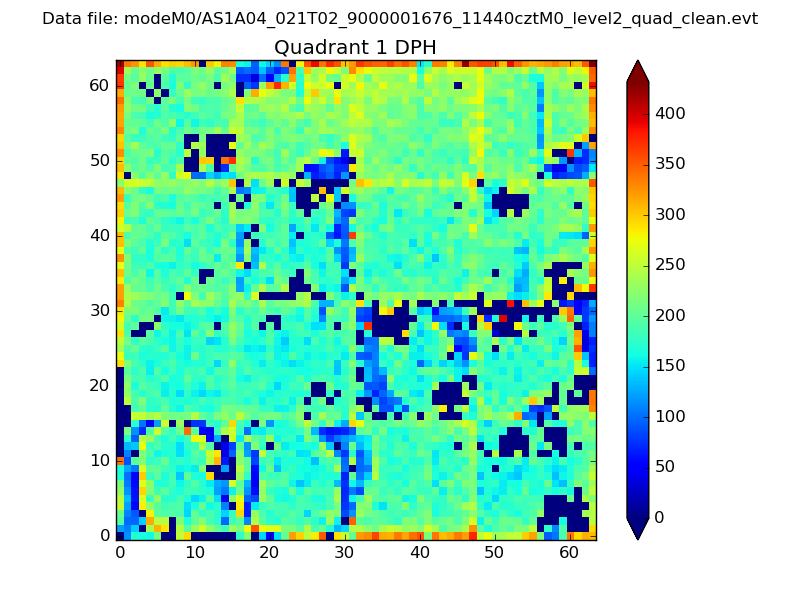 |
Quadrant B |
|---|---|---|---|
| Quadrant D | 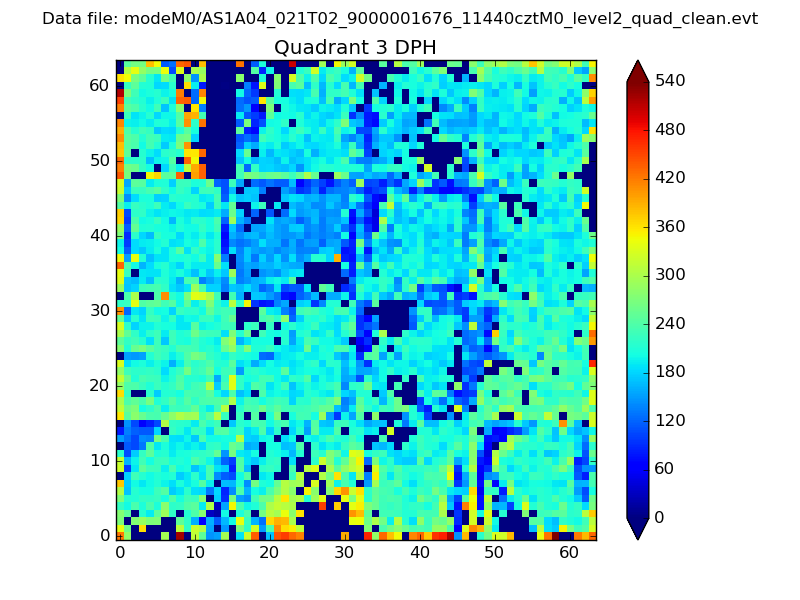 |
 |
Quadrant C |
| Plot type | Count rate plots | Images |
|---|---|---|
| Comparison with Poisson distribution Blue bars denote a histogram of data divided into 1 sec bins. Red curve is a Poisson curve with rate = median count rate of data. |
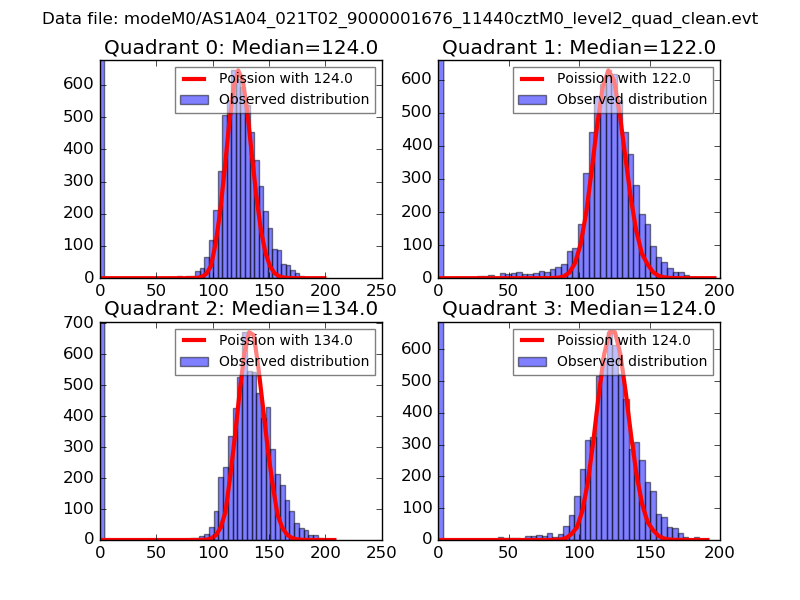 |
 |
| Quadrant-wise count rates Data is divided into 100 sec bins |
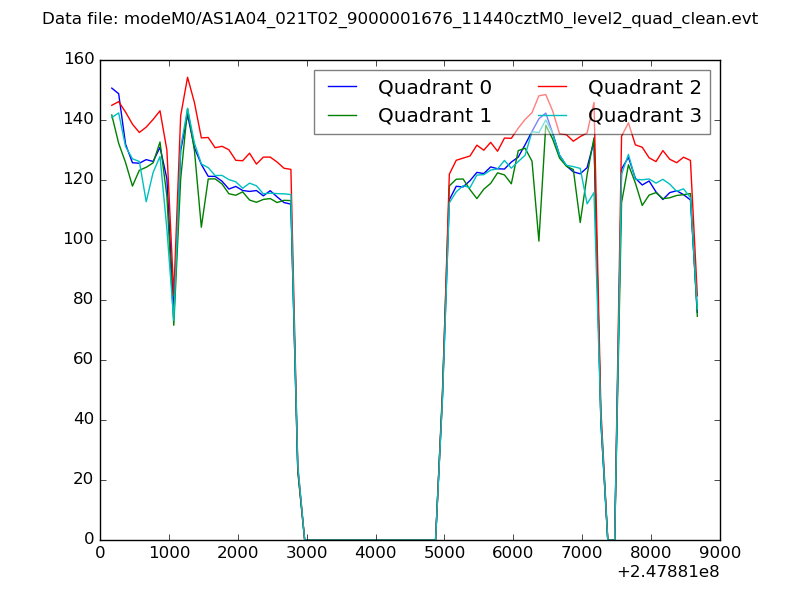 |
|
| Module-wise count rates for Quadrant A Data is divided into 100 sec bins |
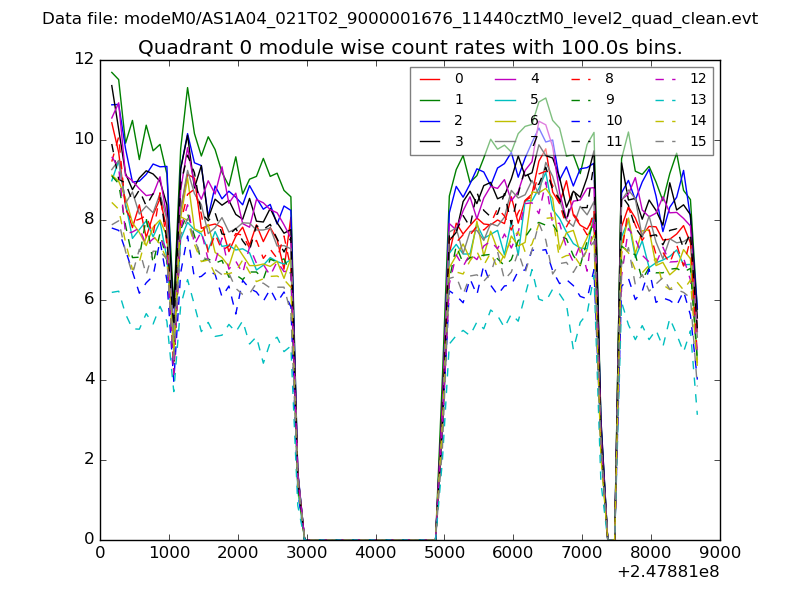 |
 |
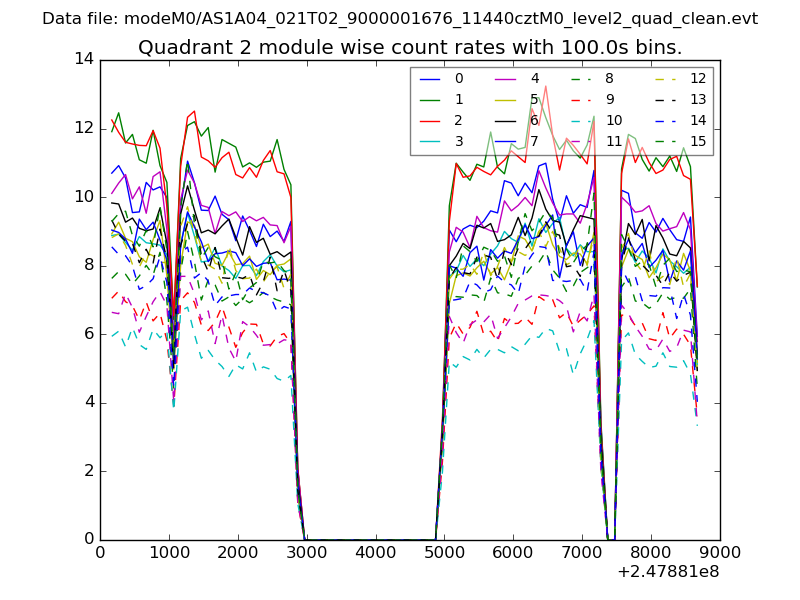
| Module-wise count rates for Quadrant B Data is divided into 100 sec bins |
 |
 |
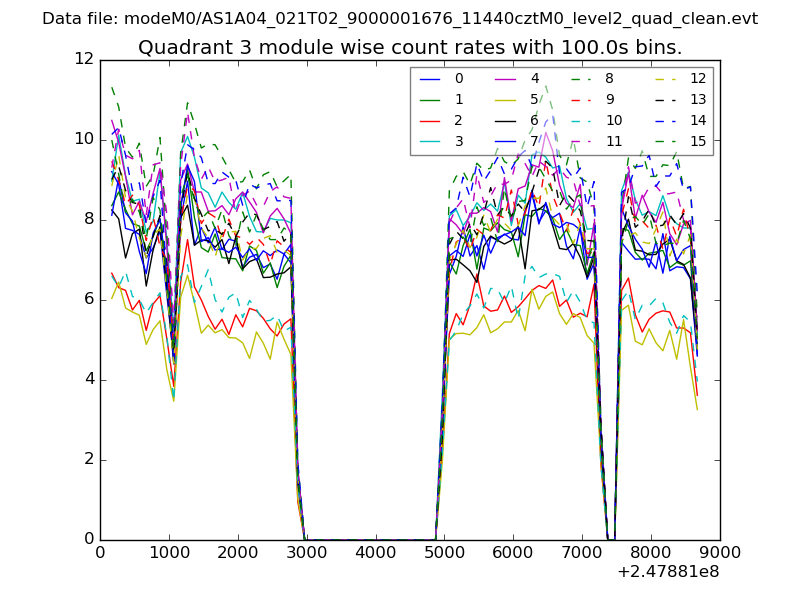
| Module-wise count rates for Quadrant C Data is divided into 100 sec bins |
 |
 |
| Module-wise count rates for Quadrant D Data is divided into 100 sec bins |
 |
 |
| Parameter | Plot |
|---|---|
| CZT HV Monitor | 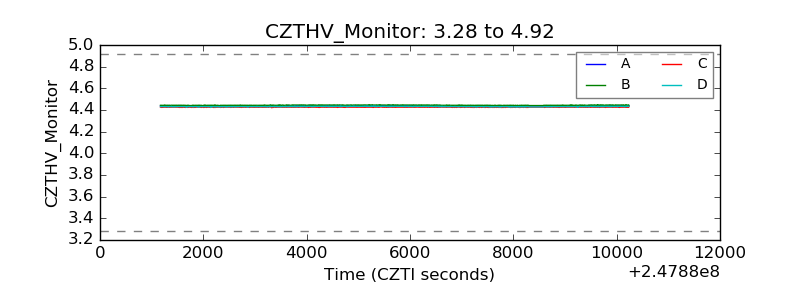 |
| D_VDD | 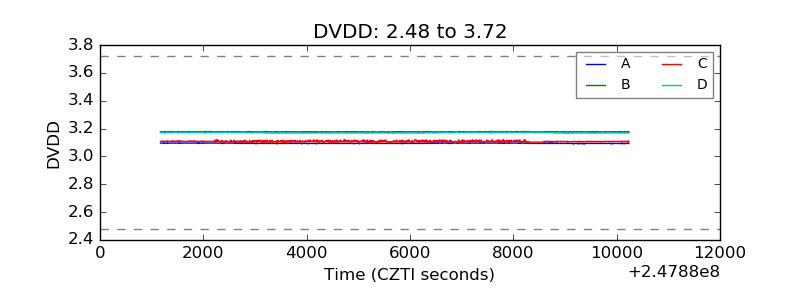 |
| Temperature 1 | 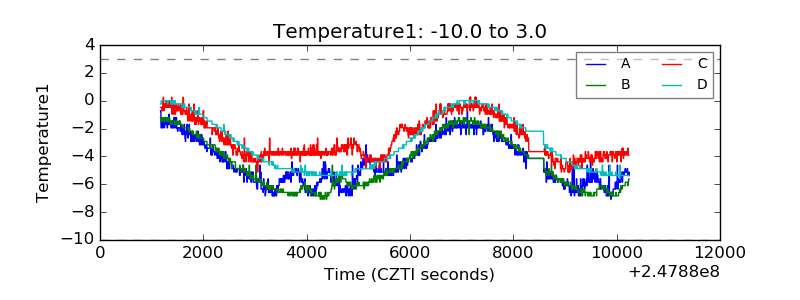 |
| Veto HV Monitor | 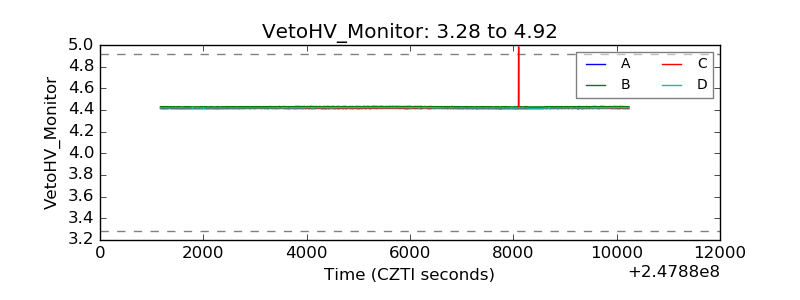 |
| Veto LLD | 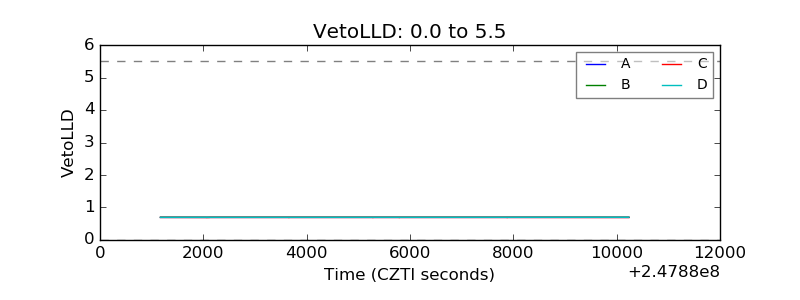 |
| Alpha Counter | 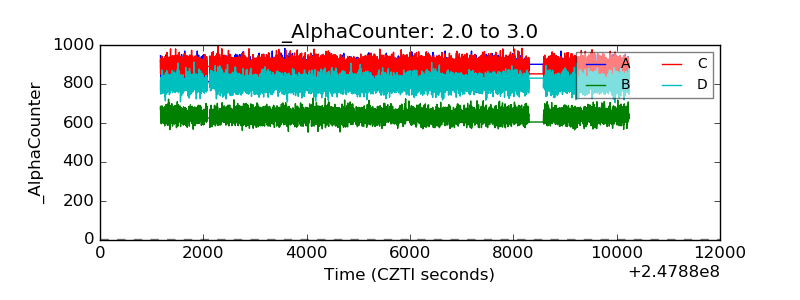 |
| _CPM_Rate | 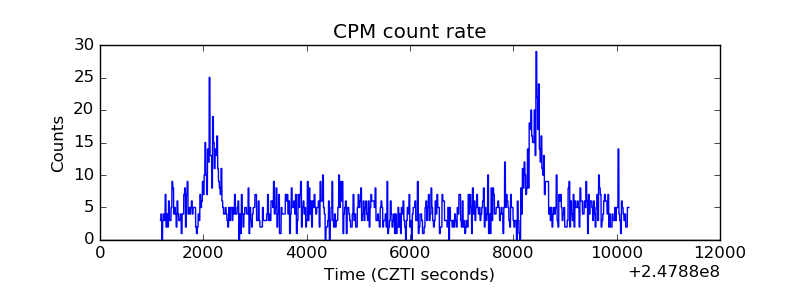 |
| CZT Counter | 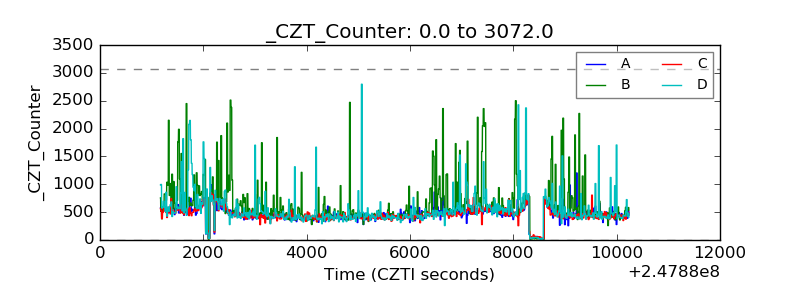 |
| +2.5 Volts monitor |  |
| +5 Volts monitor |  |
| _ROLL_ROT | 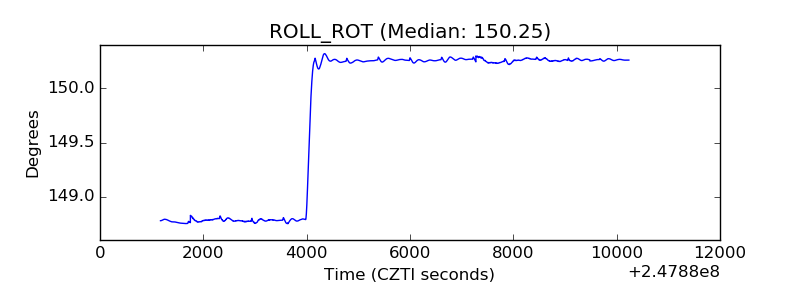 |
| _Roll_DEC | 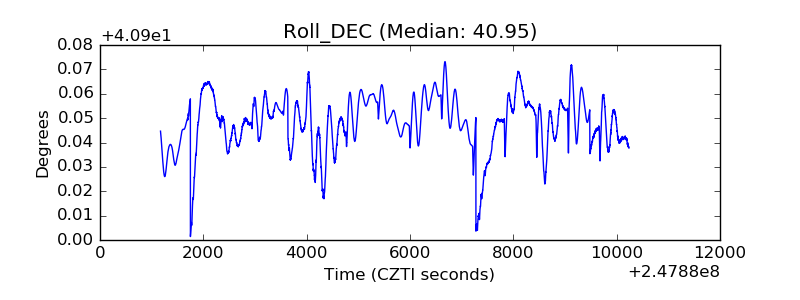 |
| _Roll_RA | 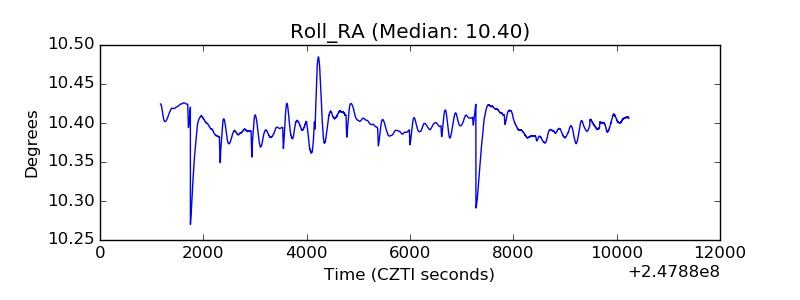 |
| Veto Counter | 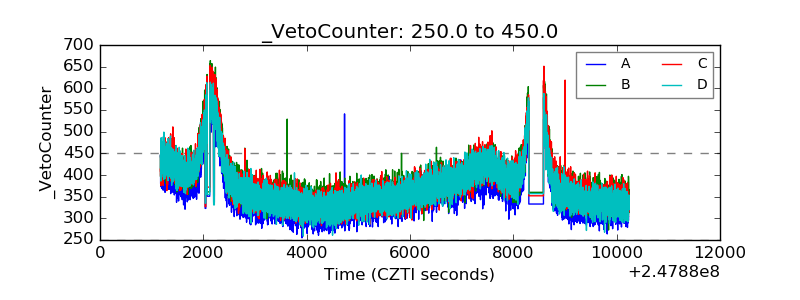 |