| Param | Original file | Final file |
|---|---|---|
| Filename | modeM0/AS1A04_021T02_9000001676_11442cztM0_level2.evt | modeM0/AS1A04_021T02_9000001676_11442cztM0_level2_quad_clean.evt |
| Size (bytes) | 1,048,193,280 | 155,413,440 |
| Size | 999.6 MB | 148.2 MB |
| Events in quadrant A | 7,025,068 | 935,472 |
| Events in quadrant B | 8,842,767 | 915,348 |
| Events in quadrant C | 6,021,848 | 1,015,919 |
| Events in quadrant D | 8,958,491 | 923,275 |
| Mode M9 | |||
|---|---|---|---|
| Quadrant | BADHDUFLAG | Total packets | Discarded packets |
| A | 0 | 14 | 0 |
| B | 0 | 14 | 0 |
| C | 0 | 14 | 0 |
| D | 0 | 14 | 0 |
| Mode SS | |||
|---|---|---|---|
| Quadrant | BADHDUFLAG | Total packets | Discarded packets |
| A | 0 | 272 | 0 |
| B | 0 | 272 | 0 |
| C | 0 | 272 | 0 |
| D | 0 | 272 | 0 |
| Mode M0 | |||
|---|---|---|---|
| Quadrant | BADHDUFLAG | Total packets | Discarded packets |
| A | 0 | 29446 | 4 |
| B | 0 | 35149 | 3 |
| C | 0 | 27105 | 3 |
| D | 0 | 35951 | 3 |
| Quadrant | Total seconds | Saturated seconds | Saturation percentage |
|---|---|---|---|
| A | 13263 | 105 | 0.791676% |
| B | 13263 | 723 | 5.451255% |
| C | 13263 | 52 | 0.392068% |
| D | 13263 | 759 | 5.722687% |
Noise dominated data is calculated using 1-second bins in cleaned event files. If a bin has >2000 counts, and if more than 50% of those come from <1% of pixels, then it is considered to be noise-dominated and hence unusable.
| Quadrant | # 1 sec bins | Bins with >0 counts | Bins with >2000 counts | High rate bins dominated by noise | Noise dominated (total time) | Noise dominated (detector-on time) | Marked lightcurve |
|---|---|---|---|---|---|---|---|
| A | 14679 | 13267 | 14 | 14 | 0.10% | 0.11% | 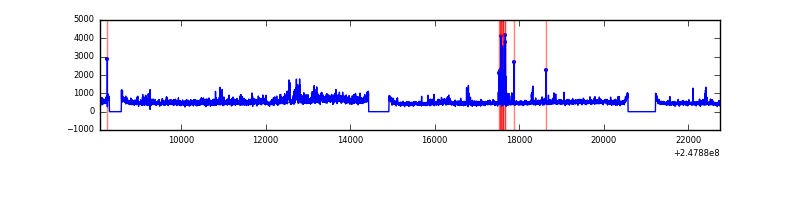 |
| B | 14679 | 13267 | 390 | 390 | 2.66% | 2.94% | 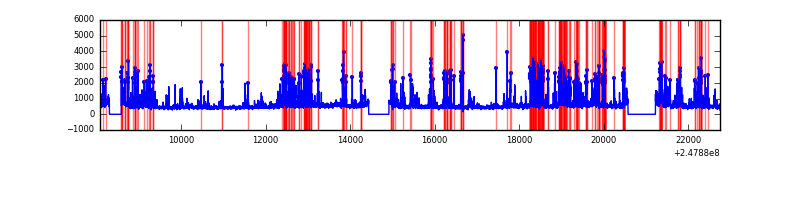 |
| C | 14679 | 13267 | 4 | 4 | 0.03% | 0.03% |  |
| D | 14679 | 13266 | 643 | 643 | 4.38% | 4.85% | 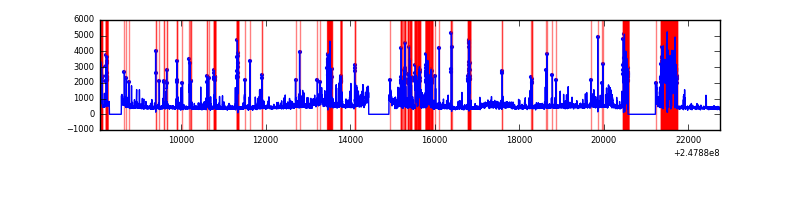 |
Top three noisy pixels from each quadrant. If the there are fewer than three noisy pixels in the level2.evt file, extra rows are filled as -1
| Pixel properties | Quadrant properties | ||||||
|---|---|---|---|---|---|---|---|
| Quadrant | DetID | PixID | Counts | Sigma | Mean | Median | Sigma |
| A | 1 | 162 | 333078 | 1052.64 | 1539 | 1502 | 315.0 |
| A | 1 | 178 | 202457 | 637.96 | 1539 | 1502 | 315.0 |
| A | 1 | 161 | 169562 | 533.53 | 1539 | 1502 | 315.0 |
| B | 4 | 239 | 2405665 | 8299.44 | 1518 | 1480 | 289.7 |
| B | 15 | 204 | 110539 | 376.48 | 1518 | 1480 | 289.7 |
| B | 3 | 189 | 94256 | 320.27 | 1518 | 1480 | 289.7 |
| C | 14 | 234 | 26041 | 68.5 | 1534 | 1542 | 357.6 |
| C | 12 | 4 | 12617 | 30.97 | 1534 | 1542 | 357.6 |
| C | 13 | 61 | 11193 | 26.99 | 1534 | 1542 | 357.6 |
| D | 1 | 52 | 1860798 | 5317.72 | 1463 | 1424 | 349.7 |
| D | 2 | 33 | 550035 | 1569.0 | 1463 | 1424 | 349.7 |
| D | 9 | 85 | 186361 | 528.91 | 1463 | 1424 | 349.7 |
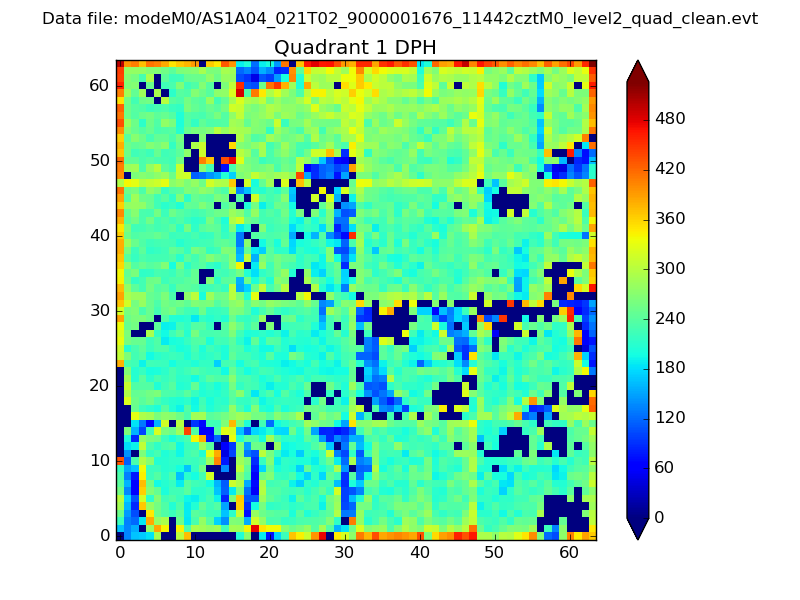
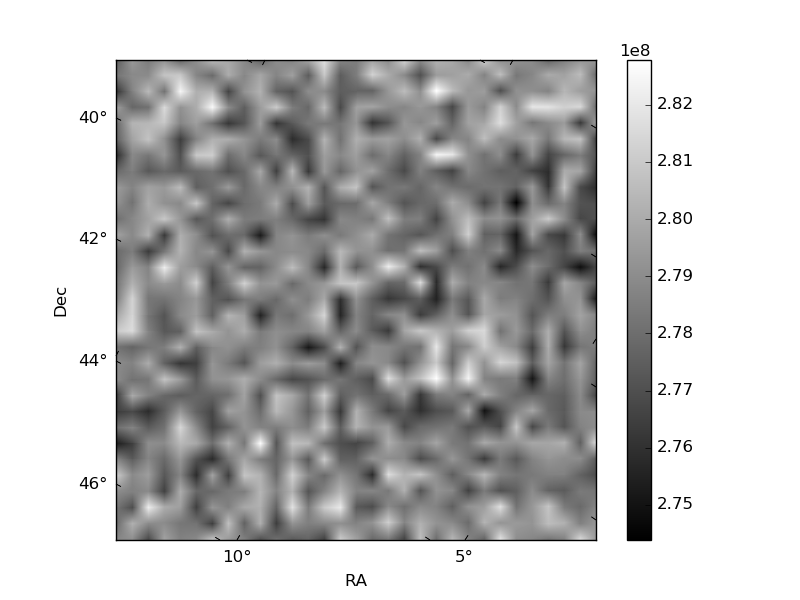
Histogram calculated using DETX and DETY for each event in the final _common_clean file
| Quadrant A | 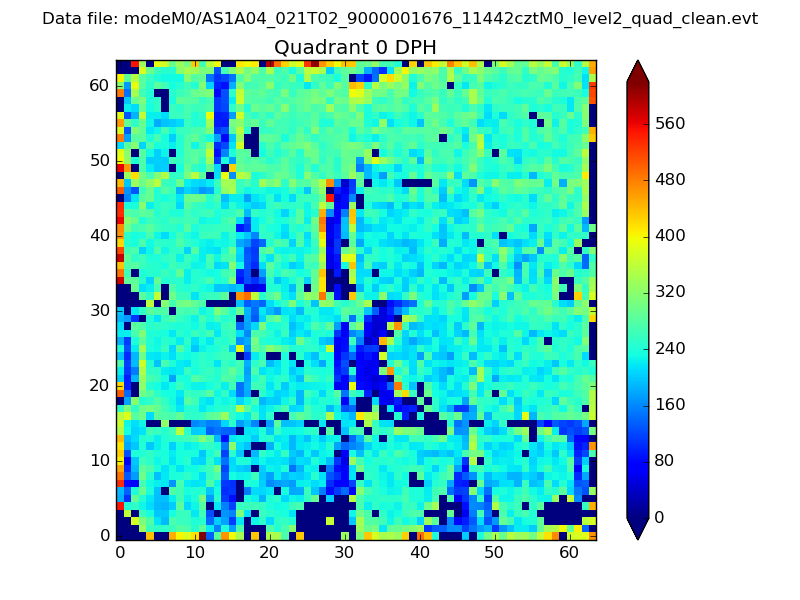 |
 |
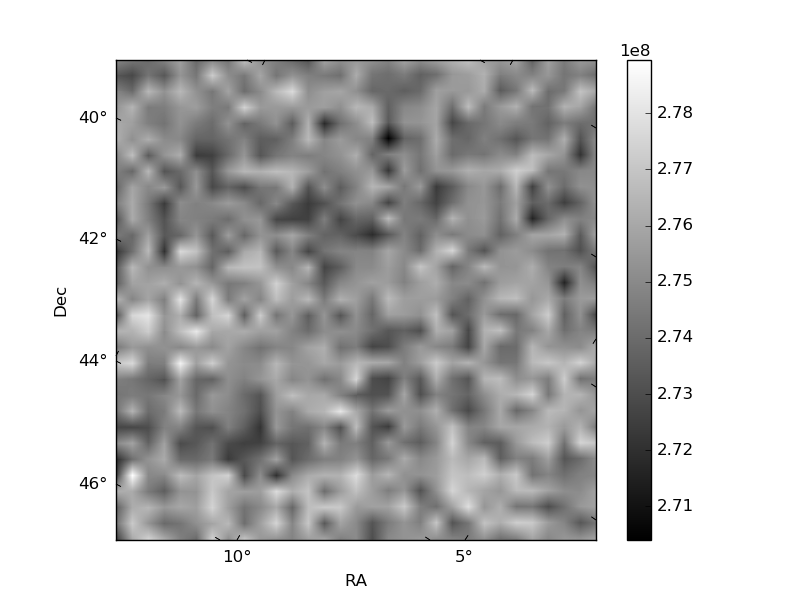
Quadrant B |
|---|---|---|---|
| Quadrant D |  |
 |
Quadrant C |
| Plot type | Count rate plots | Images |
|---|---|---|
| Comparison with Poisson distribution Blue bars denote a histogram of data divided into 1 sec bins. Red curve is a Poisson curve with rate = median count rate of data. |
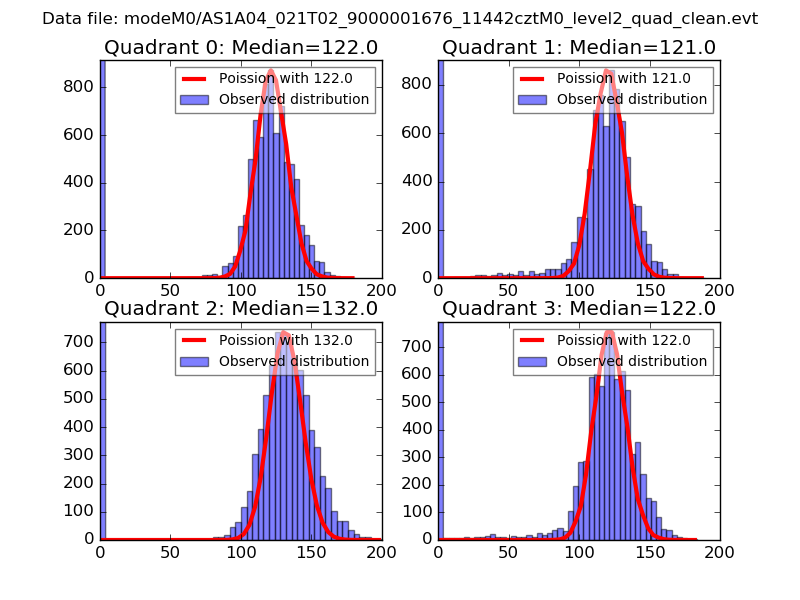 |
 |
| Quadrant-wise count rates Data is divided into 100 sec bins |
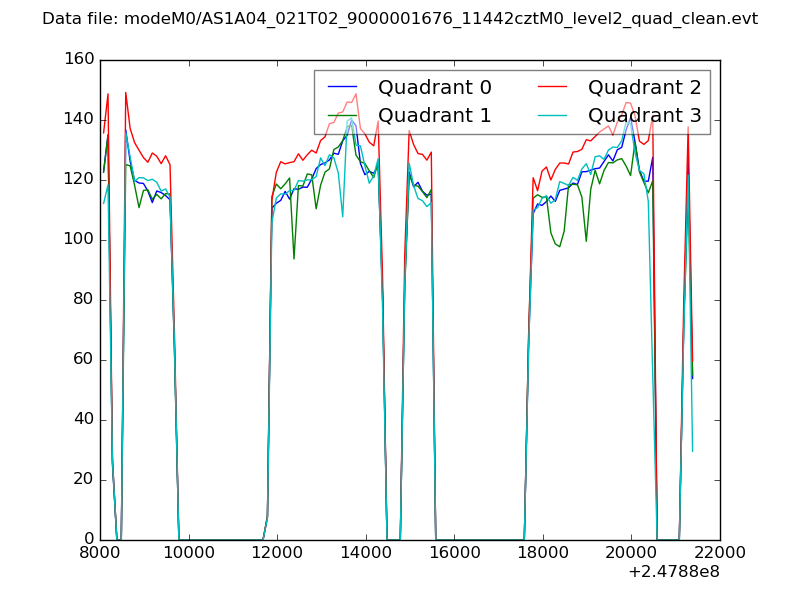 |
|
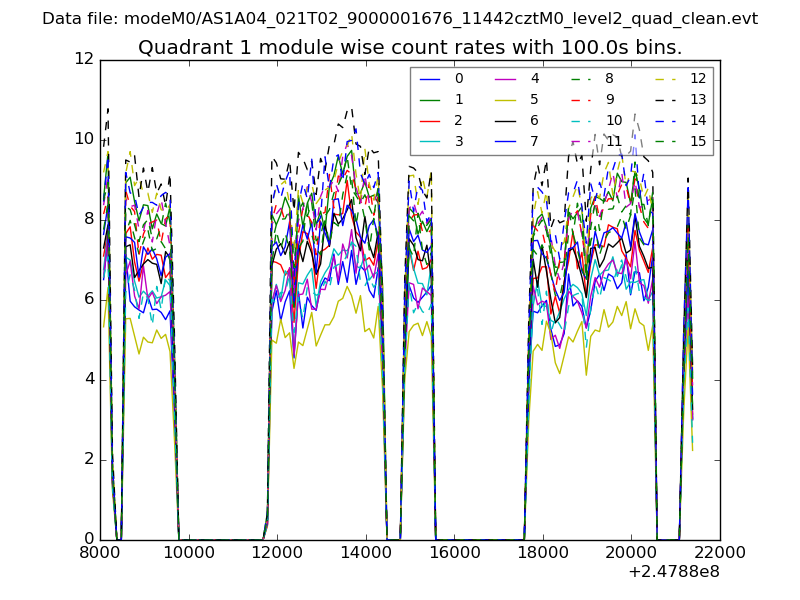
| Module-wise count rates for Quadrant A Data is divided into 100 sec bins |
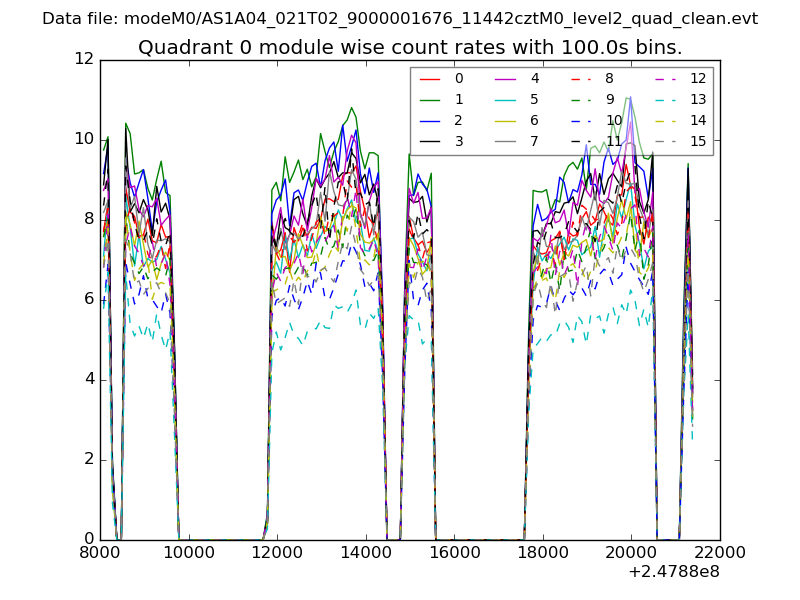 |
 |
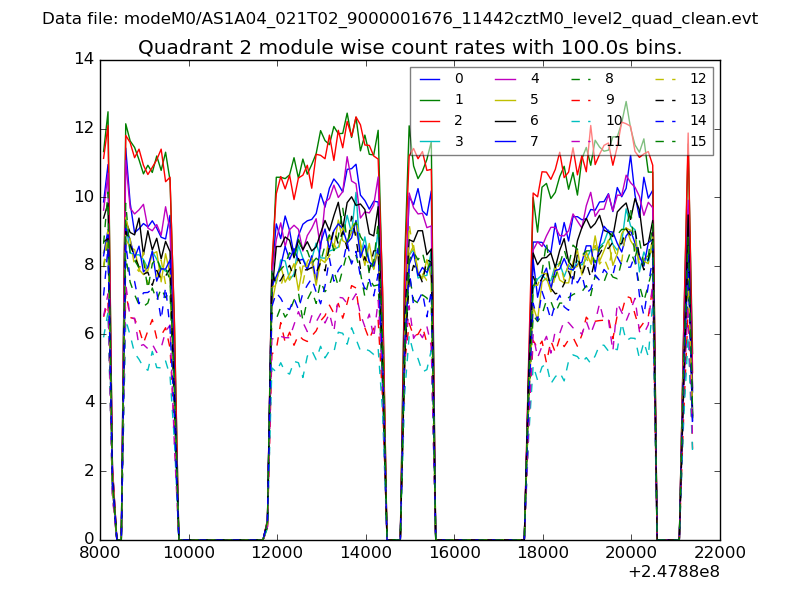
| Module-wise count rates for Quadrant B Data is divided into 100 sec bins |
 |
 |
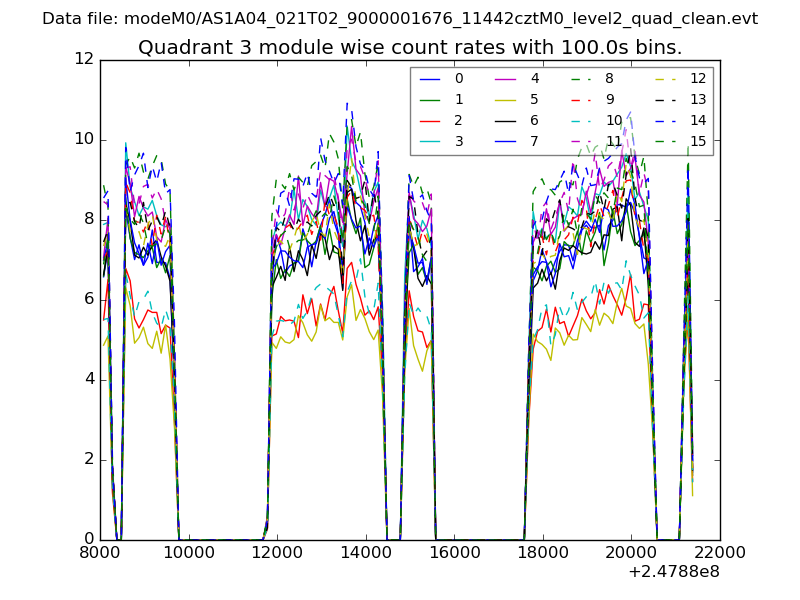
| Module-wise count rates for Quadrant C Data is divided into 100 sec bins |
 |
 |
| Module-wise count rates for Quadrant D Data is divided into 100 sec bins |
 |
 |
| Parameter | Plot |
|---|---|
| CZT HV Monitor | 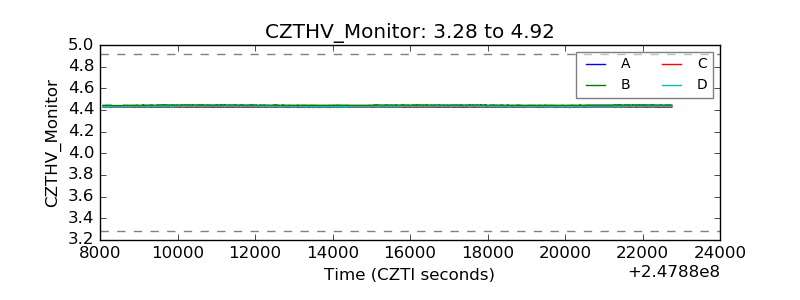 |
| D_VDD | 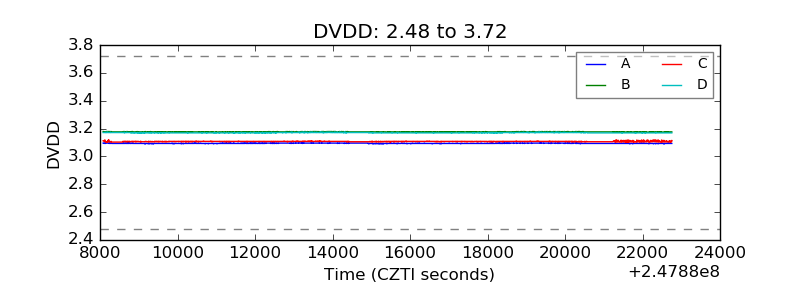 |
| Temperature 1 | 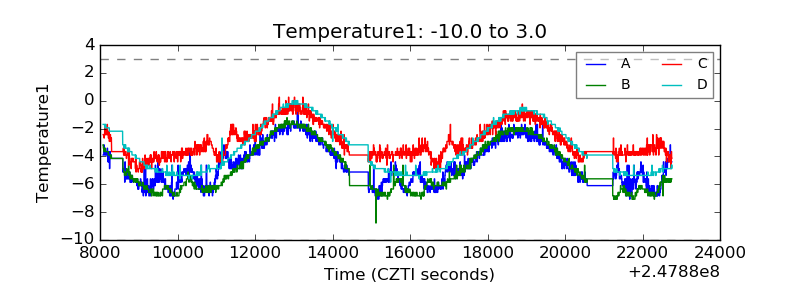 |
| Veto HV Monitor | 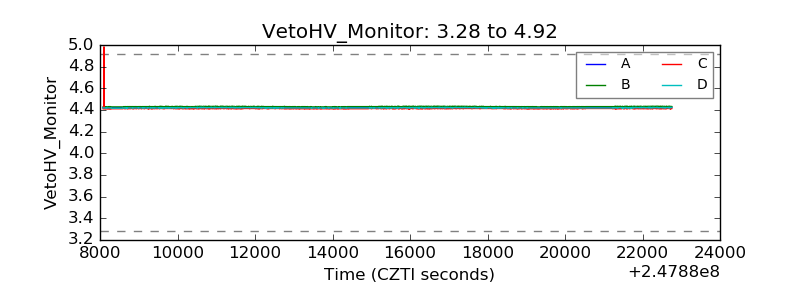 |
| Veto LLD | 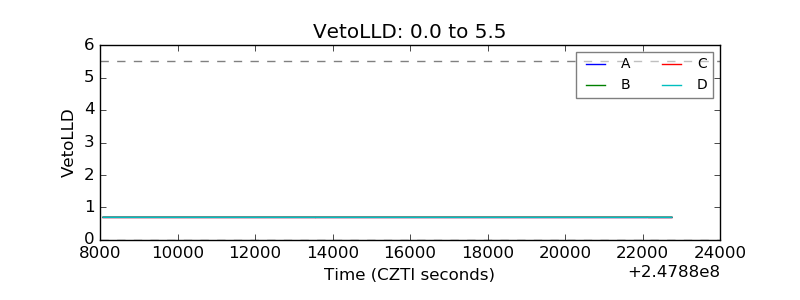 |
| Alpha Counter | 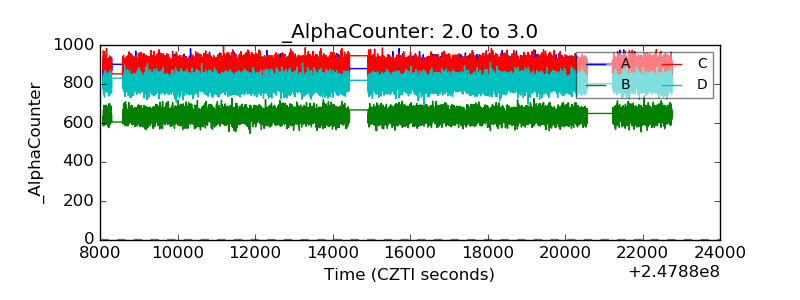 |
| _CPM_Rate | 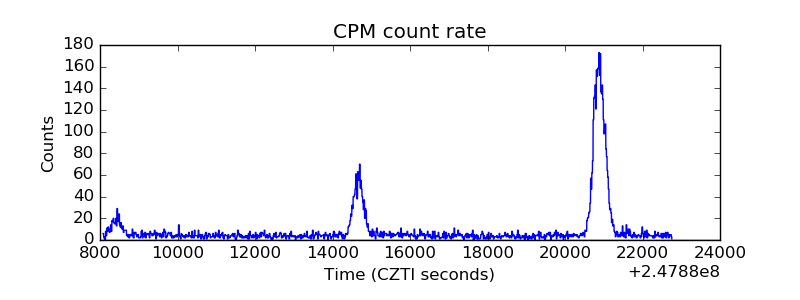 |
| CZT Counter |  |
| +2.5 Volts monitor |  |
| +5 Volts monitor |  |
| _ROLL_ROT | 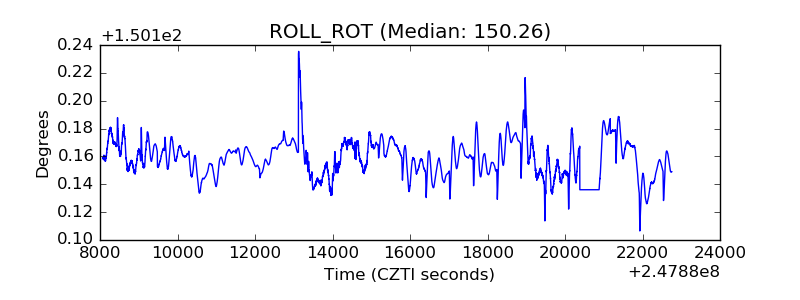 |
| _Roll_DEC | 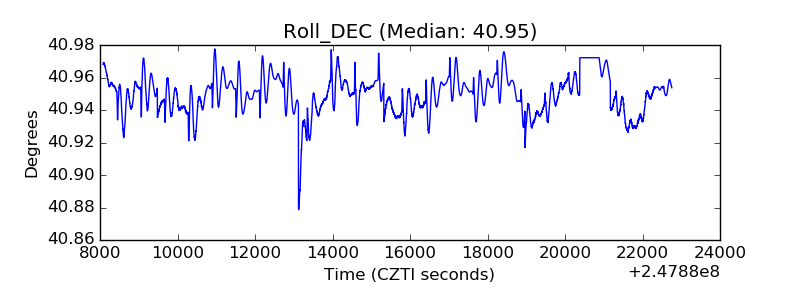 |
| _Roll_RA | 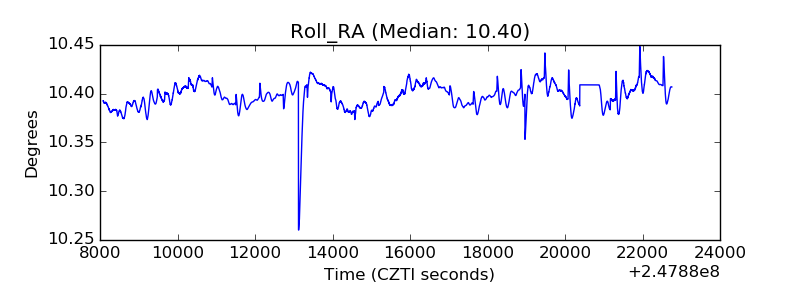 |
| Veto Counter | 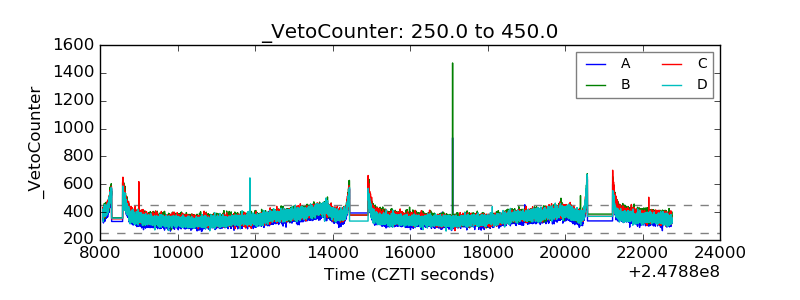 |