| Param | Original file | Final file |
|---|---|---|
| Filename | modeM0/AS1A04_021T02_9000001676_11443cztM0_level2.evt | modeM0/AS1A04_021T02_9000001676_11443cztM0_level2_quad_clean.evt |
| Size (bytes) | 559,609,920 | 73,946,880 |
| Size | 533.7 MB | 70.5 MB |
| Events in quadrant A | 3,630,562 | 430,040 |
| Events in quadrant B | 5,128,527 | 413,519 |
| Events in quadrant C | 3,334,933 | 467,521 |
| Events in quadrant D | 4,362,639 | 423,690 |
| Mode M9 | |||
|---|---|---|---|
| Quadrant | BADHDUFLAG | Total packets | Discarded packets |
| A | 0 | 15 | 0 |
| B | 0 | 15 | 0 |
| C | 0 | 15 | 0 |
| D | 0 | 15 | 0 |
| Mode SS | |||
|---|---|---|---|
| Quadrant | BADHDUFLAG | Total packets | Discarded packets |
| A | 0 | 148 | 0 |
| B | 0 | 148 | 0 |
| C | 0 | 148 | 0 |
| D | 0 | 148 | 0 |
| Mode M0 | |||
|---|---|---|---|
| Quadrant | BADHDUFLAG | Total packets | Discarded packets |
| A | 0 | 15309 | 3 |
| B | 0 | 19939 | 2 |
| C | 0 | 14795 | 2 |
| D | 0 | 18108 | 2 |
| Quadrant | Total seconds | Saturated seconds | Saturation percentage |
|---|---|---|---|
| A | 7240 | 89 | 1.229282% |
| B | 7240 | 588 | 8.121547% |
| C | 7240 | 60 | 0.828729% |
| D | 7240 | 463 | 6.395028% |
Noise dominated data is calculated using 1-second bins in cleaned event files. If a bin has >2000 counts, and if more than 50% of those come from <1% of pixels, then it is considered to be noise-dominated and hence unusable.
| Quadrant | # 1 sec bins | Bins with >0 counts | Bins with >2000 counts | High rate bins dominated by noise | Noise dominated (total time) | Noise dominated (detector-on time) | Marked lightcurve |
|---|---|---|---|---|---|---|---|
| A | 8701 | 7243 | 0 | 0 | 0.00% | 0.00% | 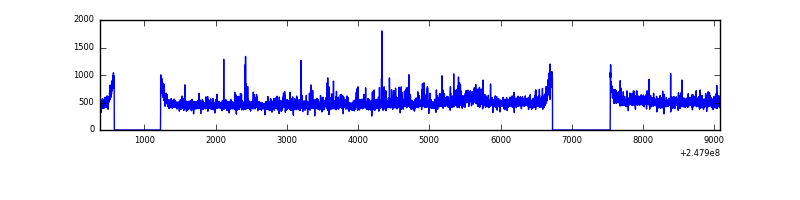 |
| B | 8701 | 7243 | 307 | 307 | 3.53% | 4.24% | 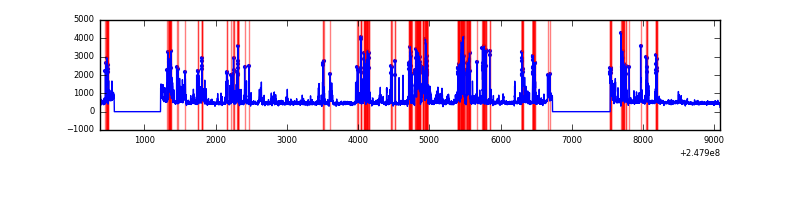 |
| C | 8701 | 7243 | 0 | 0 | 0.00% | 0.00% | 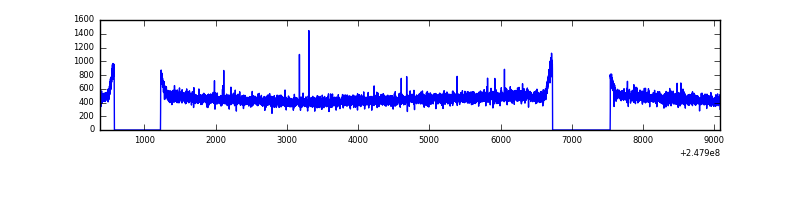 |
| D | 8701 | 7242 | 374 | 374 | 4.30% | 5.16% | 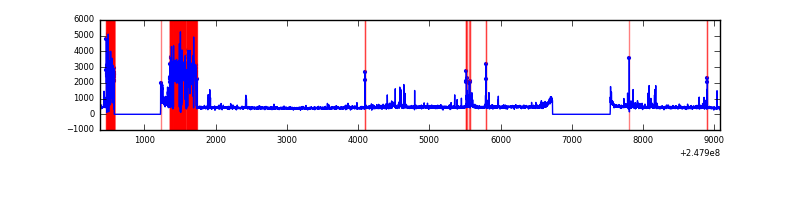 |
Top three noisy pixels from each quadrant. If the there are fewer than three noisy pixels in the level2.evt file, extra rows are filled as -1
| Pixel properties | Quadrant properties | ||||||
|---|---|---|---|---|---|---|---|
| Quadrant | DetID | PixID | Counts | Sigma | Mean | Median | Sigma |
| A | 1 | 162 | 112680 | 632.9 | 858 | 838 | 176.7 |
| A | 1 | 178 | 67010 | 374.46 | 858 | 838 | 176.7 |
| A | 1 | 161 | 55820 | 311.14 | 858 | 838 | 176.7 |
| B | 4 | 239 | 1709492 | 10593.12 | 840 | 818 | 161.3 |
| B | 15 | 204 | 43277 | 263.23 | 840 | 818 | 161.3 |
| B | 0 | 214 | 25339 | 152.02 | 840 | 818 | 161.3 |
| C | 8 | 128 | 10109 | 46.88 | 849 | 856 | 197.4 |
| C | 13 | 61 | 6259 | 27.38 | 849 | 856 | 197.4 |
| C | 8 | 112 | 6120 | 26.67 | 849 | 856 | 197.4 |
| D | 1 | 52 | 1107741 | 5655.36 | 804 | 781 | 195.7 |
| D | 2 | 120 | 58939 | 297.12 | 804 | 781 | 195.7 |
| D | 10 | 253 | 51290 | 258.04 | 804 | 781 | 195.7 |
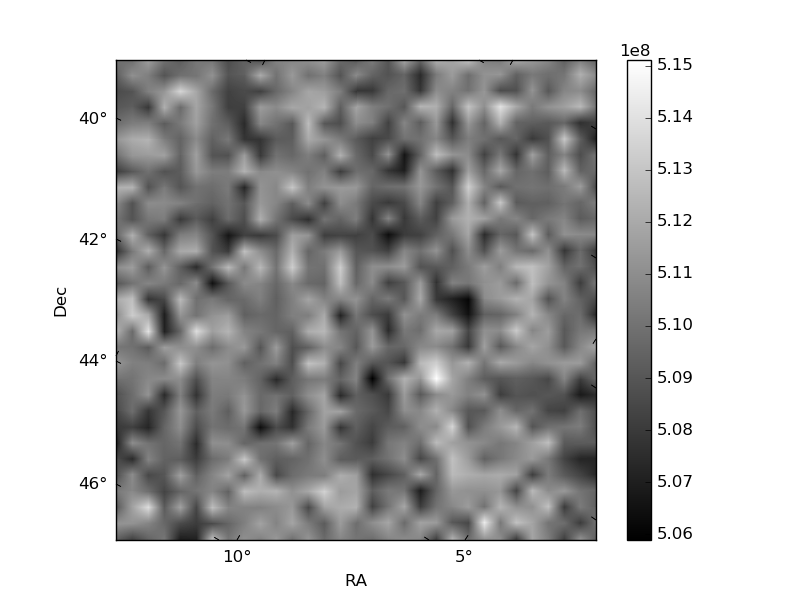
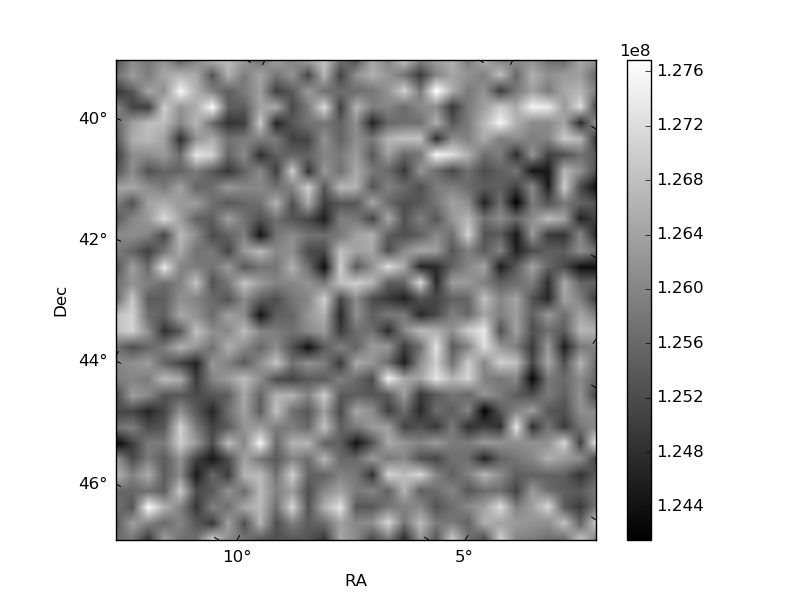
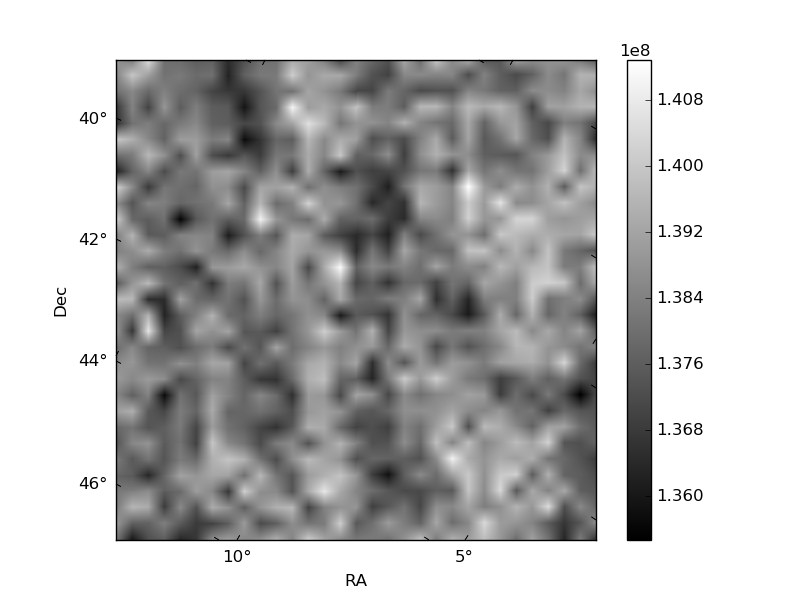
Histogram calculated using DETX and DETY for each event in the final _common_clean file
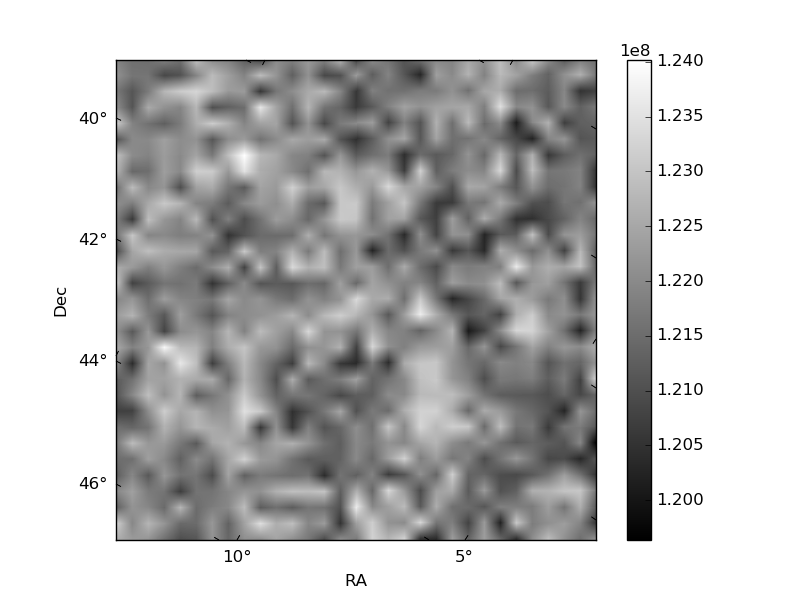
| Quadrant A | 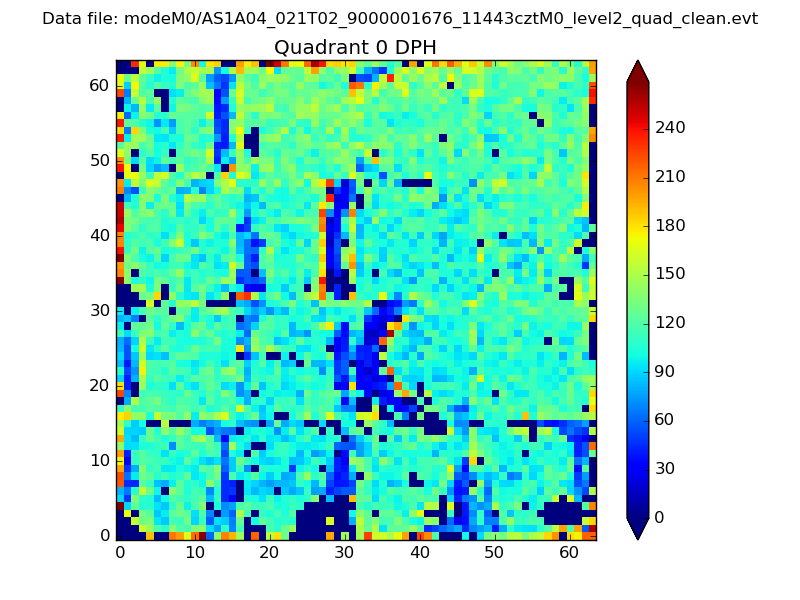 |
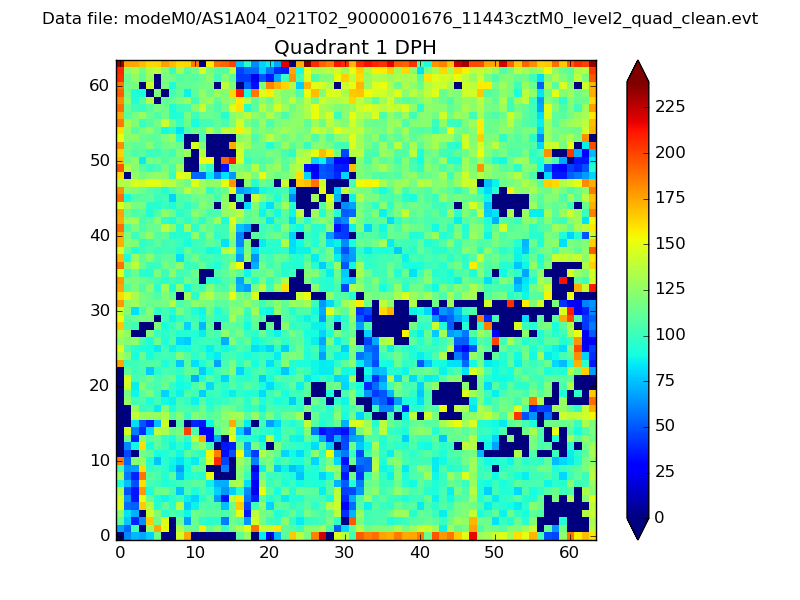 |
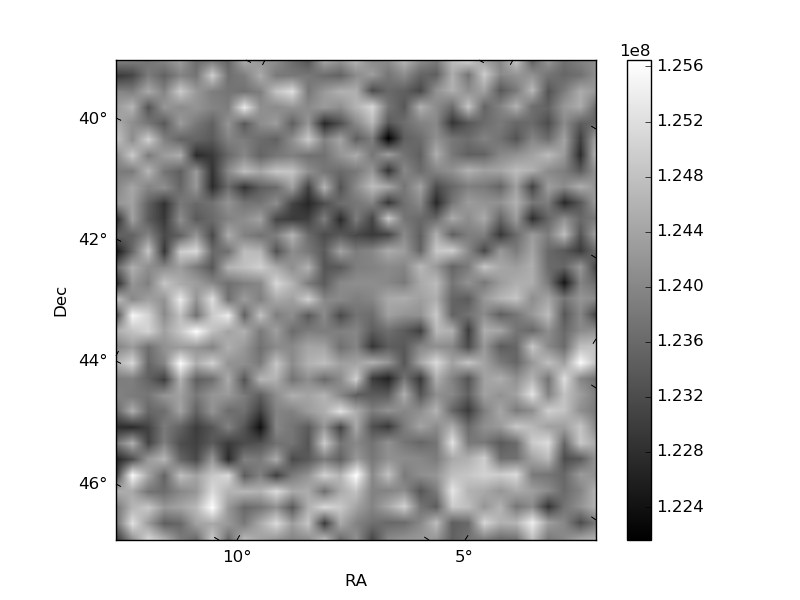
Quadrant B |
|---|---|---|---|
| Quadrant D | 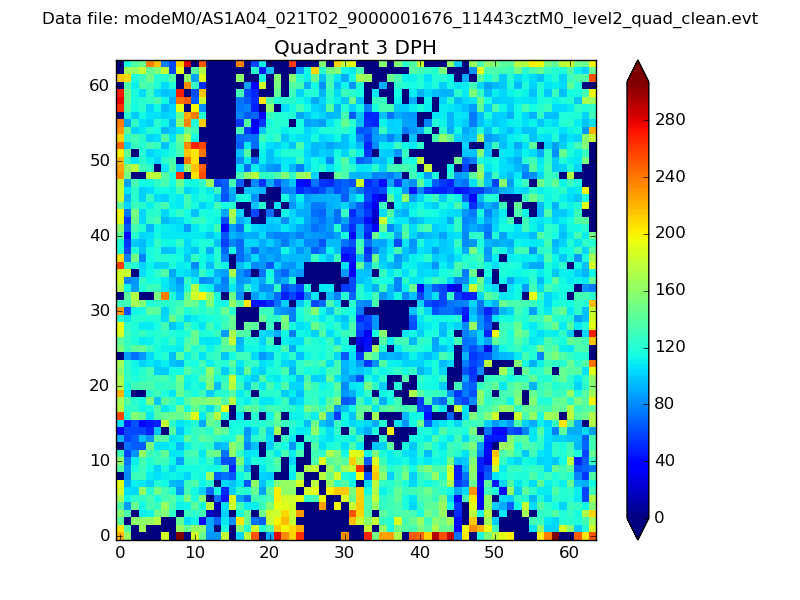 |
 |
Quadrant C |
| Plot type | Count rate plots | Images |
|---|---|---|
| Comparison with Poisson distribution Blue bars denote a histogram of data divided into 1 sec bins. Red curve is a Poisson curve with rate = median count rate of data. |
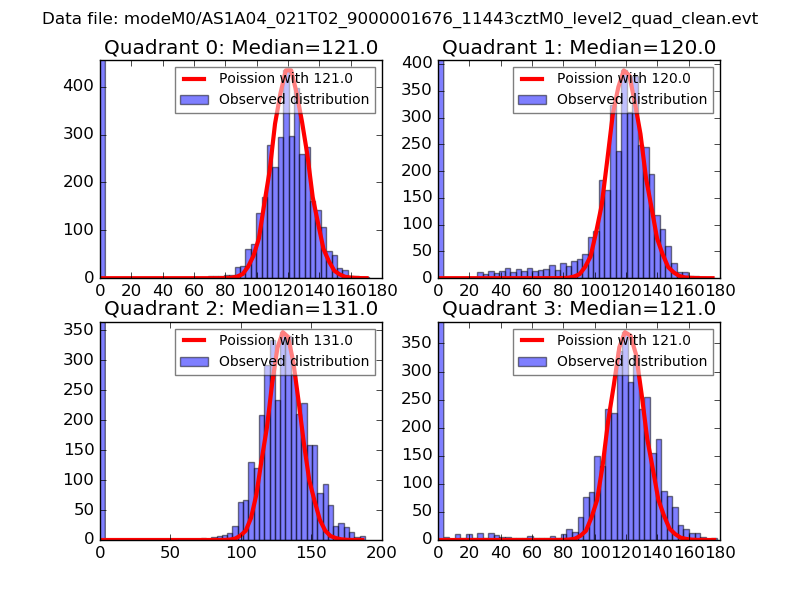 |
 |
| Quadrant-wise count rates Data is divided into 100 sec bins |
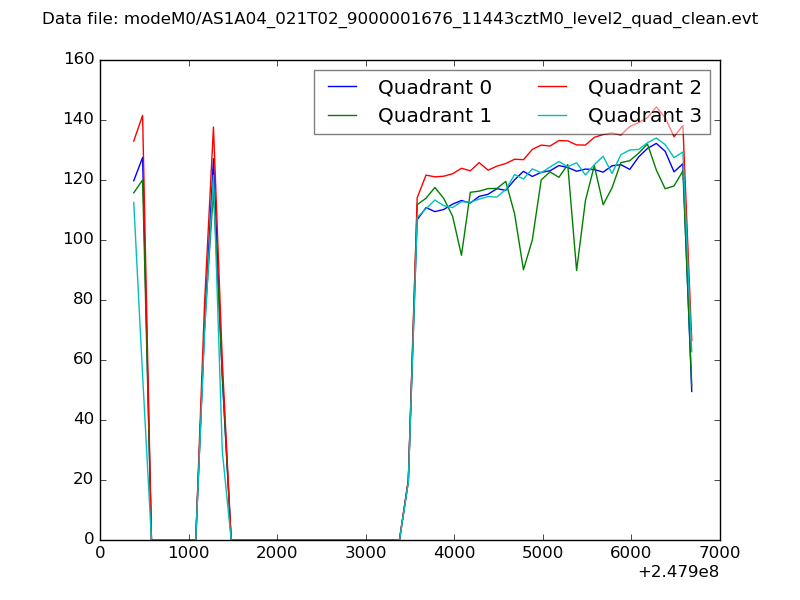 |
|
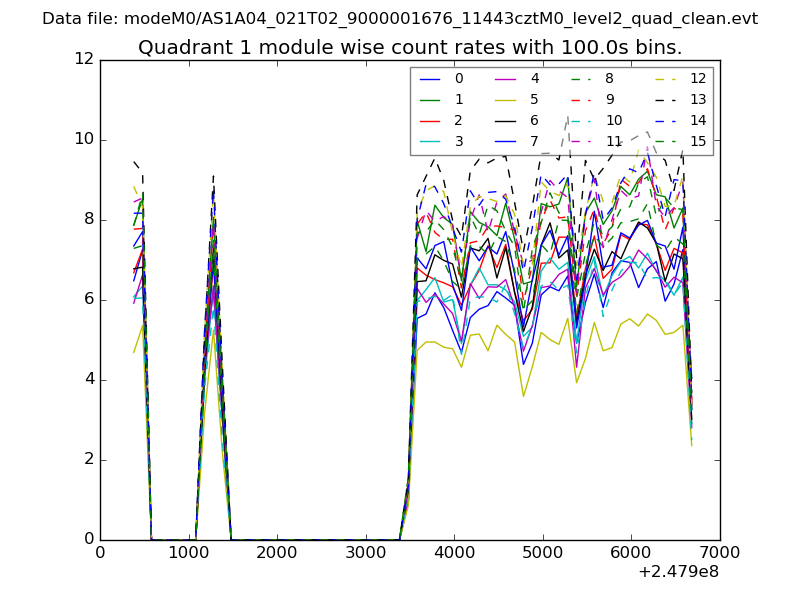
| Module-wise count rates for Quadrant A Data is divided into 100 sec bins |
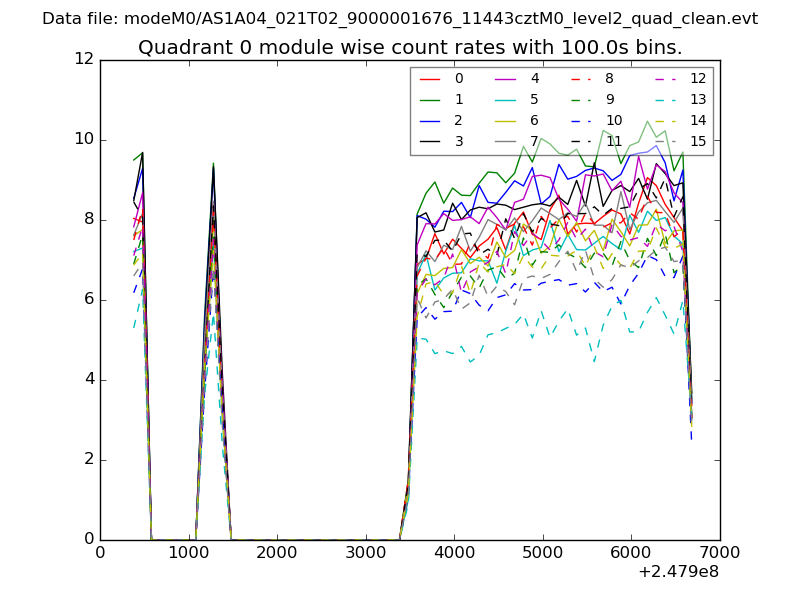 |
 |
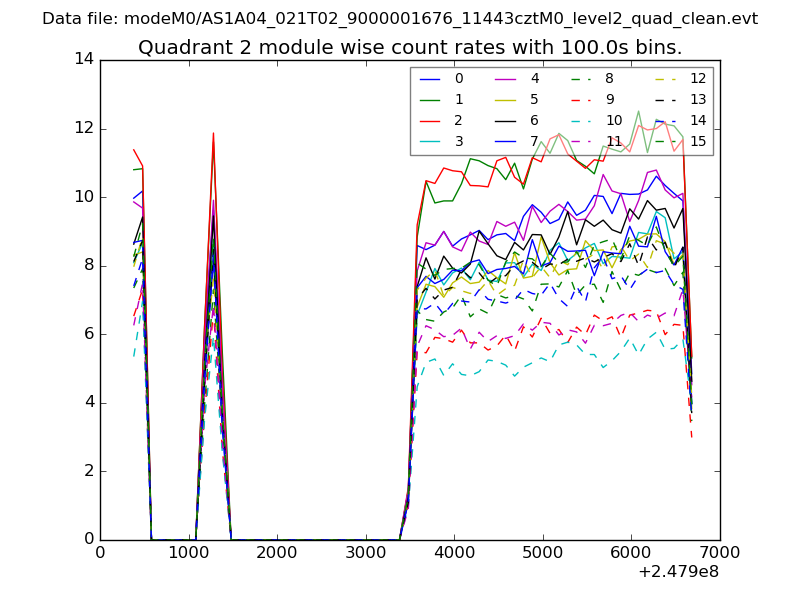
| Module-wise count rates for Quadrant B Data is divided into 100 sec bins |
 |
 |
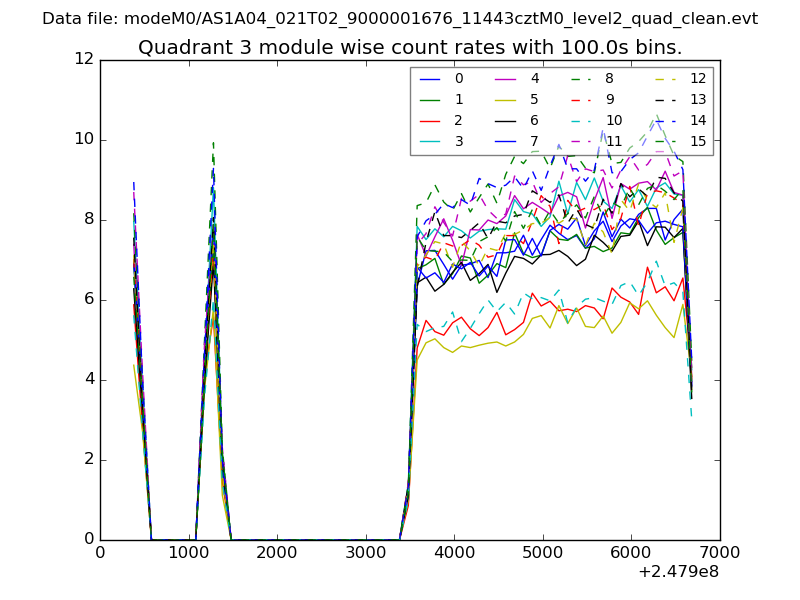
| Module-wise count rates for Quadrant C Data is divided into 100 sec bins |
 |
 |
| Module-wise count rates for Quadrant D Data is divided into 100 sec bins |
 |
 |
| Parameter | Plot |
|---|---|
| CZT HV Monitor | 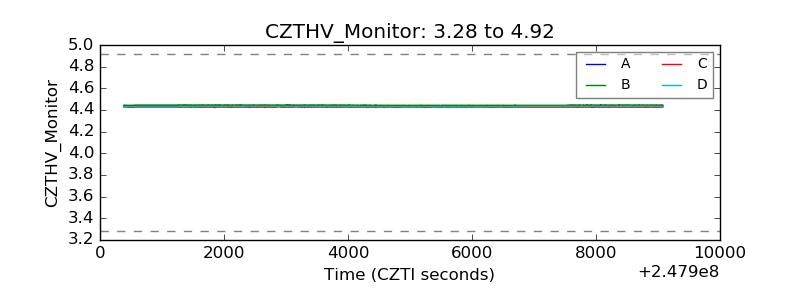 |
| D_VDD | 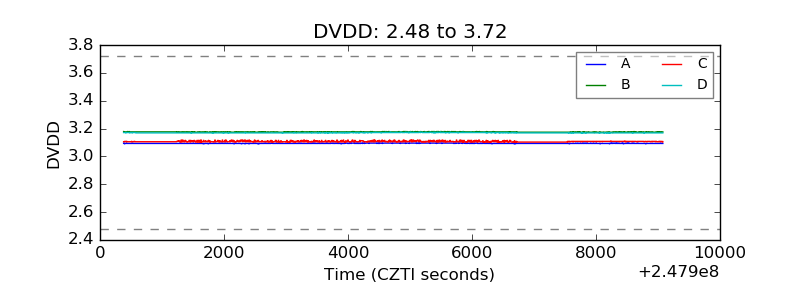 |
| Temperature 1 | 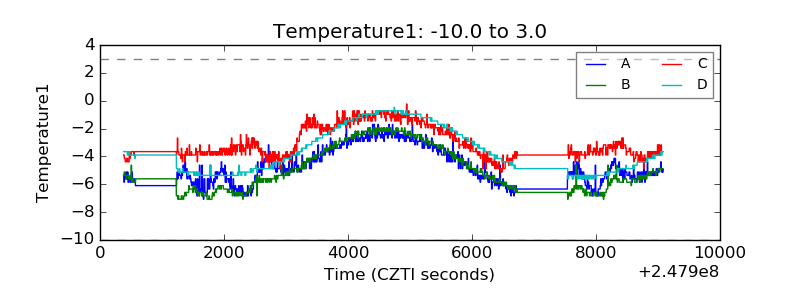 |
| Veto HV Monitor | 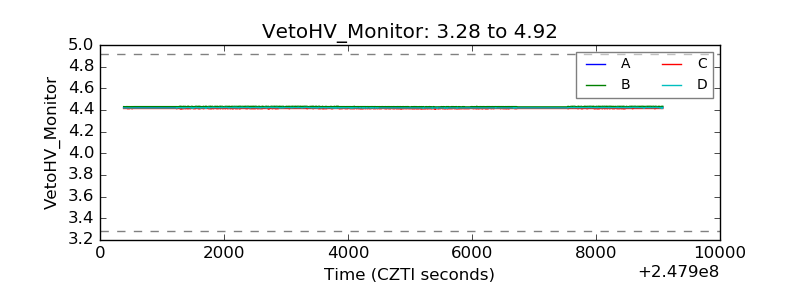 |
| Veto LLD | 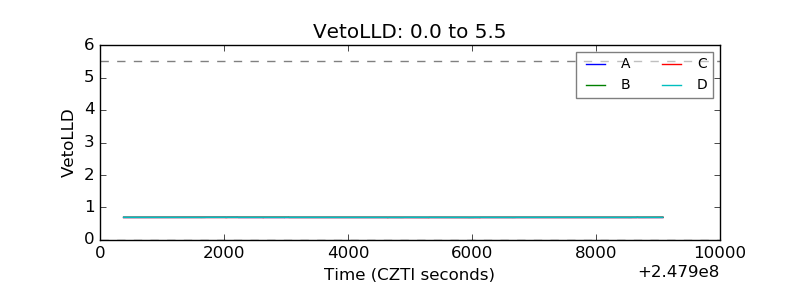 |
| Alpha Counter |  |
| _CPM_Rate |  |
| CZT Counter |  |
| +2.5 Volts monitor |  |
| +5 Volts monitor |  |
| _ROLL_ROT | 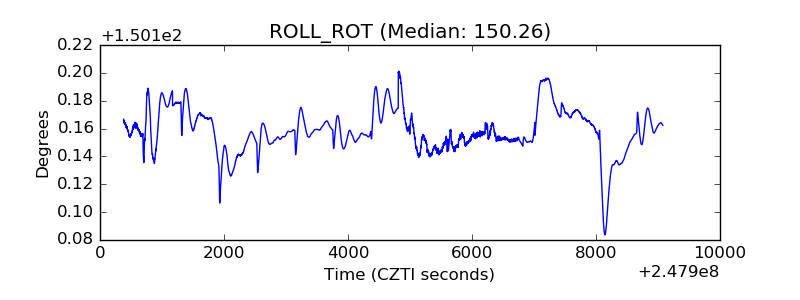 |
| _Roll_DEC | 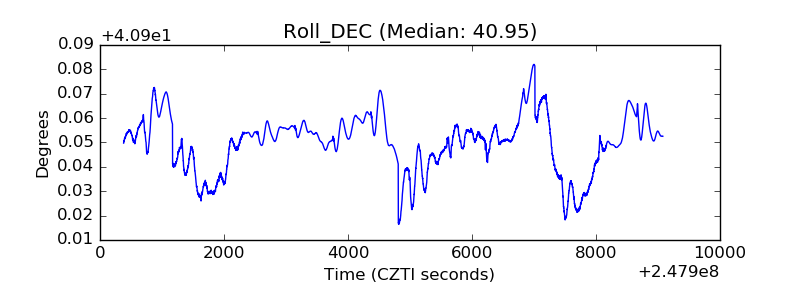 |
| _Roll_RA | 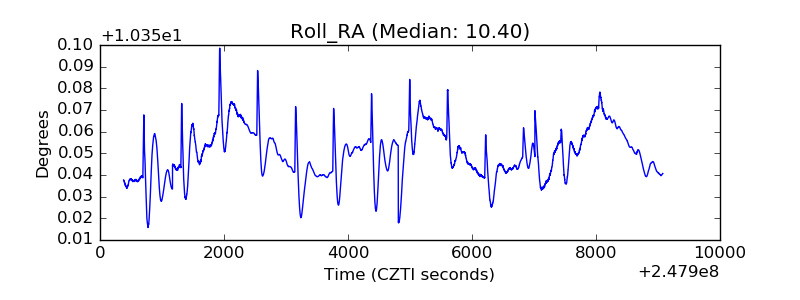 |
| Veto Counter | 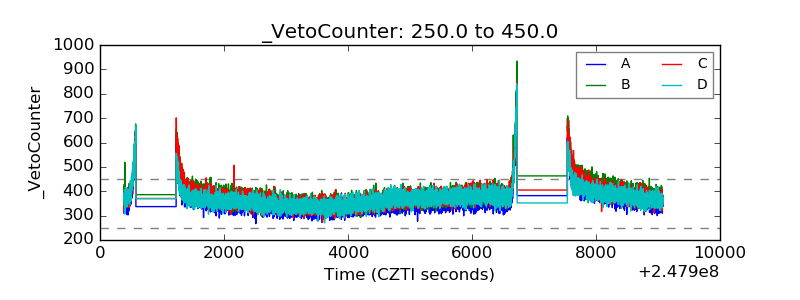 |