| Param | Original file | Final file |
|---|---|---|
| Filename | modeM0/AS1A04_021T02_9000001676_11444cztM0_level2.evt | modeM0/AS1A04_021T02_9000001676_11444cztM0_level2_quad_clean.evt |
| Size (bytes) | 501,860,160 | 71,369,280 |
| Size | 478.6 MB | 68.1 MB |
| Events in quadrant A | 3,788,609 | 413,368 |
| Events in quadrant B | 4,431,675 | 408,354 |
| Events in quadrant C | 3,109,770 | 450,620 |
| Events in quadrant D | 3,411,518 | 419,052 |
| Mode M9 | |||
|---|---|---|---|
| Quadrant | BADHDUFLAG | Total packets | Discarded packets |
| A | 0 | 10 | 0 |
| B | 0 | 10 | 0 |
| C | 0 | 10 | 0 |
| D | 0 | 11 | 0 |
| Mode SS | |||
|---|---|---|---|
| Quadrant | BADHDUFLAG | Total packets | Discarded packets |
| A | 0 | 136 | 0 |
| B | 0 | 136 | 0 |
| C | 0 | 136 | 0 |
| D | 0 | 136 | 0 |
| Mode M0 | |||
|---|---|---|---|
| Quadrant | BADHDUFLAG | Total packets | Discarded packets |
| A | 0 | 15519 | 3 |
| B | 0 | 17438 | 2 |
| C | 0 | 13747 | 2 |
| D | 0 | 14730 | 2 |
| Quadrant | Total seconds | Saturated seconds | Saturation percentage |
|---|---|---|---|
| A | 6736 | 159 | 2.360451% |
| B | 6736 | 350 | 5.195962% |
| C | 6736 | 44 | 0.653207% |
| D | 6736 | 82 | 1.217340% |
Noise dominated data is calculated using 1-second bins in cleaned event files. If a bin has >2000 counts, and if more than 50% of those come from <1% of pixels, then it is considered to be noise-dominated and hence unusable.
| Quadrant | # 1 sec bins | Bins with >0 counts | Bins with >2000 counts | High rate bins dominated by noise | Noise dominated (total time) | Noise dominated (detector-on time) | Marked lightcurve |
|---|---|---|---|---|---|---|---|
| A | 7707 | 6738 | 43 | 43 | 0.56% | 0.64% | 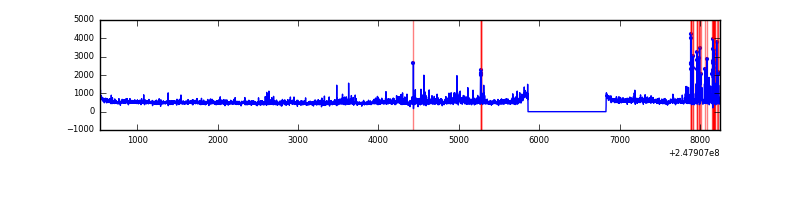 |
| B | 7707 | 6738 | 142 | 142 | 1.84% | 2.11% | 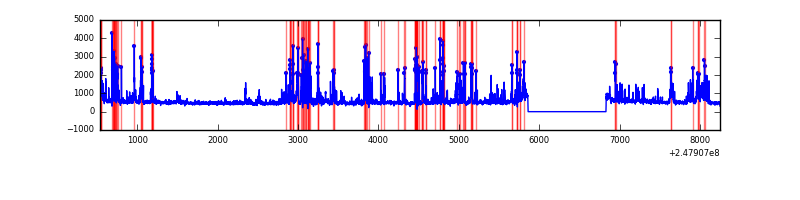 |
| C | 7707 | 6738 | 0 | 0 | 0.00% | 0.00% | 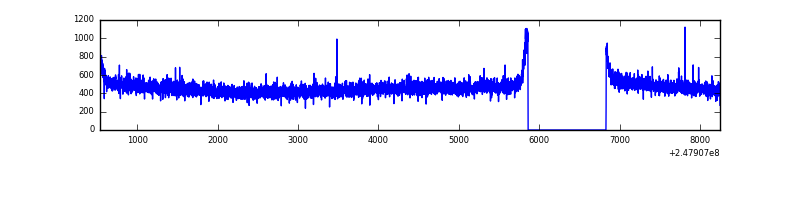 |
| D | 7707 | 6738 | 31 | 31 | 0.40% | 0.46% | 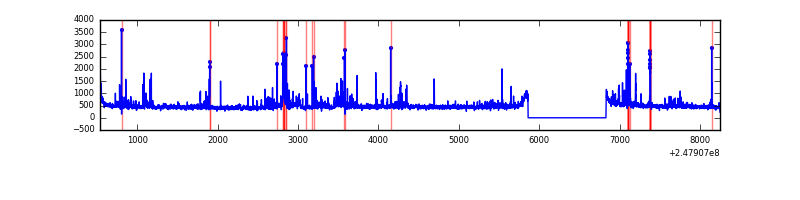 |
Top three noisy pixels from each quadrant. If the there are fewer than three noisy pixels in the level2.evt file, extra rows are filled as -1
| Pixel properties | Quadrant properties | ||||||
|---|---|---|---|---|---|---|---|
| Quadrant | DetID | PixID | Counts | Sigma | Mean | Median | Sigma |
| A | 9 | 143 | 181141 | 1088.07 | 808 | 788 | 165.8 |
| A | 1 | 162 | 163825 | 983.6 | 808 | 788 | 165.8 |
| A | 1 | 178 | 109825 | 657.82 | 808 | 788 | 165.8 |
| B | 4 | 239 | 1104650 | 7197.39 | 802 | 781 | 153.4 |
| B | 0 | 219 | 60677 | 390.53 | 802 | 781 | 153.4 |
| B | 15 | 204 | 50408 | 323.58 | 802 | 781 | 153.4 |
| C | 13 | 61 | 5820 | 27.16 | 797 | 802 | 184.8 |
| C | 12 | 4 | 2752 | 10.55 | 797 | 802 | 184.8 |
| C | 14 | 234 | 2286 | 8.03 | 797 | 802 | 184.8 |
| D | 2 | 120 | 131318 | 692.58 | 788 | 767 | 188.5 |
| D | 13 | 104 | 65031 | 340.92 | 788 | 767 | 188.5 |
| D | 10 | 253 | 61582 | 322.63 | 788 | 767 | 188.5 |
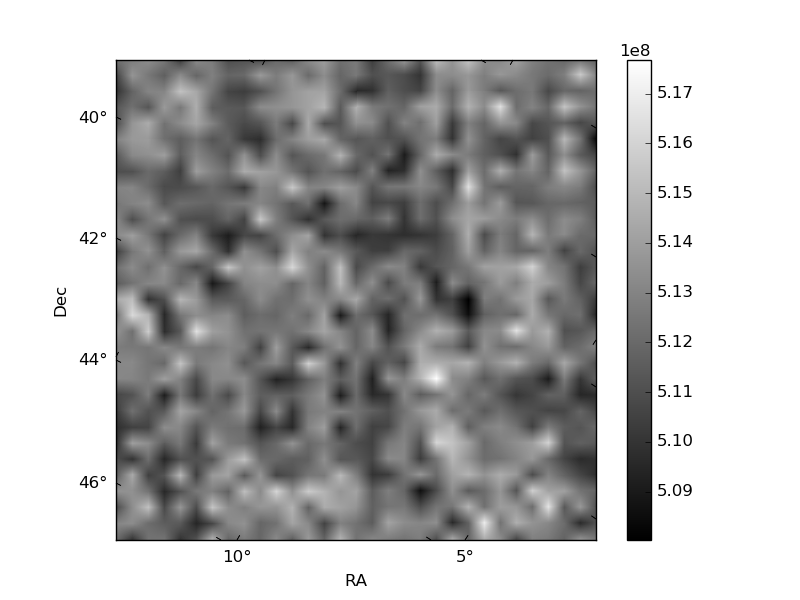
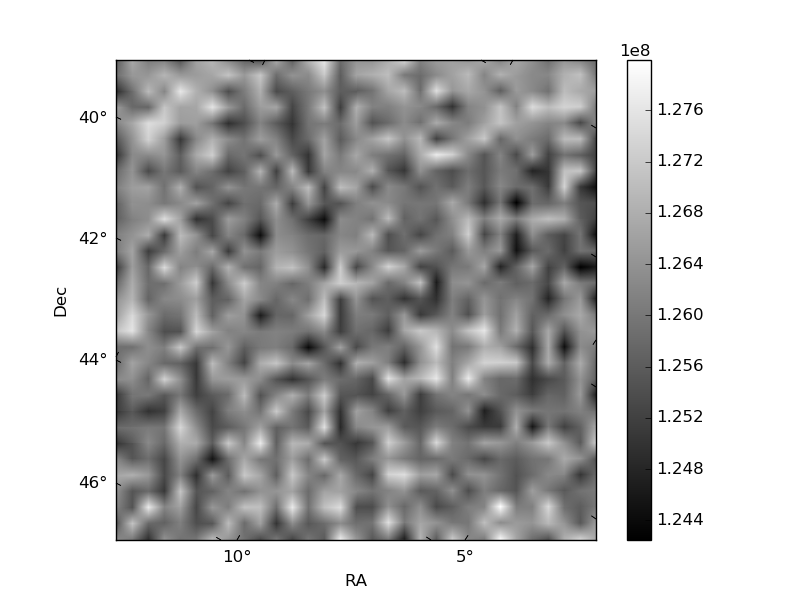
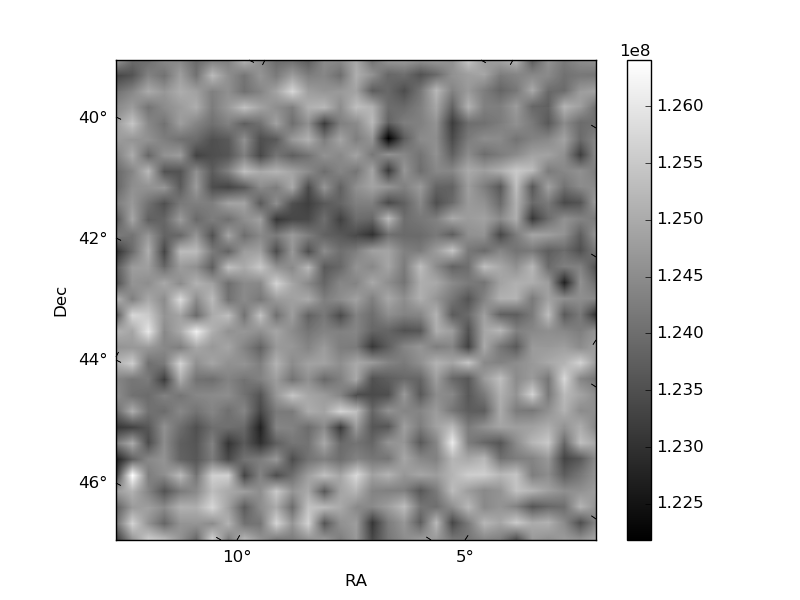
Histogram calculated using DETX and DETY for each event in the final _common_clean file
| Quadrant A | 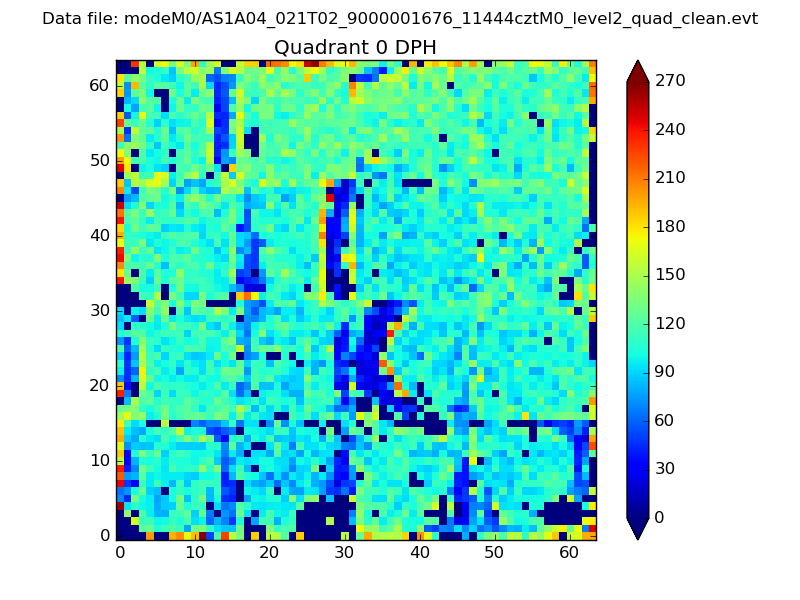 |
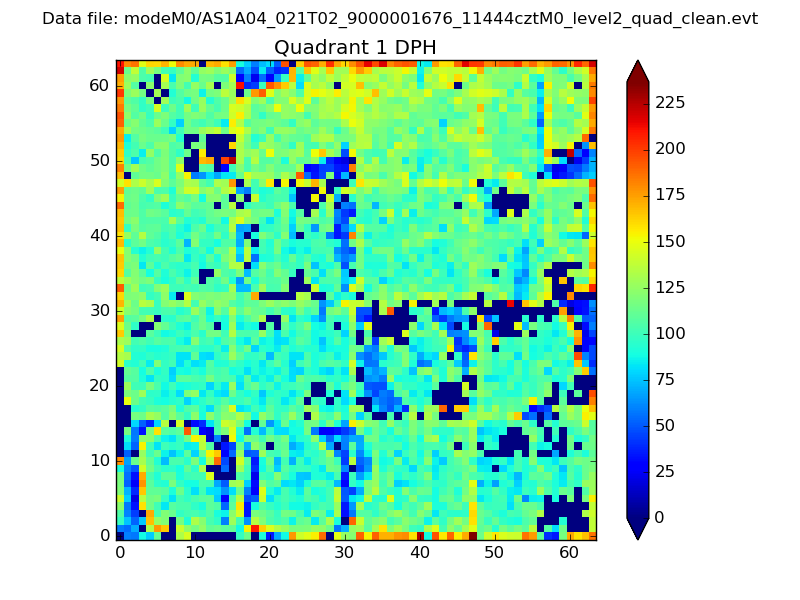 |
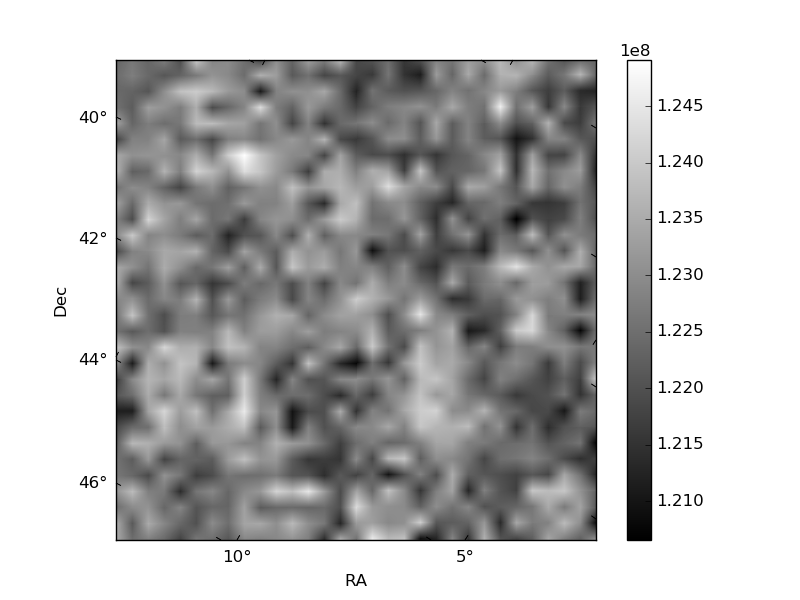
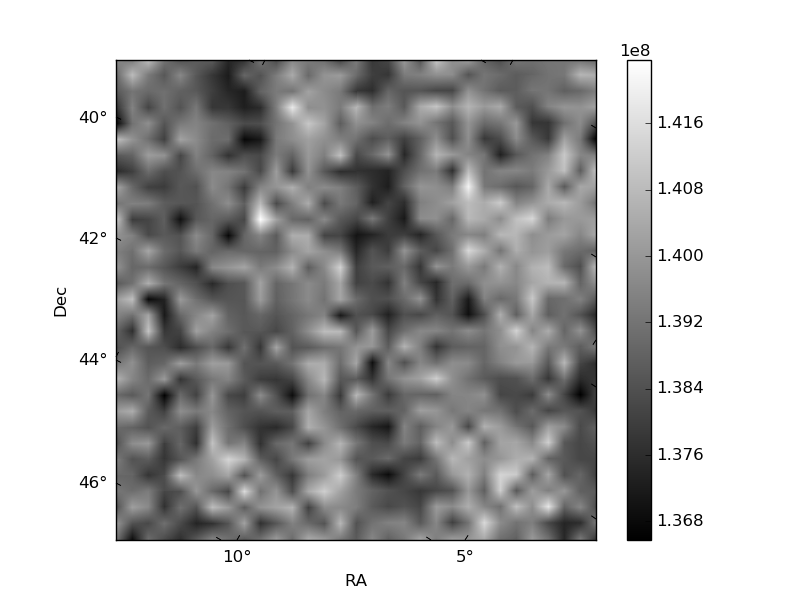
Quadrant B |
|---|---|---|---|
| Quadrant D | 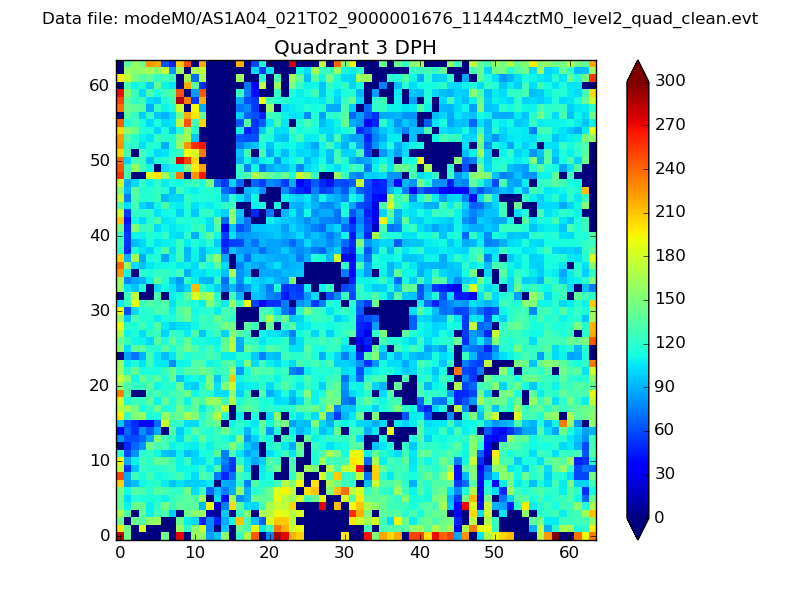 |
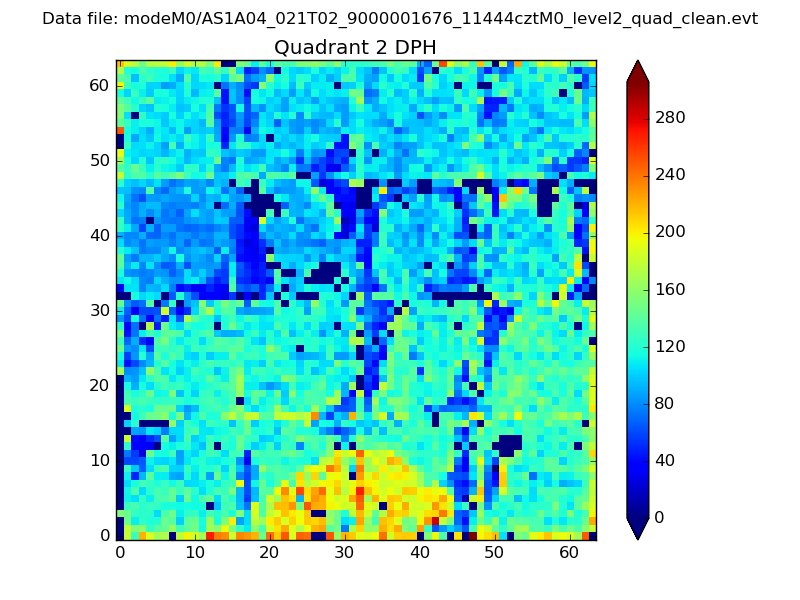 |
Quadrant C |
| Plot type | Count rate plots | Images |
|---|---|---|
| Comparison with Poisson distribution Blue bars denote a histogram of data divided into 1 sec bins. Red curve is a Poisson curve with rate = median count rate of data. |
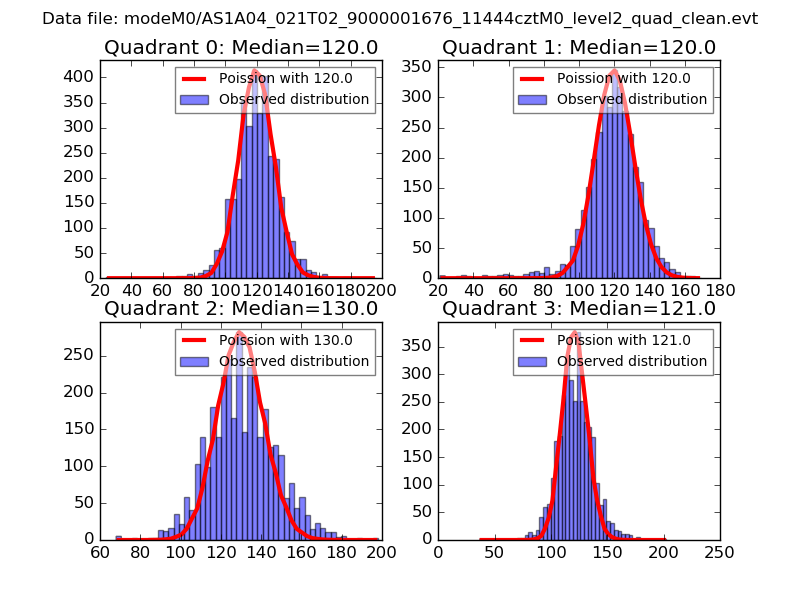 |
 |
| Quadrant-wise count rates Data is divided into 100 sec bins |
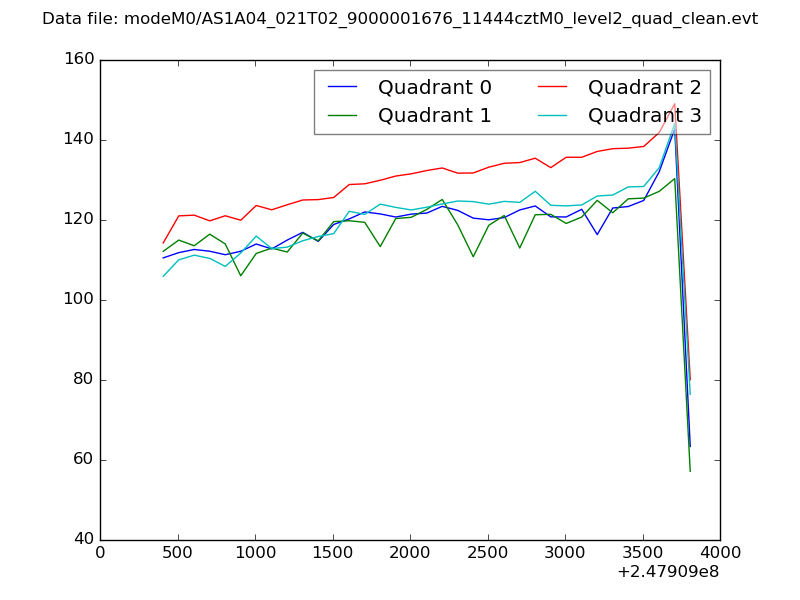 |
|
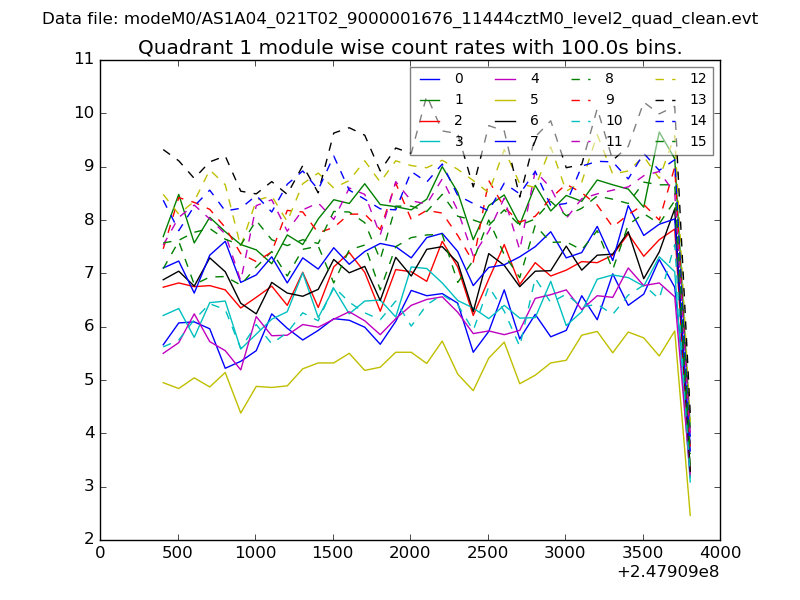
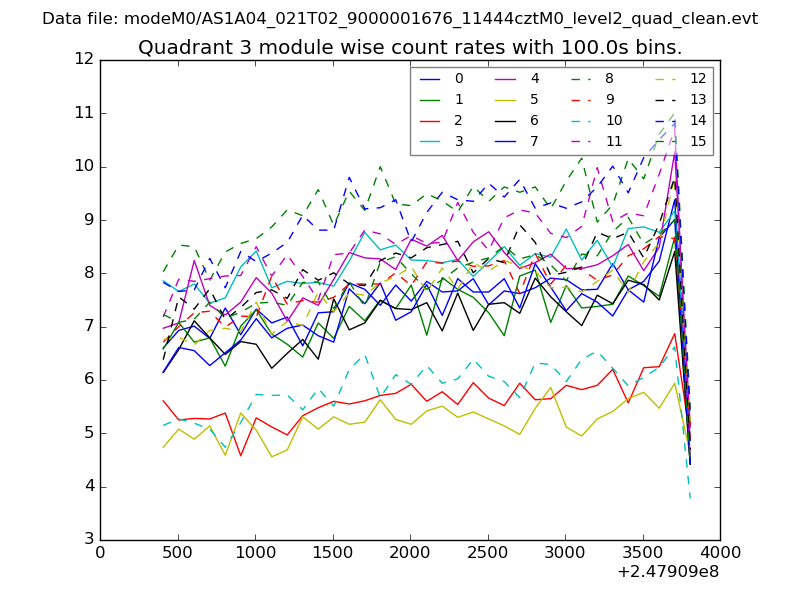
| Module-wise count rates for Quadrant A Data is divided into 100 sec bins |
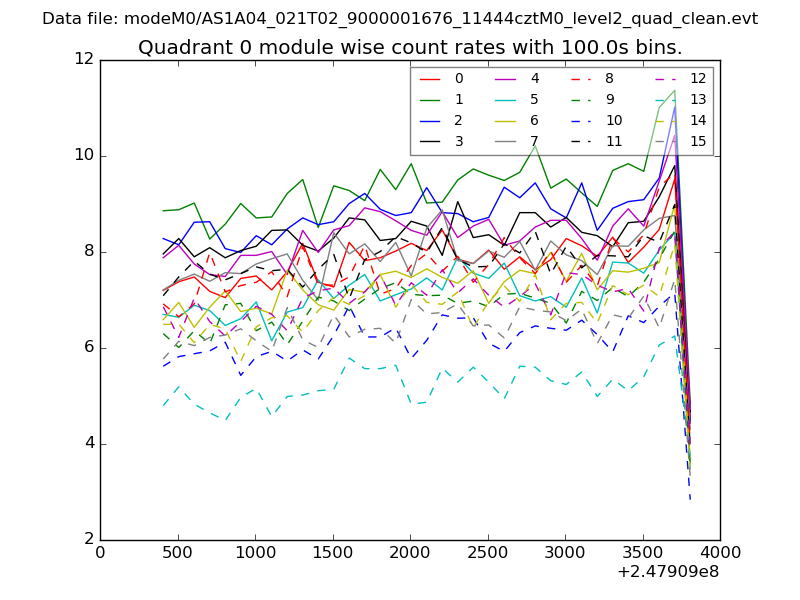 |
 |
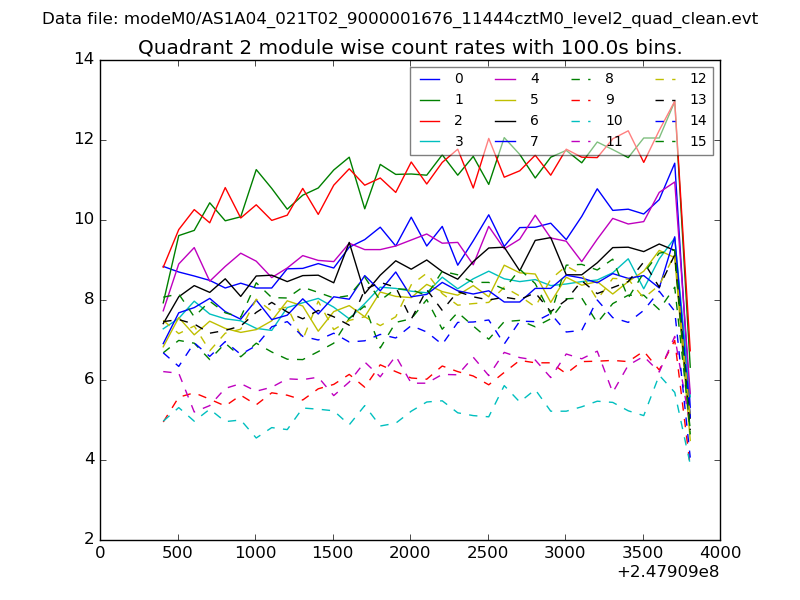
| Module-wise count rates for Quadrant B Data is divided into 100 sec bins |
 |
 |
| Module-wise count rates for Quadrant C Data is divided into 100 sec bins |
 |
 |
| Module-wise count rates for Quadrant D Data is divided into 100 sec bins |
 |
 |
| Parameter | Plot |
|---|---|
| CZT HV Monitor | 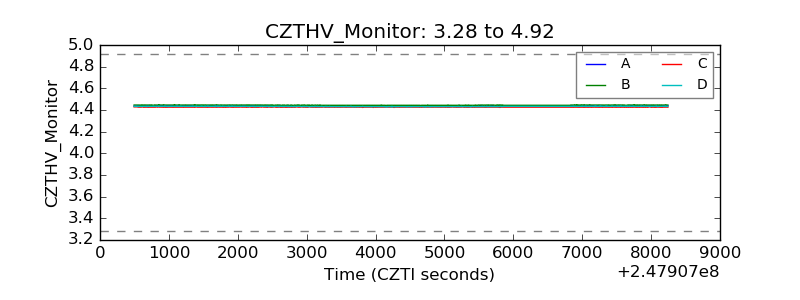 |
| D_VDD | 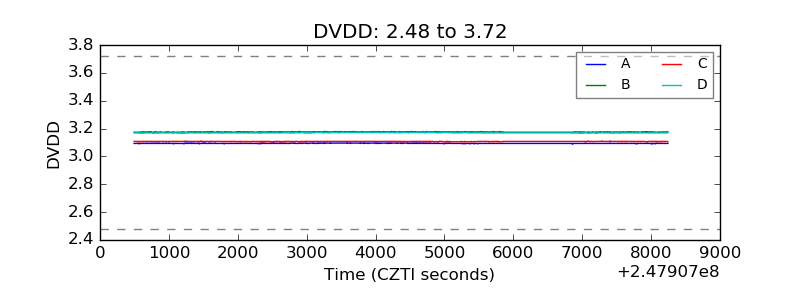 |
| Temperature 1 |  |
| Veto HV Monitor | 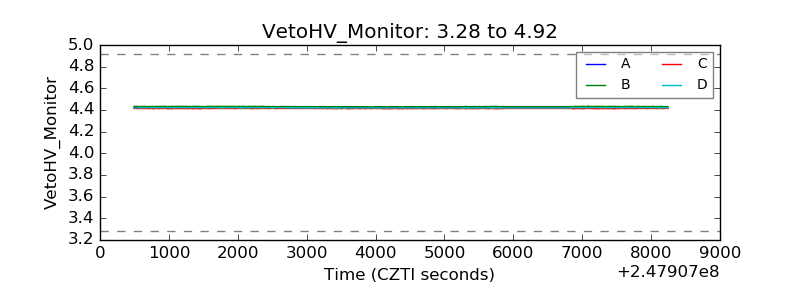 |
| Veto LLD | 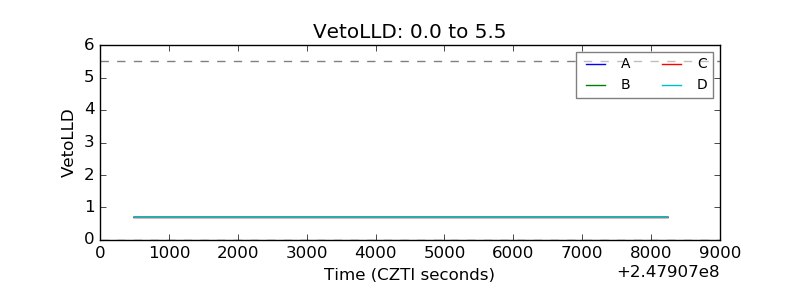 |
| Alpha Counter | 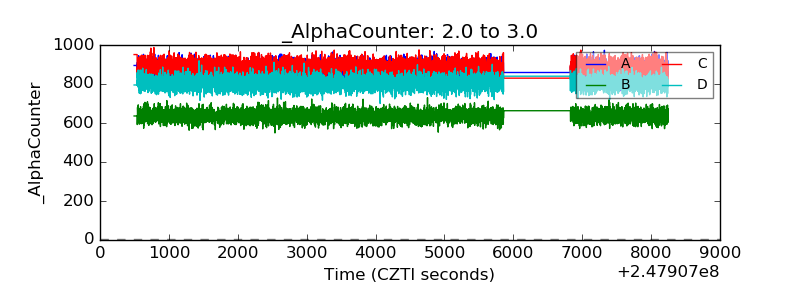 |
| _CPM_Rate | 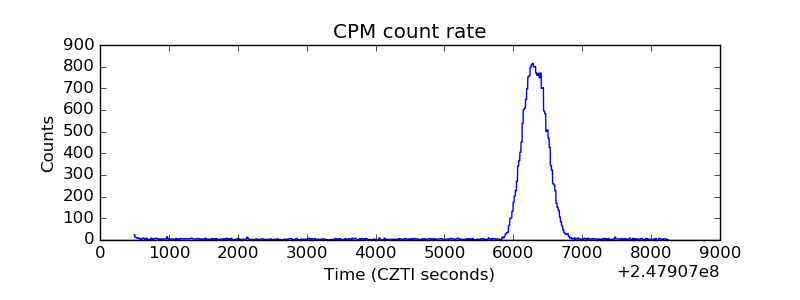 |
| CZT Counter | 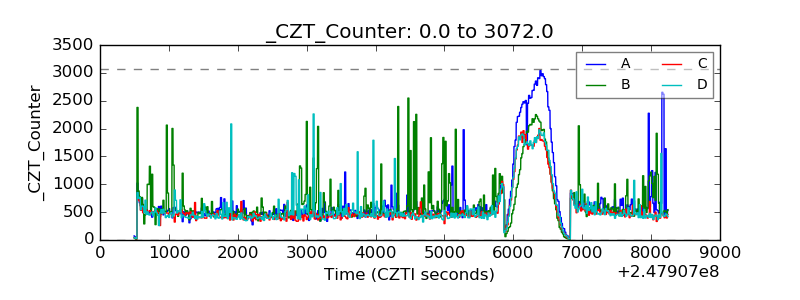 |
| +2.5 Volts monitor |  |
| +5 Volts monitor |  |
| _ROLL_ROT | 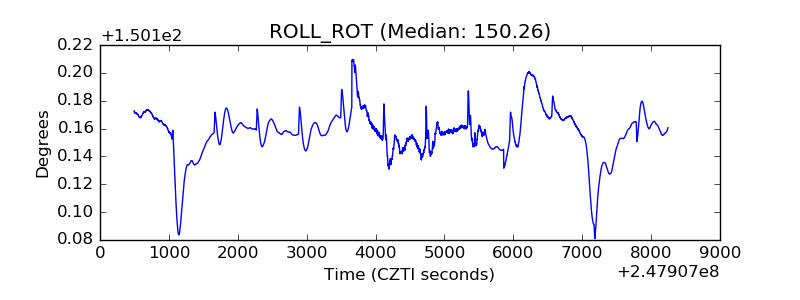 |
| _Roll_DEC | 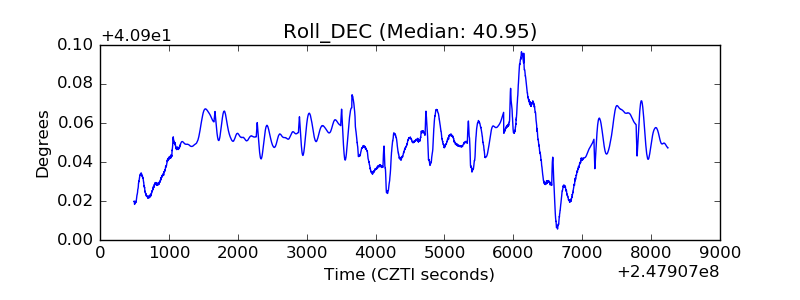 |
| _Roll_RA | 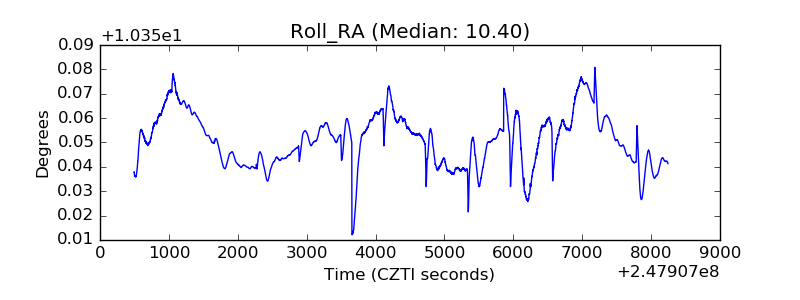 |
| Veto Counter | 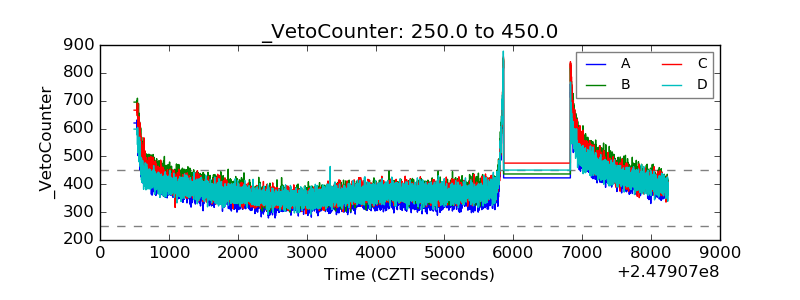 |