| Param | Original file | Final file |
|---|---|---|
| Filename | modeM0/AS1A04_021T02_9000001676_11447cztM0_level2.evt | modeM0/AS1A04_021T02_9000001676_11447cztM0_level2_quad_clean.evt |
| Size (bytes) | 499,262,400 | 98,323,200 |
| Size | 476.1 MB | 93.8 MB |
| Events in quadrant A | 3,402,629 | 631,248 |
| Events in quadrant B | 4,650,673 | 618,600 |
| Events in quadrant C | 3,108,699 | 662,183 |
| Events in quadrant D | 3,525,062 | 620,223 |
| Mode M9 | |||
|---|---|---|---|
| Quadrant | BADHDUFLAG | Total packets | Discarded packets |
| A | 0 | 11 | 0 |
| B | 0 | 11 | 0 |
| C | 0 | 11 | 0 |
| D | 0 | 11 | 0 |
| Mode SS | |||
|---|---|---|---|
| Quadrant | BADHDUFLAG | Total packets | Discarded packets |
| A | 0 | 130 | 0 |
| B | 0 | 130 | 0 |
| C | 0 | 130 | 0 |
| D | 0 | 130 | 0 |
| Mode M0 | |||
|---|---|---|---|
| Quadrant | BADHDUFLAG | Total packets | Discarded packets |
| A | 0 | 13970 | 2 |
| B | 0 | 18103 | 1 |
| C | 0 | 13198 | 1 |
| D | 0 | 14534 | 1 |
| Quadrant | Total seconds | Saturated seconds | Saturation percentage |
|---|---|---|---|
| A | 6381 | 104 | 1.629839% |
| B | 6381 | 403 | 6.315625% |
| C | 6381 | 78 | 1.222379% |
| D | 6381 | 119 | 1.864911% |
Noise dominated data is calculated using 1-second bins in cleaned event files. If a bin has >2000 counts, and if more than 50% of those come from <1% of pixels, then it is considered to be noise-dominated and hence unusable.
| Quadrant | # 1 sec bins | Bins with >0 counts | Bins with >2000 counts | High rate bins dominated by noise | Noise dominated (total time) | Noise dominated (detector-on time) | Marked lightcurve |
|---|---|---|---|---|---|---|---|
| A | 7572 | 6382 | 0 | 0 | 0.00% | 0.00% |  |
| B | 7572 | 6382 | 196 | 196 | 2.59% | 3.07% |  |
| C | 7572 | 6383 | 1 | 1 | 0.01% | 0.02% | 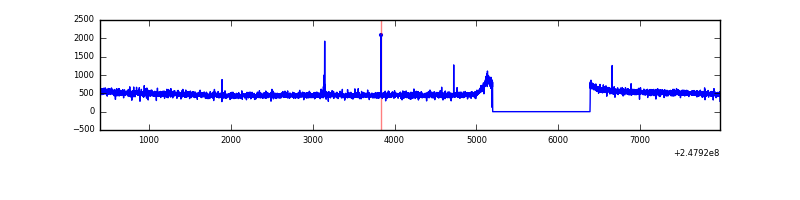 |
| D | 7572 | 6382 | 23 | 23 | 0.30% | 0.36% |  |
Top three noisy pixels from each quadrant. If the there are fewer than three noisy pixels in the level2.evt file, extra rows are filled as -1
| Pixel properties | Quadrant properties | ||||||
|---|---|---|---|---|---|---|---|
| Quadrant | DetID | PixID | Counts | Sigma | Mean | Median | Sigma |
| A | 1 | 162 | 90806 | 545.31 | 818 | 802 | 165.1 |
| A | 1 | 178 | 50378 | 300.37 | 818 | 802 | 165.1 |
| A | 1 | 161 | 42533 | 252.84 | 818 | 802 | 165.1 |
| B | 4 | 239 | 1196655 | 7965.88 | 795 | 777 | 150.1 |
| B | 15 | 204 | 172444 | 1143.49 | 795 | 777 | 150.1 |
| B | 11 | 51 | 65922 | 433.94 | 795 | 777 | 150.1 |
| C | 14 | 234 | 7262 | 35.28 | 795 | 802 | 183.1 |
| C | 13 | 61 | 5892 | 27.8 | 795 | 802 | 183.1 |
| C | 12 | 4 | 3070 | 12.39 | 795 | 802 | 183.1 |
| D | 1 | 52 | 138372 | 732.95 | 794 | 774 | 187.7 |
| D | 13 | 249 | 62669 | 329.7 | 794 | 774 | 187.7 |
| D | 13 | 104 | 50761 | 266.27 | 794 | 774 | 187.7 |
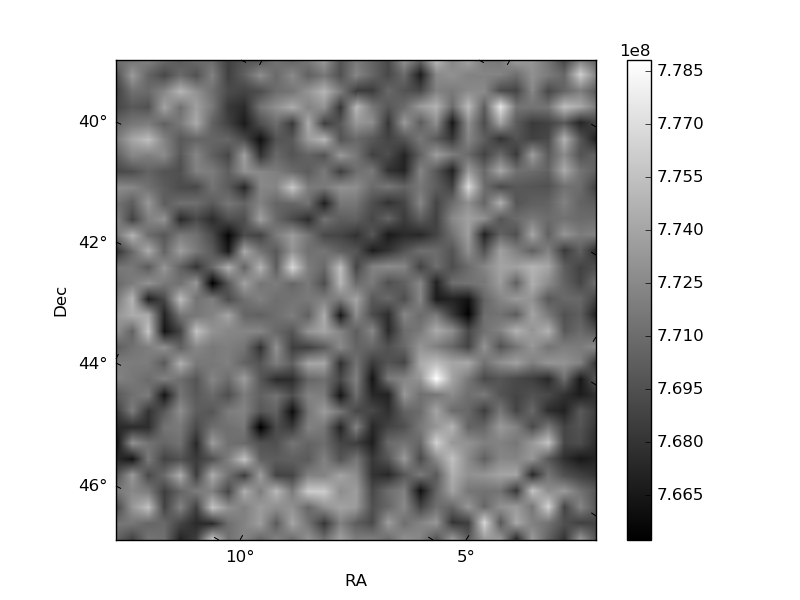
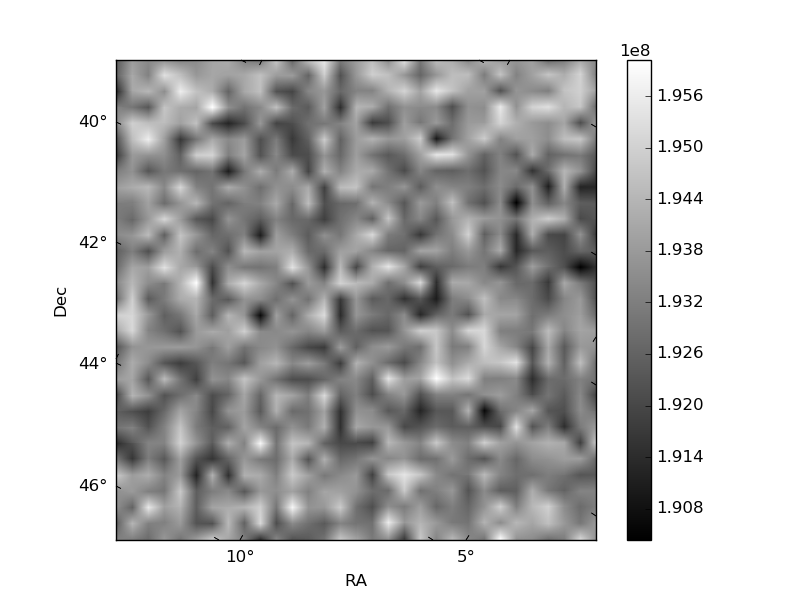
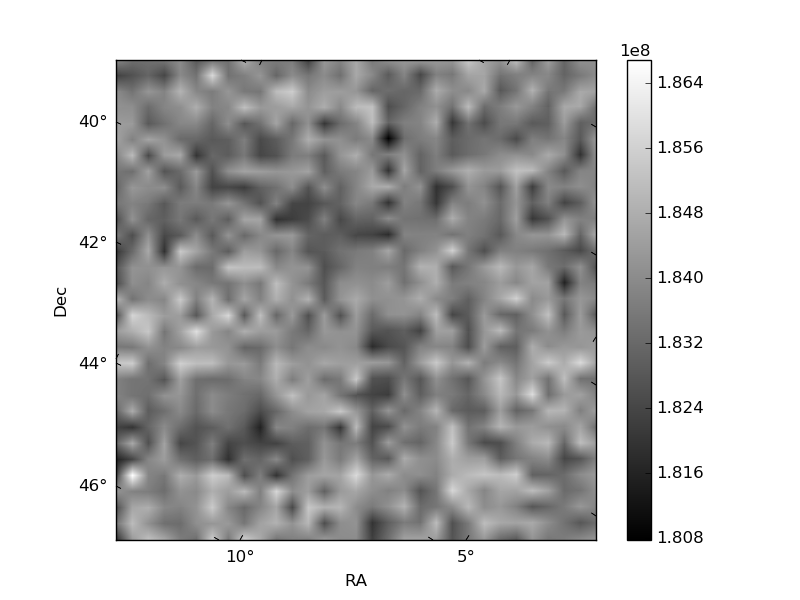
Histogram calculated using DETX and DETY for each event in the final _common_clean file
| Quadrant A | 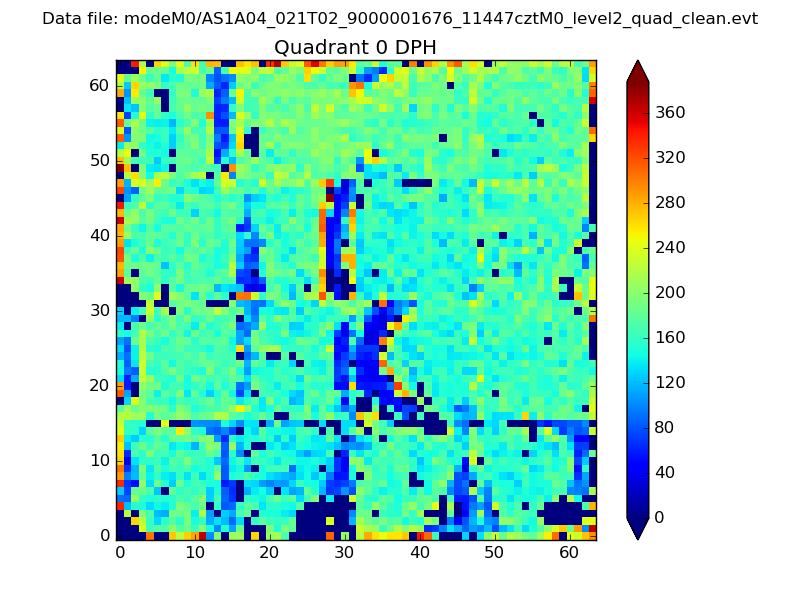 |
 |
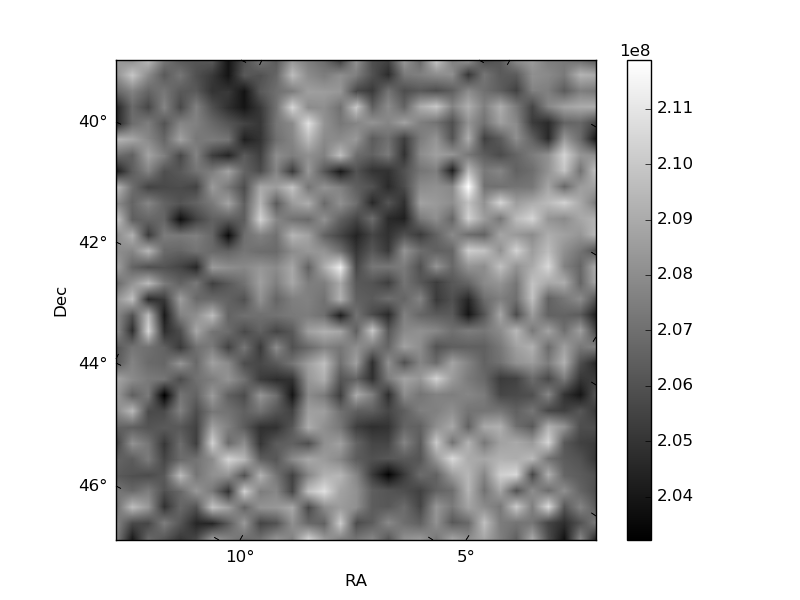
Quadrant B |
|---|---|---|---|
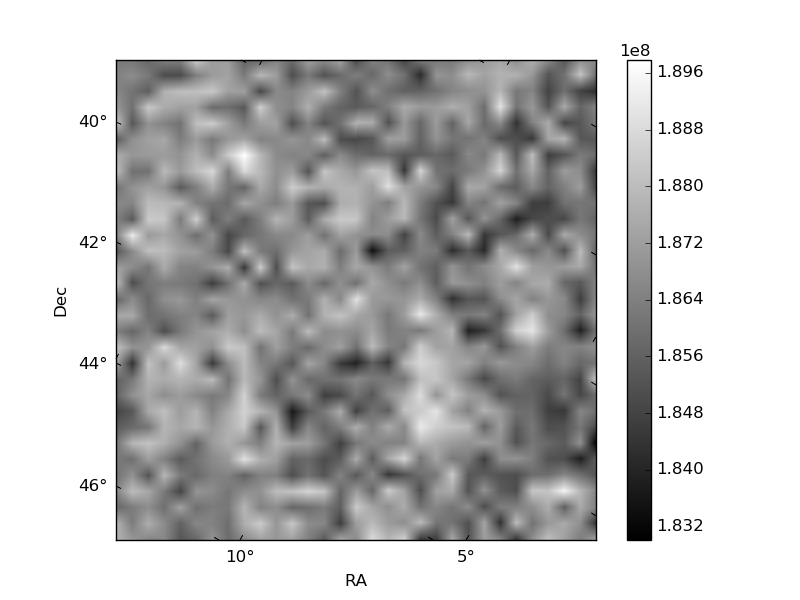
| Quadrant D | 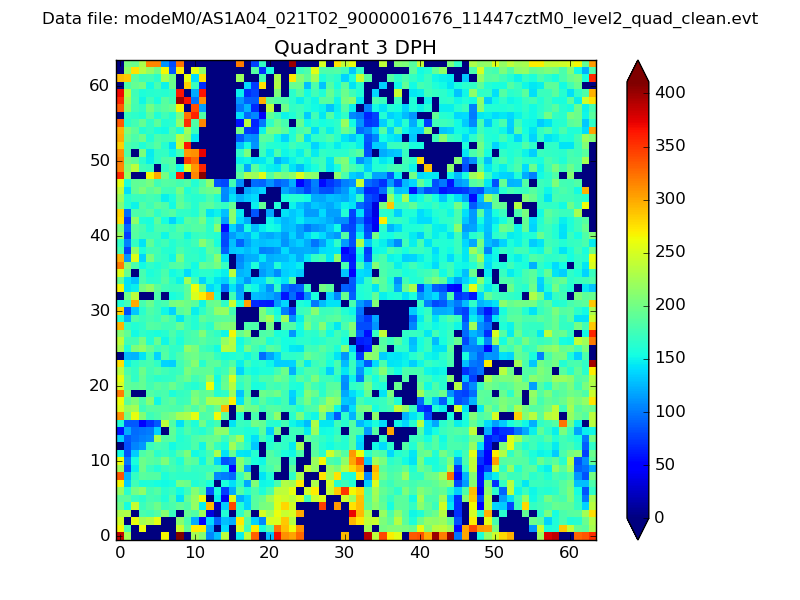 |
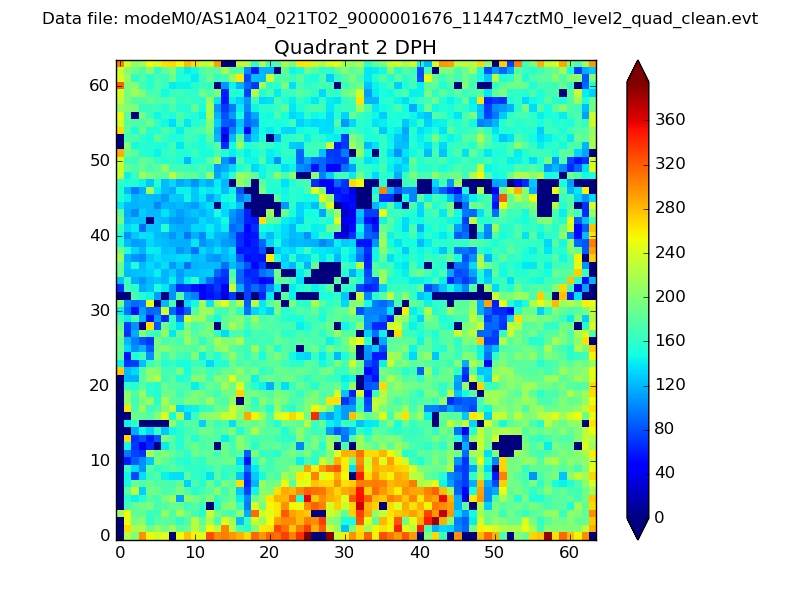 |
Quadrant C |
| Plot type | Count rate plots | Images |
|---|---|---|
| Comparison with Poisson distribution Blue bars denote a histogram of data divided into 1 sec bins. Red curve is a Poisson curve with rate = median count rate of data. |
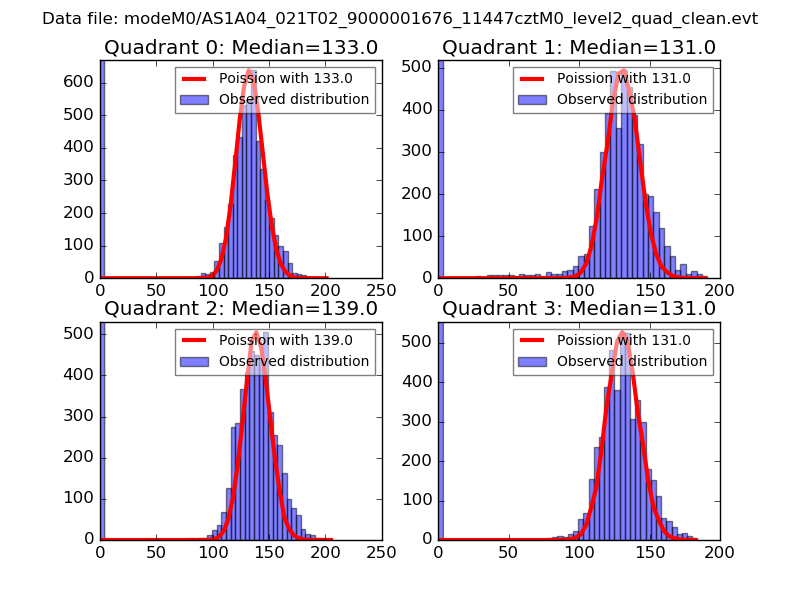 |
 |
| Quadrant-wise count rates Data is divided into 100 sec bins |
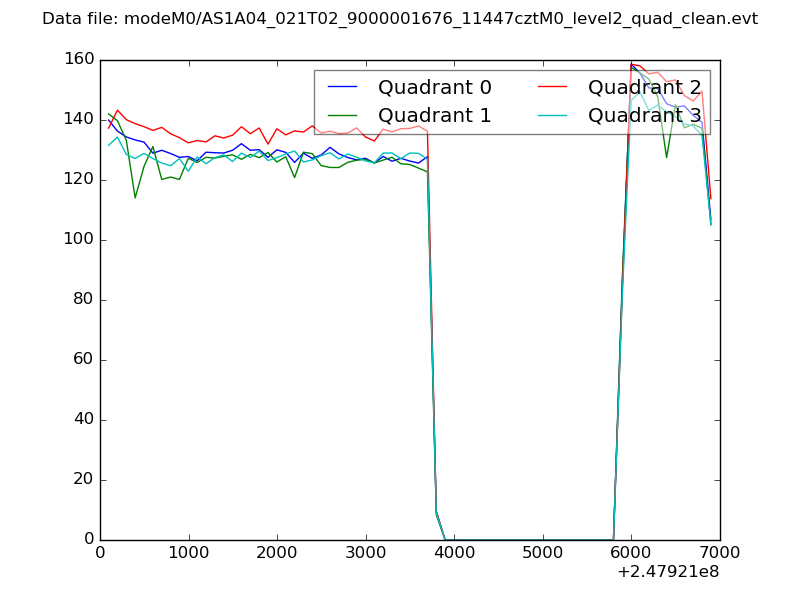 |
|
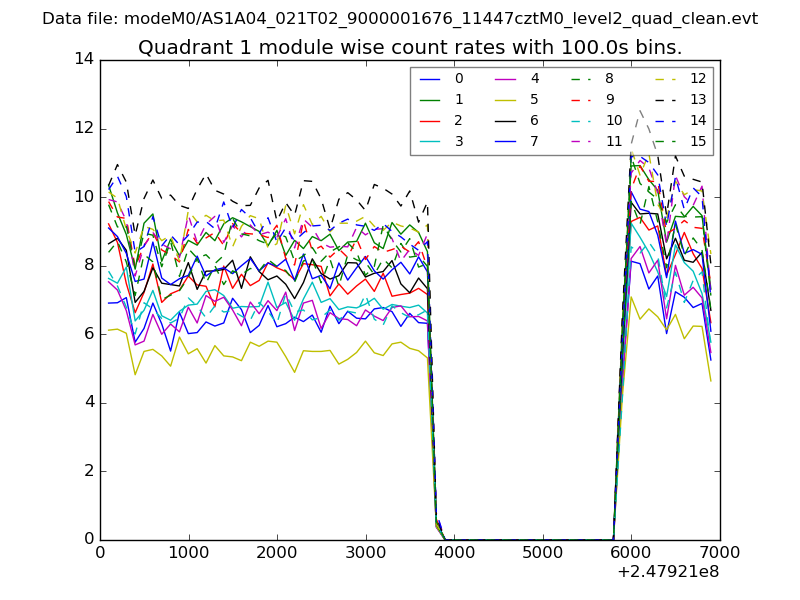
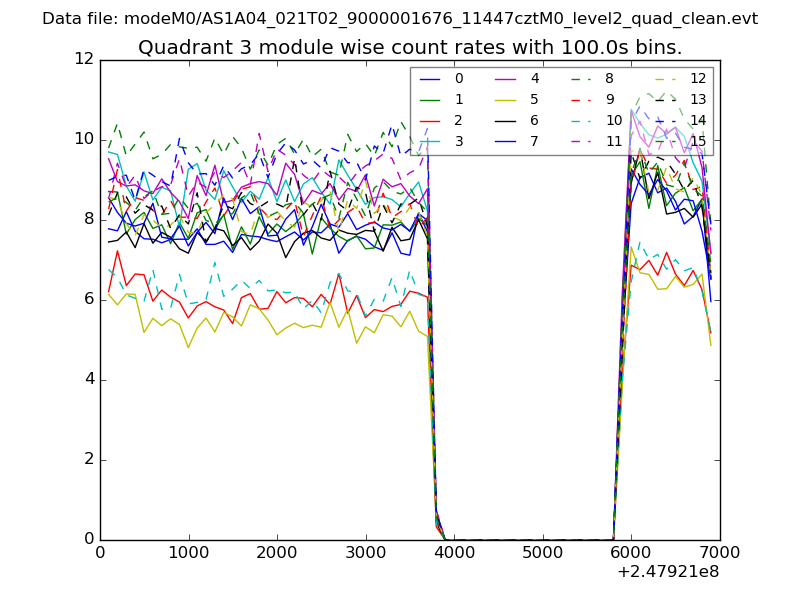
| Module-wise count rates for Quadrant A Data is divided into 100 sec bins |
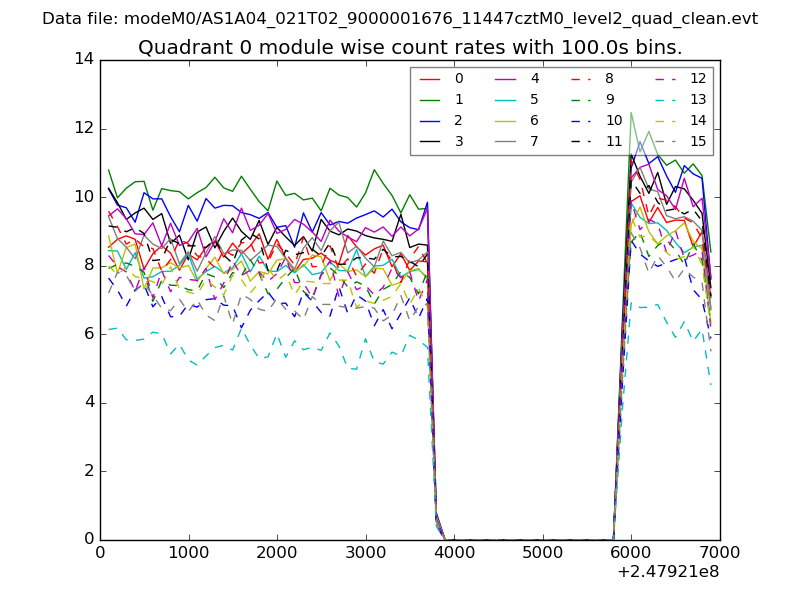 |
 |
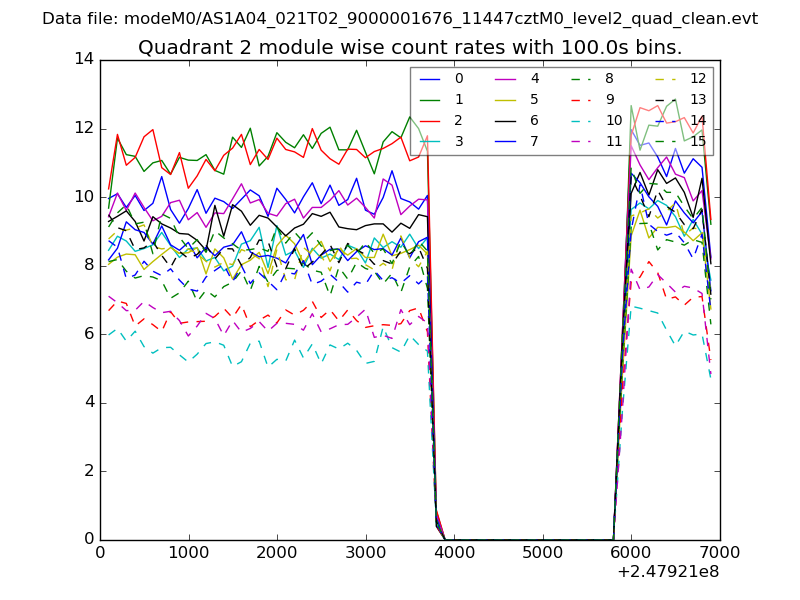
| Module-wise count rates for Quadrant B Data is divided into 100 sec bins |
 |
 |
| Module-wise count rates for Quadrant C Data is divided into 100 sec bins |
 |
 |
| Module-wise count rates for Quadrant D Data is divided into 100 sec bins |
 |
 |
| Parameter | Plot |
|---|---|
| CZT HV Monitor | 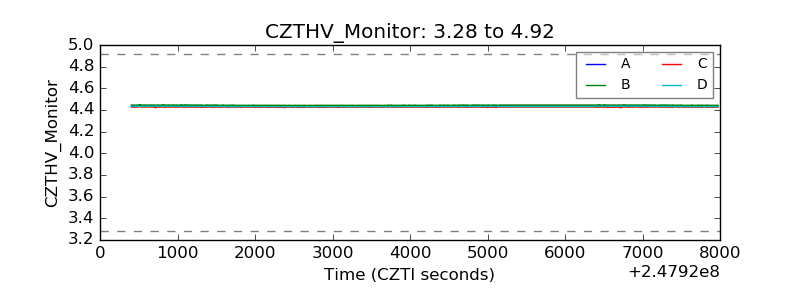 |
| D_VDD | 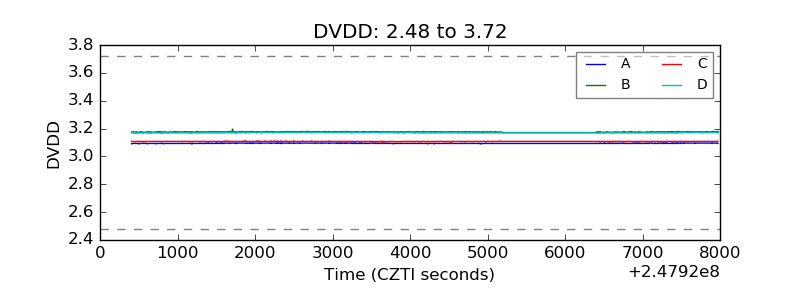 |
| Temperature 1 | 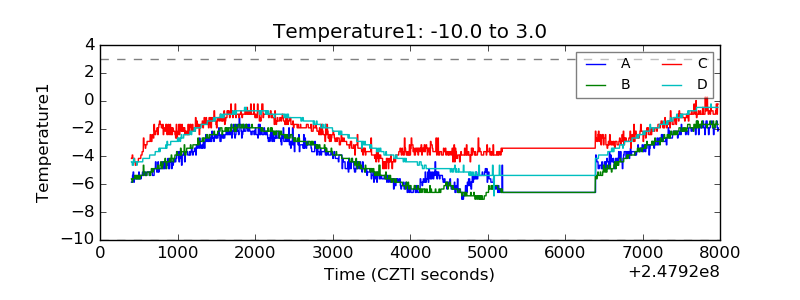 |
| Veto HV Monitor | 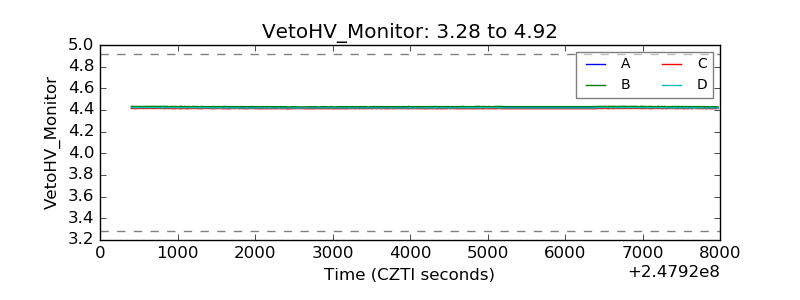 |
| Veto LLD |  |
| Alpha Counter | 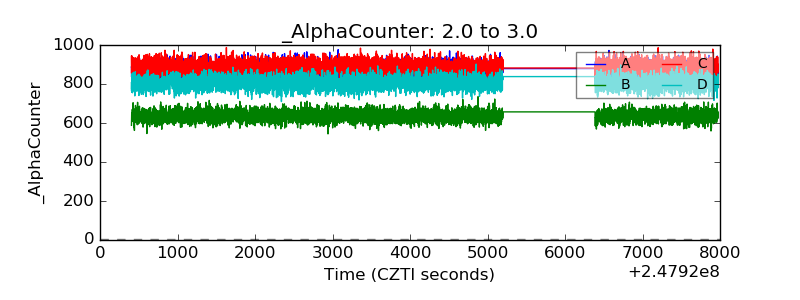 |
| _CPM_Rate | 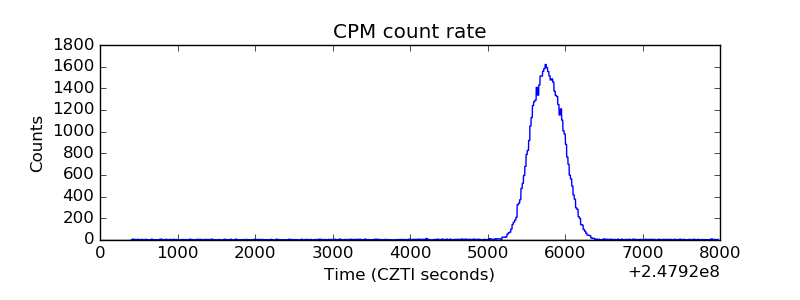 |
| CZT Counter | 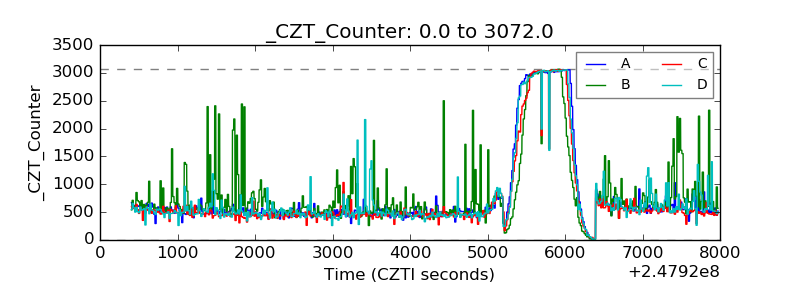 |
| +2.5 Volts monitor |  |
| +5 Volts monitor |  |
| _ROLL_ROT | 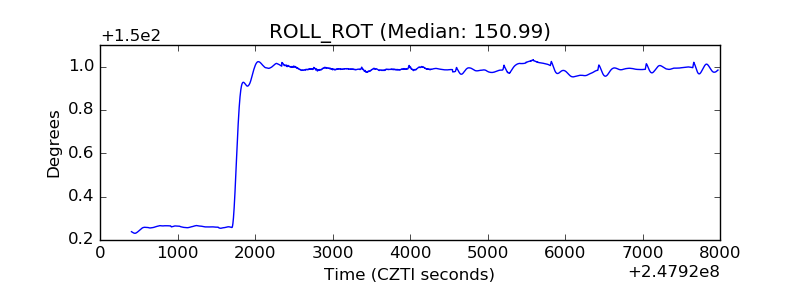 |
| _Roll_DEC | 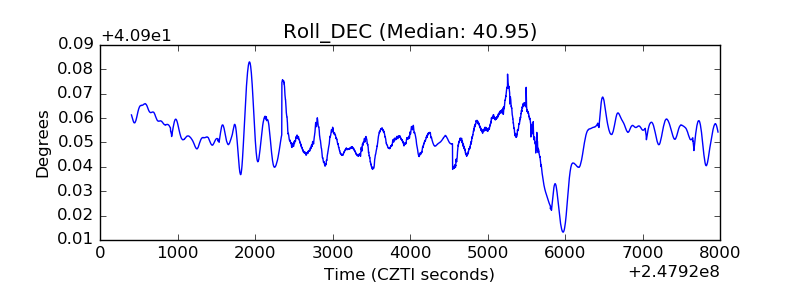 |
| _Roll_RA | 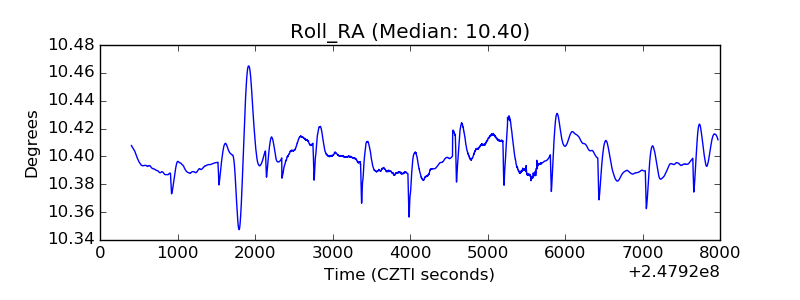 |
| Veto Counter | 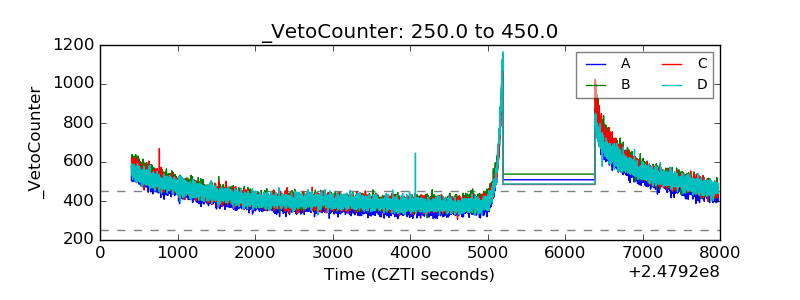 |