| Param | Original file | Final file |
|---|---|---|
| Filename | modeM0/AS1A04_021T02_9000001676_11448cztM0_level2.evt | modeM0/AS1A04_021T02_9000001676_11448cztM0_level2_quad_clean.evt |
| Size (bytes) | 538,940,160 | 110,551,680 |
| Size | 514.0 MB | 105.4 MB |
| Events in quadrant A | 3,682,240 | 724,817 |
| Events in quadrant B | 4,975,364 | 706,824 |
| Events in quadrant C | 3,281,427 | 756,054 |
| Events in quadrant D | 3,939,997 | 704,880 |
| Mode M9 | |||
|---|---|---|---|
| Quadrant | BADHDUFLAG | Total packets | Discarded packets |
| A | 0 | 14 | 0 |
| B | 0 | 14 | 0 |
| C | 0 | 14 | 0 |
| D | 0 | 15 | 0 |
| Mode SS | |||
|---|---|---|---|
| Quadrant | BADHDUFLAG | Total packets | Discarded packets |
| A | 0 | 132 | 0 |
| B | 0 | 132 | 0 |
| C | 0 | 132 | 0 |
| D | 0 | 132 | 0 |
| Mode M0 | |||
|---|---|---|---|
| Quadrant | BADHDUFLAG | Total packets | Discarded packets |
| A | 0 | 15229 | 3 |
| B | 0 | 19270 | 2 |
| C | 0 | 13746 | 2 |
| D | 0 | 15821 | 2 |
| Quadrant | Total seconds | Saturated seconds | Saturation percentage |
|---|---|---|---|
| A | 6534 | 106 | 1.622283% |
| B | 6534 | 485 | 7.422712% |
| C | 6534 | 78 | 1.193756% |
| D | 6534 | 150 | 2.295684% |
Noise dominated data is calculated using 1-second bins in cleaned event files. If a bin has >2000 counts, and if more than 50% of those come from <1% of pixels, then it is considered to be noise-dominated and hence unusable.
| Quadrant | # 1 sec bins | Bins with >0 counts | Bins with >2000 counts | High rate bins dominated by noise | Noise dominated (total time) | Noise dominated (detector-on time) | Marked lightcurve |
|---|---|---|---|---|---|---|---|
| A | 7795 | 6536 | 1 | 1 | 0.01% | 0.02% |  |
| B | 7795 | 6536 | 227 | 227 | 2.91% | 3.47% | 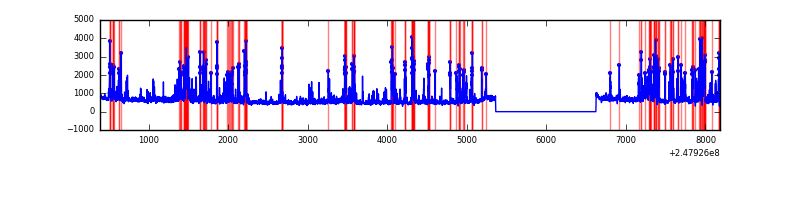 |
| C | 7795 | 6536 | 0 | 0 | 0.00% | 0.00% | 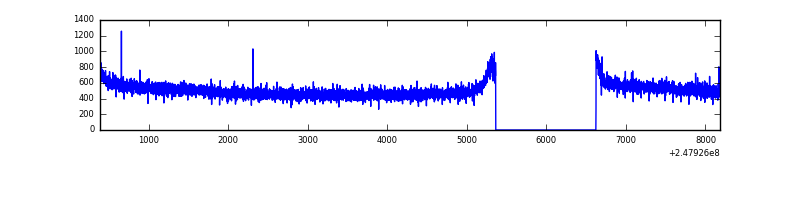 |
| D | 7795 | 6536 | 37 | 37 | 0.47% | 0.57% | 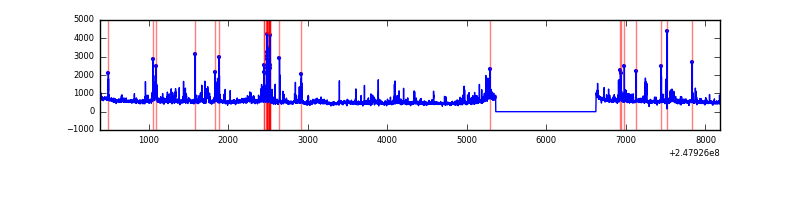 |
Top three noisy pixels from each quadrant. If the there are fewer than three noisy pixels in the level2.evt file, extra rows are filled as -1
| Pixel properties | Quadrant properties | ||||||
|---|---|---|---|---|---|---|---|
| Quadrant | DetID | PixID | Counts | Sigma | Mean | Median | Sigma |
| A | 1 | 162 | 124511 | 709.49 | 866 | 849 | 174.3 |
| A | 1 | 178 | 72573 | 411.5 | 866 | 849 | 174.3 |
| A | 1 | 161 | 60925 | 344.67 | 866 | 849 | 174.3 |
| B | 4 | 239 | 1297209 | 8279.38 | 836 | 816 | 156.6 |
| B | 11 | 51 | 197581 | 1256.63 | 836 | 816 | 156.6 |
| B | 15 | 204 | 123219 | 781.72 | 836 | 816 | 156.6 |
| C | 13 | 61 | 6266 | 27.95 | 842 | 851 | 193.7 |
| C | 3 | 202 | 2190 | 6.91 | 842 | 851 | 193.7 |
| C | -1 | -1 | -1 | -1.0 | 842 | 851 | 193.7 |
| D | 8 | 195 | 154604 | 776.87 | 841 | 820 | 198.0 |
| D | 1 | 52 | 139846 | 702.31 | 841 | 820 | 198.0 |
| D | 13 | 249 | 85913 | 429.86 | 841 | 820 | 198.0 |
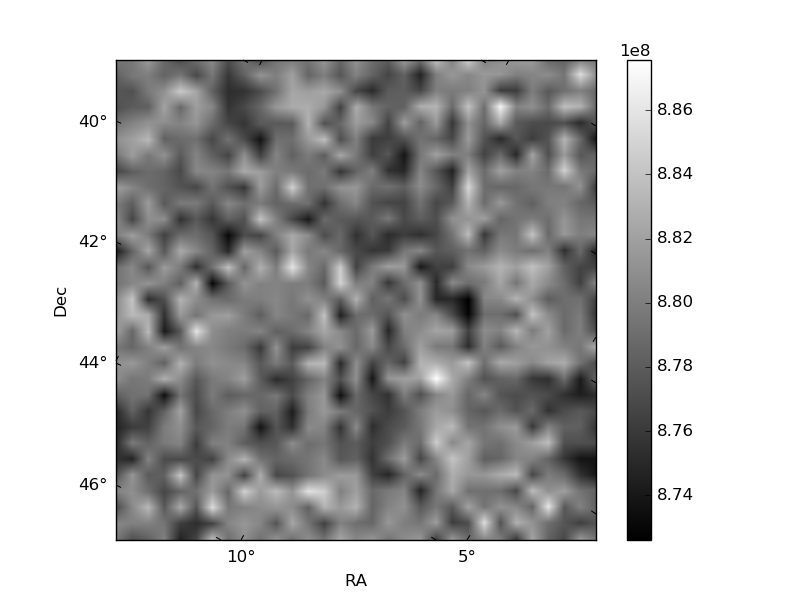
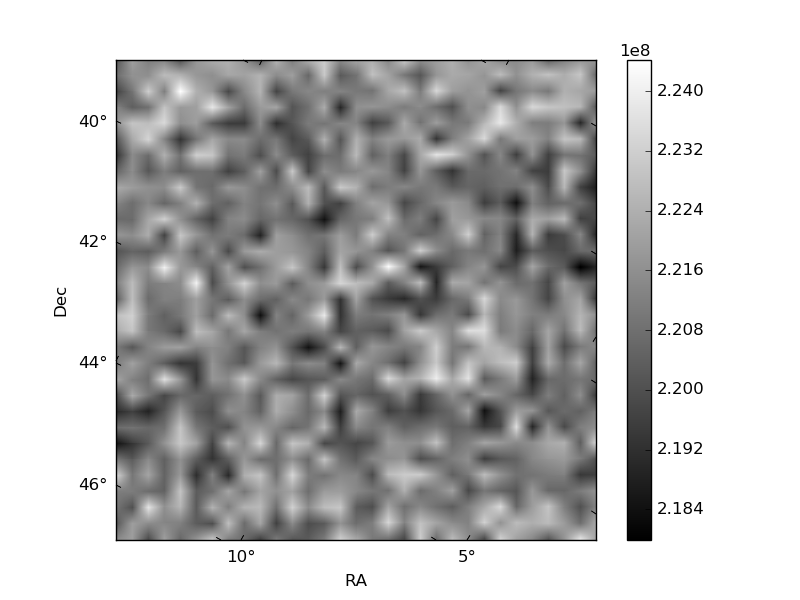
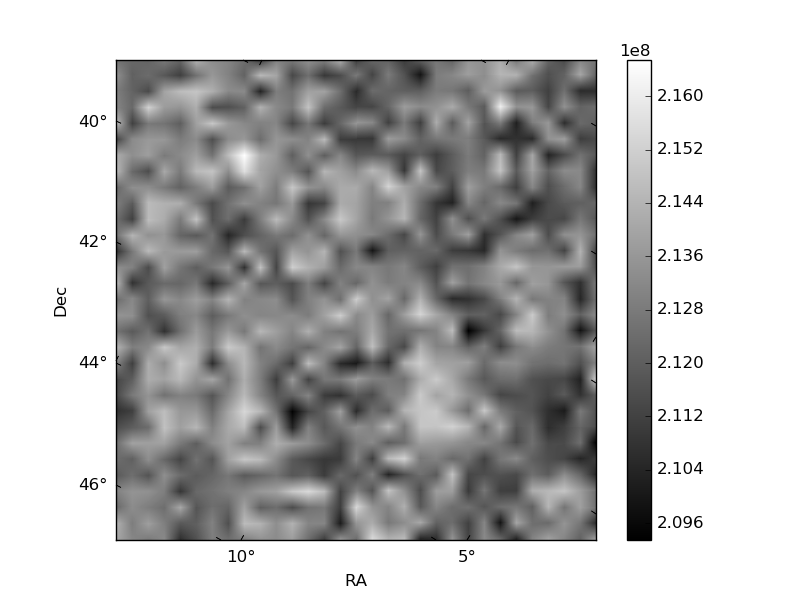
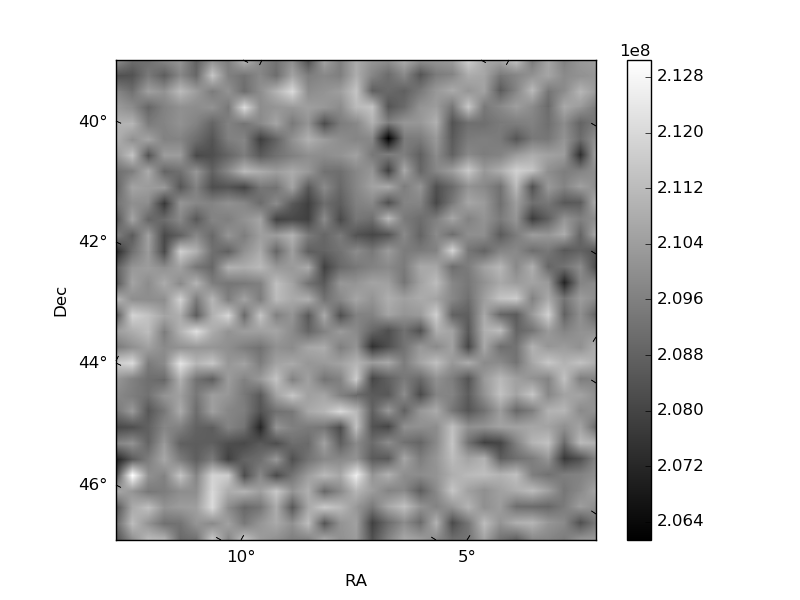
Histogram calculated using DETX and DETY for each event in the final _common_clean file
| Quadrant A | 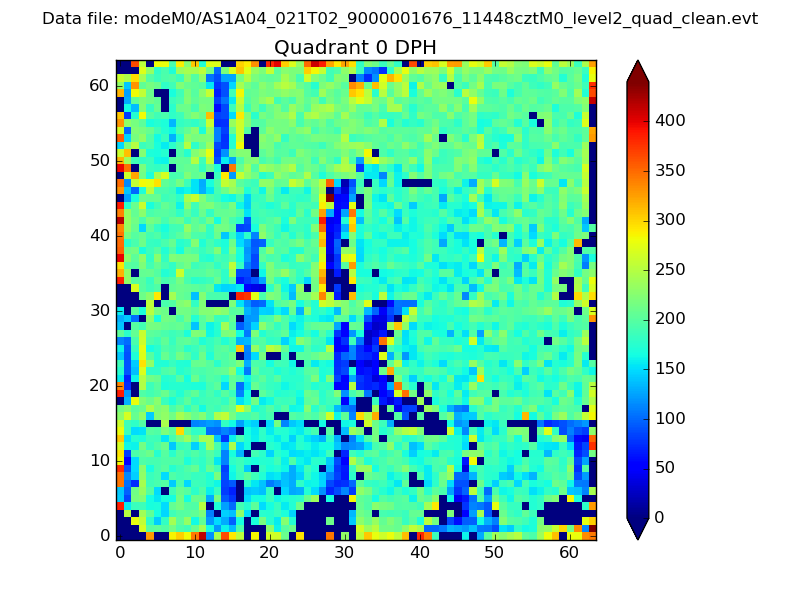 |
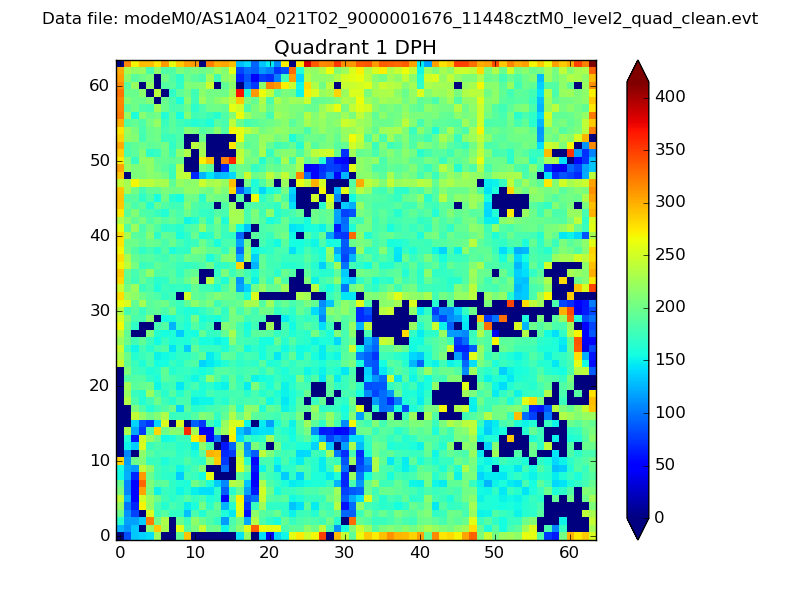 |
Quadrant B |
|---|---|---|---|
| Quadrant D | 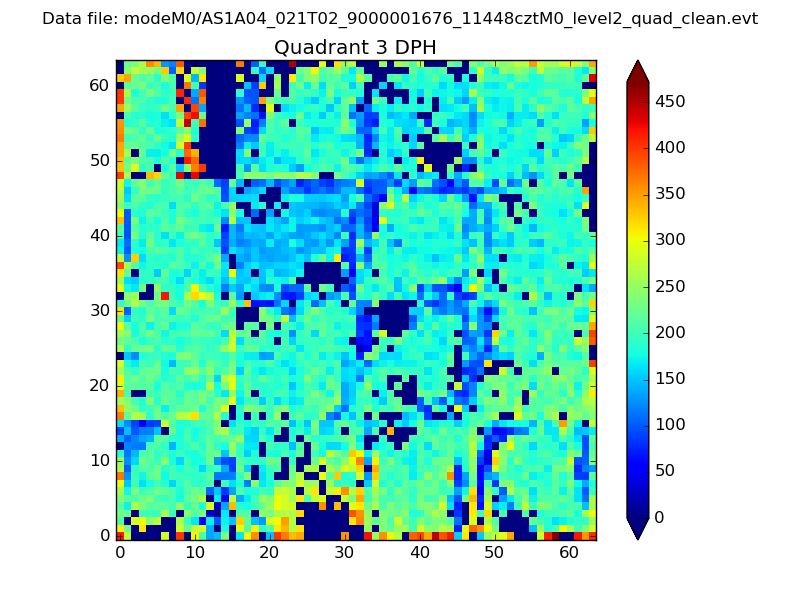 |
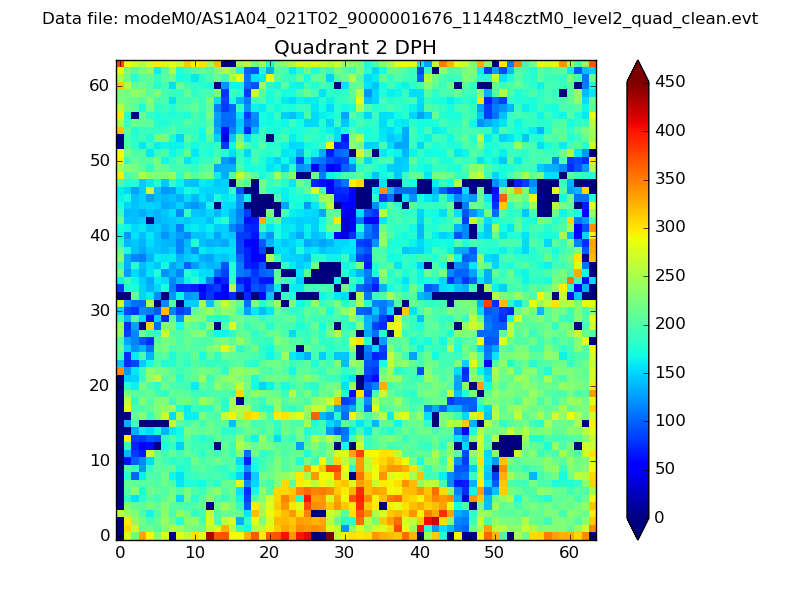 |
Quadrant C |
| Plot type | Count rate plots | Images |
|---|---|---|
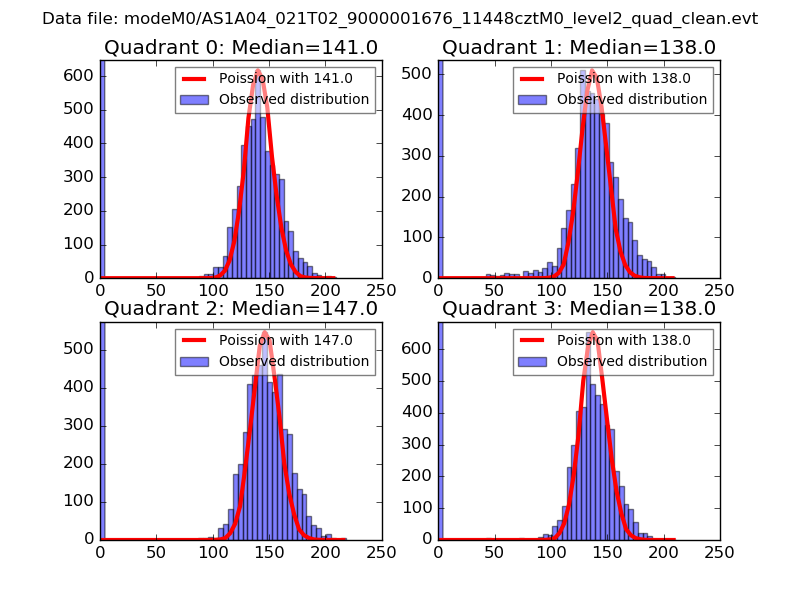
| Comparison with Poisson distribution Blue bars denote a histogram of data divided into 1 sec bins. Red curve is a Poisson curve with rate = median count rate of data. |
 |
 |
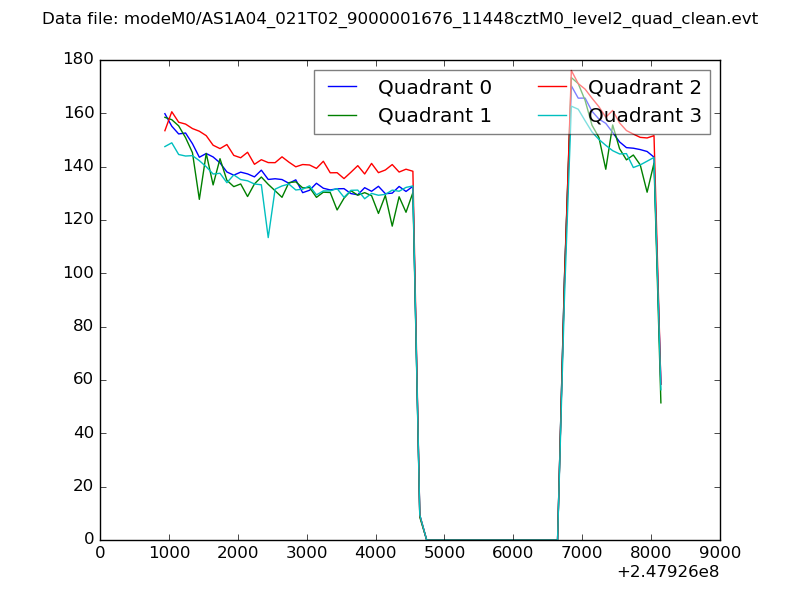
| Quadrant-wise count rates Data is divided into 100 sec bins |
 |
|
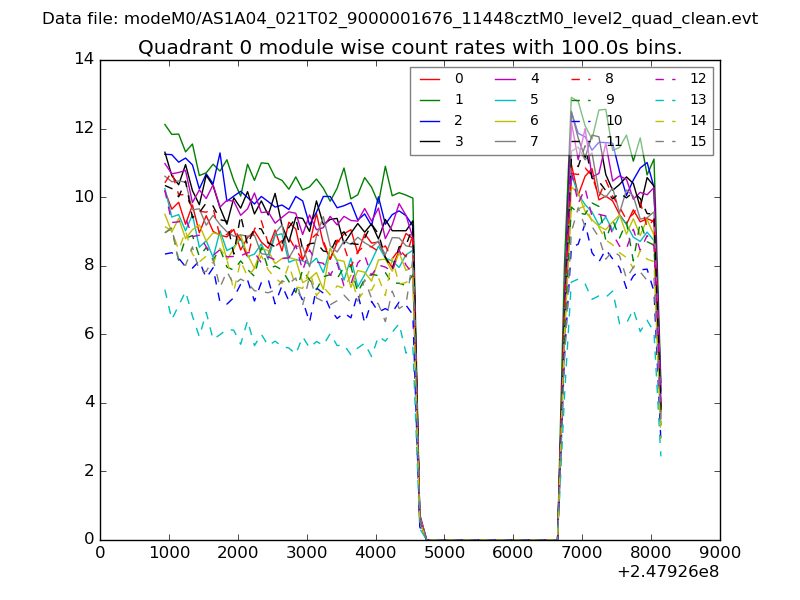
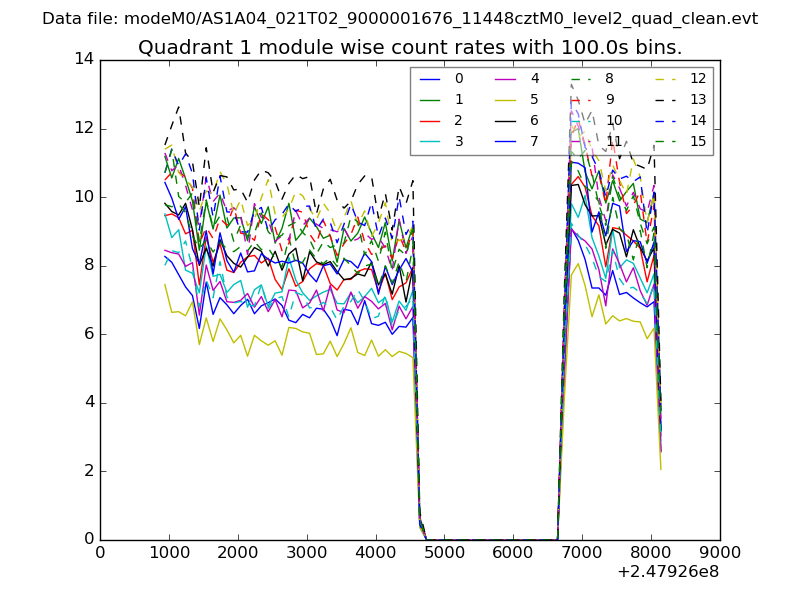
| Module-wise count rates for Quadrant A Data is divided into 100 sec bins |
 |
 |
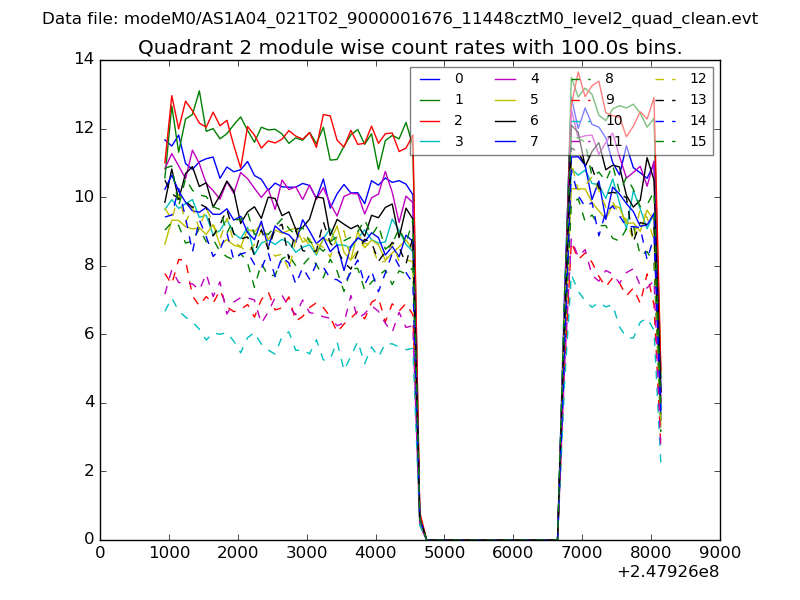
| Module-wise count rates for Quadrant B Data is divided into 100 sec bins |
 |
 |
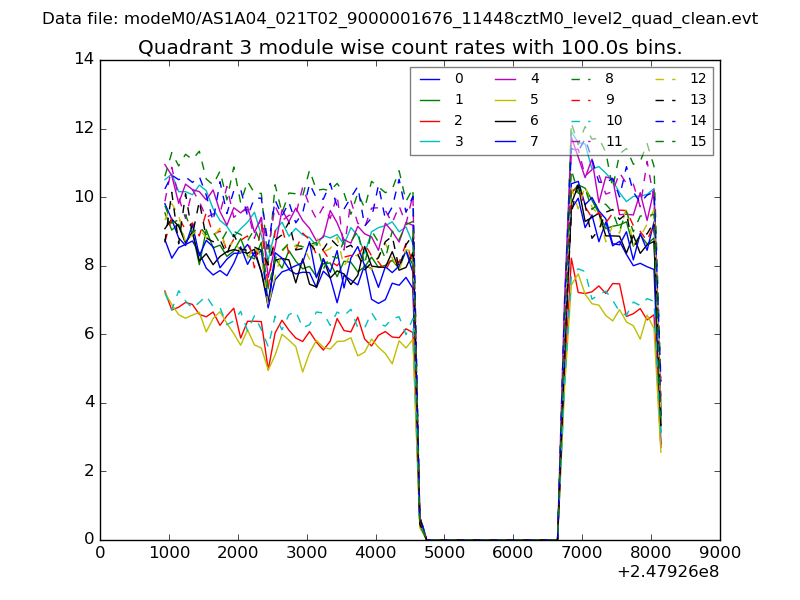
| Module-wise count rates for Quadrant C Data is divided into 100 sec bins |
 |
 |
| Module-wise count rates for Quadrant D Data is divided into 100 sec bins |
 |
 |
| Parameter | Plot |
|---|---|
| CZT HV Monitor | 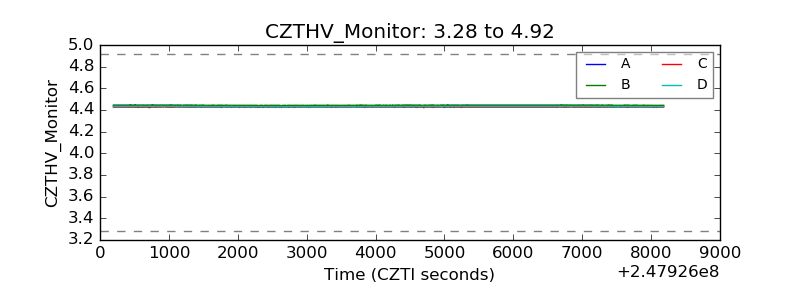 |
| D_VDD | 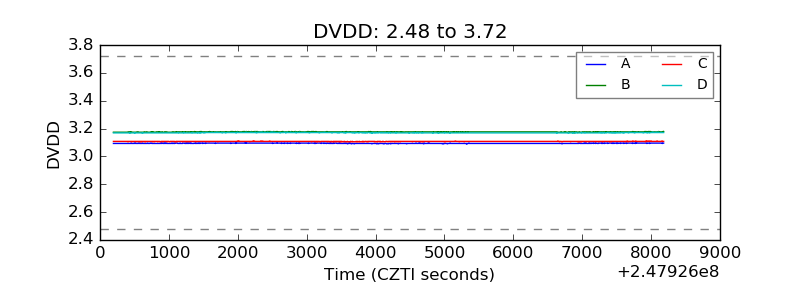 |
| Temperature 1 | 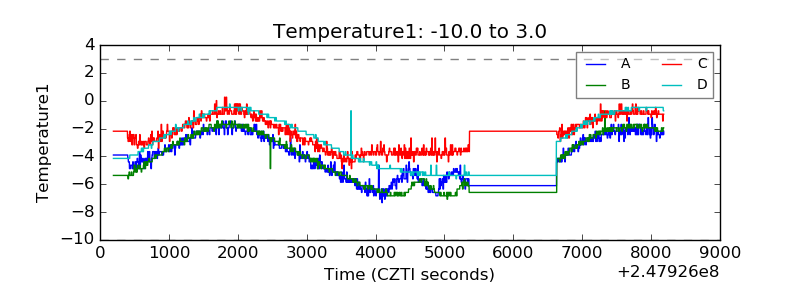 |
| Veto HV Monitor | 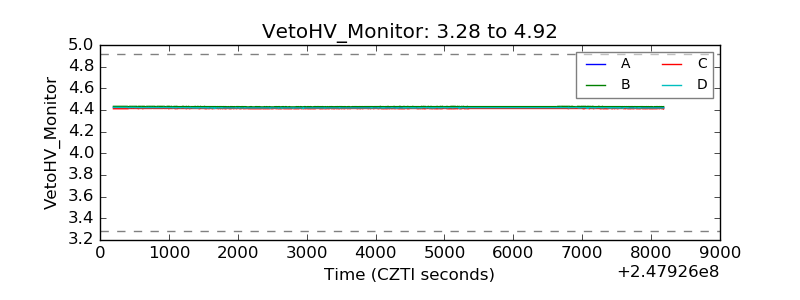 |
| Veto LLD | 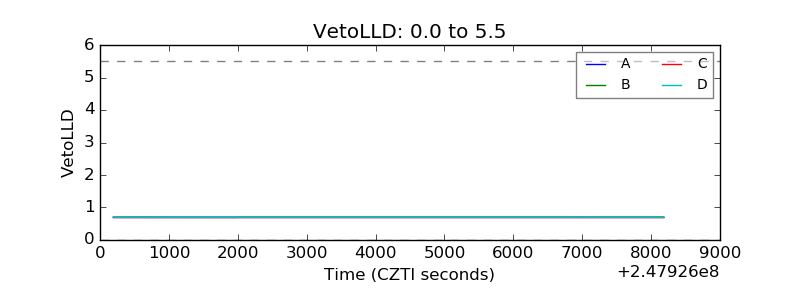 |
| Alpha Counter | 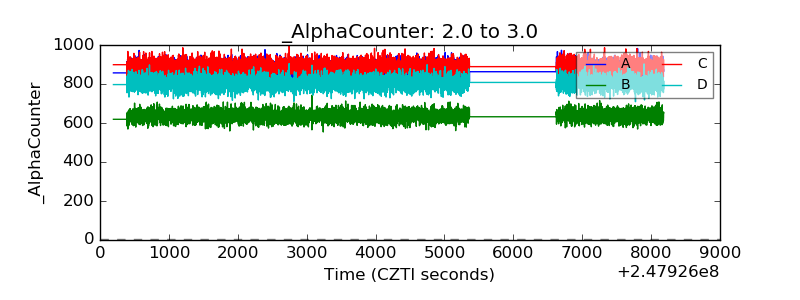 |
| _CPM_Rate | 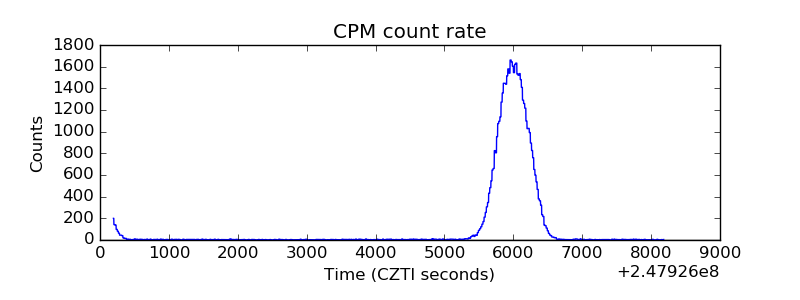 |
| CZT Counter | 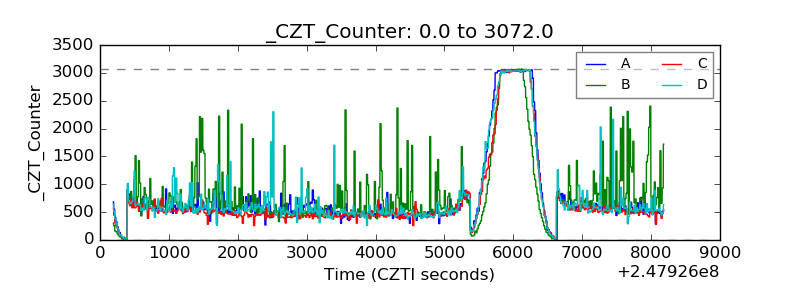 |
| +2.5 Volts monitor |  |
| +5 Volts monitor |  |
| _ROLL_ROT | 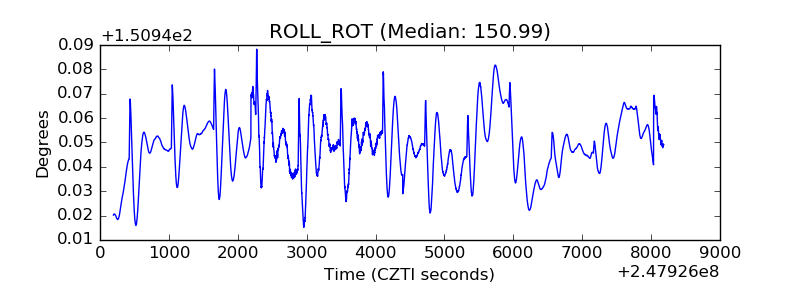 |
| _Roll_DEC | 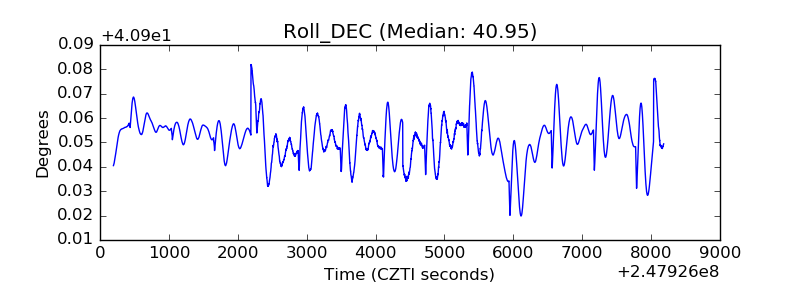 |
| _Roll_RA | 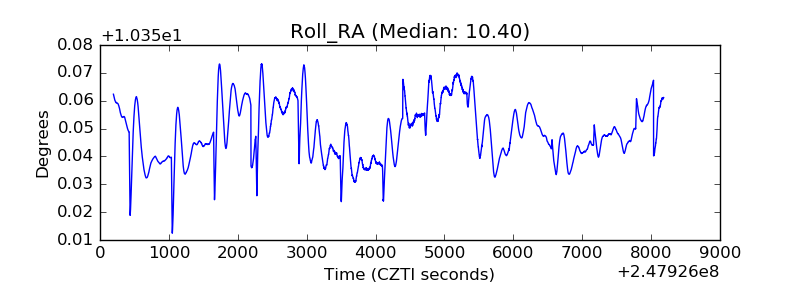 |
| Veto Counter | 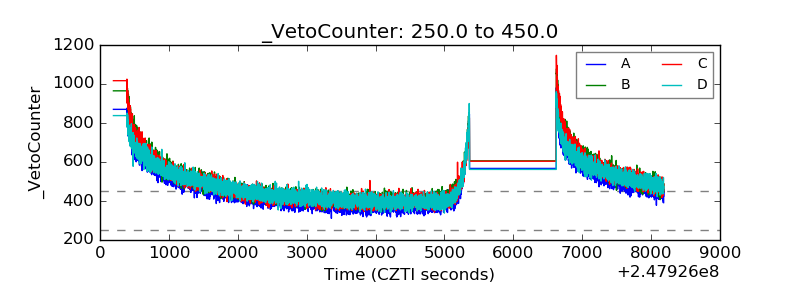 |