| Param | Original file | Final file |
|---|---|---|
| Filename | modeM0/AS1A04_021T02_9000001676_11450cztM0_level2.evt | modeM0/AS1A04_021T02_9000001676_11450cztM0_level2_quad_clean.evt |
| Size (bytes) | 216,276,480 | 58,711,680 |
| Size | 206.3 MB | 56.0 MB |
| Events in quadrant A | 1,395,800 | 393,467 |
| Events in quadrant B | 1,885,122 | 386,236 |
| Events in quadrant C | 1,335,542 | 413,918 |
| Events in quadrant D | 1,741,177 | 383,933 |
| Mode SS | |||
|---|---|---|---|
| Quadrant | BADHDUFLAG | Total packets | Discarded packets |
| A | 0 | 56 | 0 |
| B | 0 | 56 | 0 |
| C | 0 | 56 | 0 |
| D | 0 | 56 | 0 |
| Mode M0 | |||
|---|---|---|---|
| Quadrant | BADHDUFLAG | Total packets | Discarded packets |
| A | 0 | 5903 | 0 |
| B | 0 | 7416 | 0 |
| C | 0 | 5719 | 0 |
| D | 0 | 7066 | 0 |
| Quadrant | Total seconds | Saturated seconds | Saturation percentage |
|---|---|---|---|
| A | 2803 | 3 | 0.107028% |
| B | 2803 | 83 | 2.961113% |
| C | 2803 | 0 | 0.000000% |
| D | 2803 | 65 | 2.318944% |
Noise dominated data is calculated using 1-second bins in cleaned event files. If a bin has >2000 counts, and if more than 50% of those come from <1% of pixels, then it is considered to be noise-dominated and hence unusable.
| Quadrant | # 1 sec bins | Bins with >0 counts | Bins with >2000 counts | High rate bins dominated by noise | Noise dominated (total time) | Noise dominated (detector-on time) | Marked lightcurve |
|---|---|---|---|---|---|---|---|
| A | 2804 | 2804 | 0 | 0 | 0.00% | 0.00% | 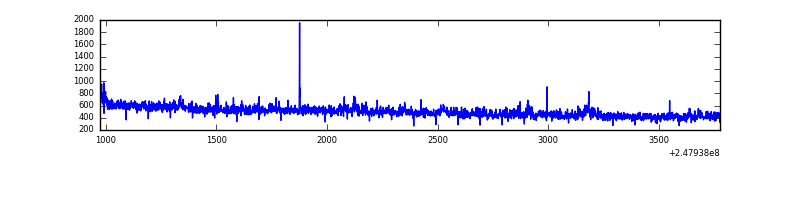 |
| B | 2804 | 2804 | 53 | 53 | 1.89% | 1.89% | 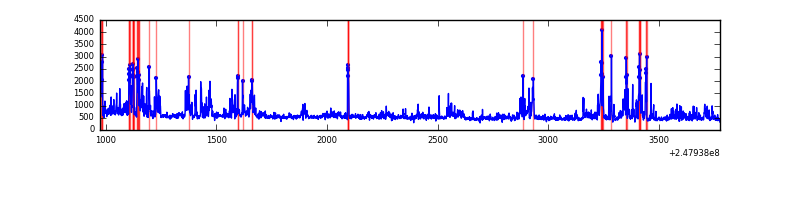 |
| C | 2804 | 2804 | 0 | 0 | 0.00% | 0.00% | 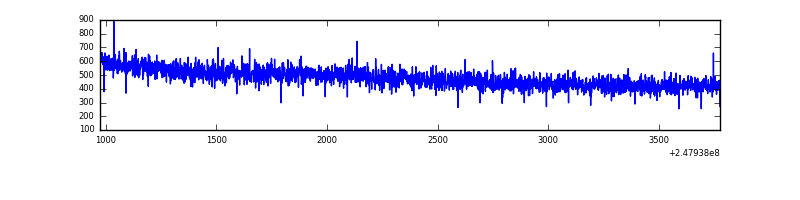 |
| D | 2804 | 2804 | 52 | 52 | 1.85% | 1.85% | 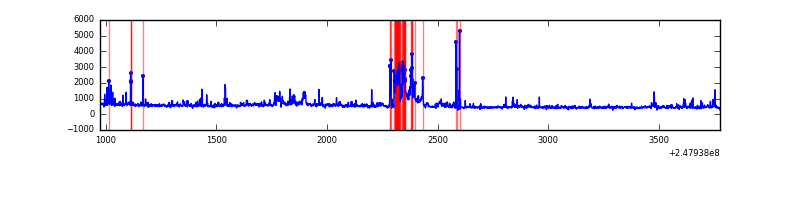 |
Top three noisy pixels from each quadrant. If the there are fewer than three noisy pixels in the level2.evt file, extra rows are filled as -1
| Pixel properties | Quadrant properties | ||||||
|---|---|---|---|---|---|---|---|
| Quadrant | DetID | PixID | Counts | Sigma | Mean | Median | Sigma |
| A | 1 | 162 | 24871 | 349.9 | 344 | 338 | 70.1 |
| A | 1 | 178 | 15027 | 209.5 | 344 | 338 | 70.1 |
| A | 1 | 161 | 12449 | 172.73 | 344 | 338 | 70.1 |
| B | 4 | 239 | 371634 | 5790.13 | 335 | 327 | 64.1 |
| B | 11 | 51 | 90042 | 1399.01 | 335 | 327 | 64.1 |
| B | 15 | 204 | 39713 | 614.18 | 335 | 327 | 64.1 |
| C | 13 | 61 | 2452 | 26.28 | 342 | 345 | 80.2 |
| C | 14 | 234 | 873 | 6.58 | 342 | 345 | 80.2 |
| C | 3 | 202 | 852 | 6.32 | 342 | 345 | 80.2 |
| D | 13 | 104 | 215425 | 2692.83 | 339 | 331 | 79.9 |
| D | 1 | 52 | 68316 | 851.13 | 339 | 331 | 79.9 |
| D | 8 | 195 | 66718 | 831.12 | 339 | 331 | 79.9 |
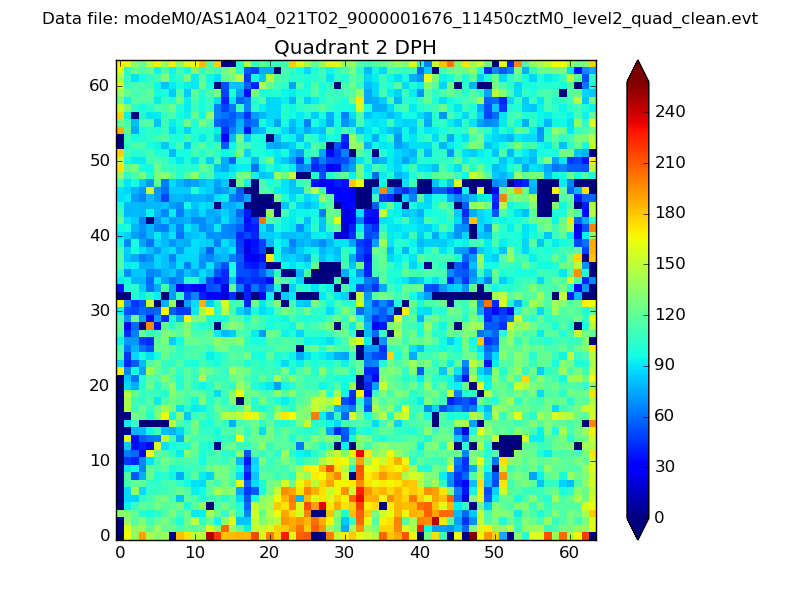
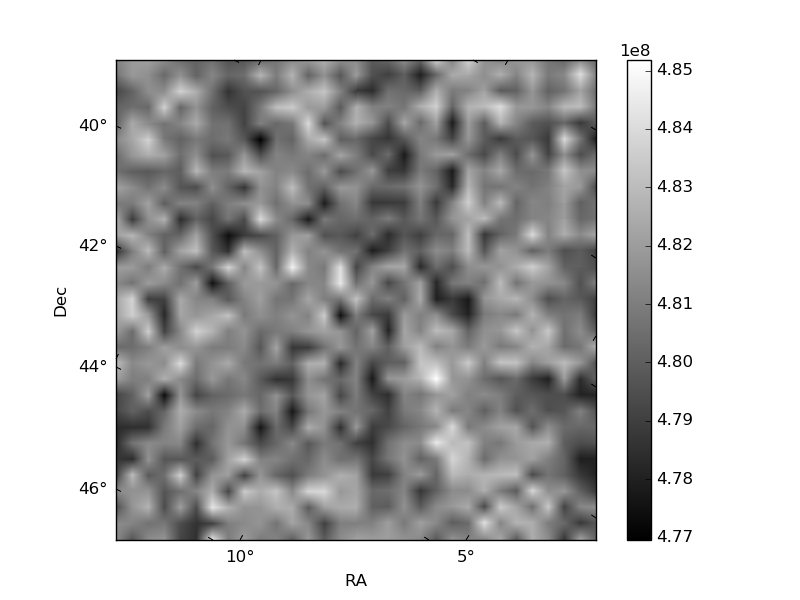
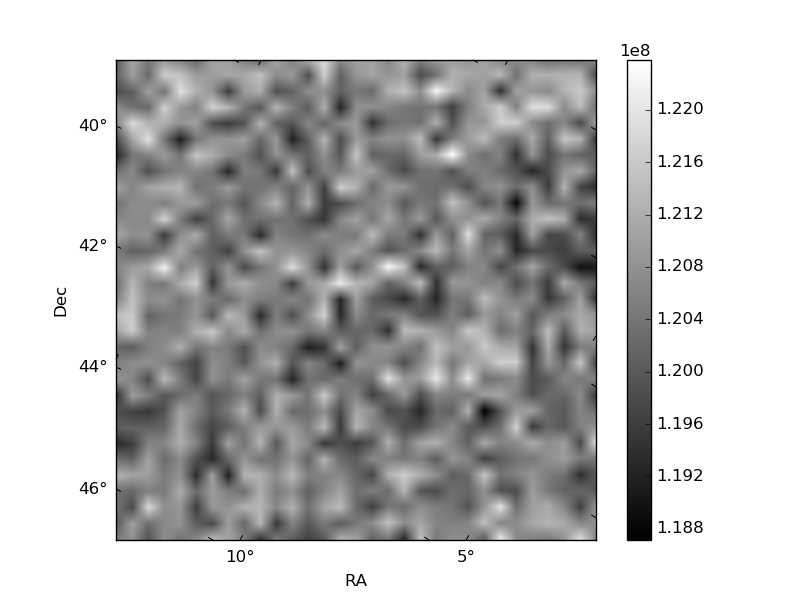
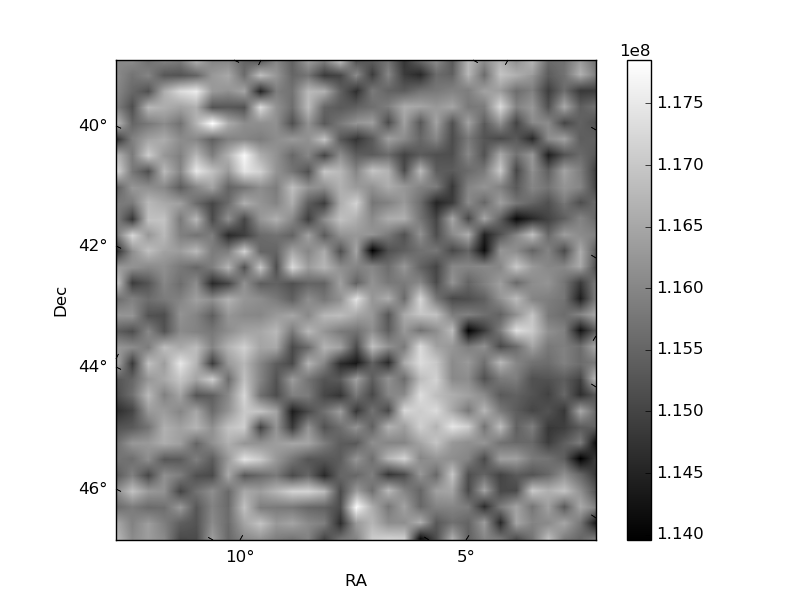
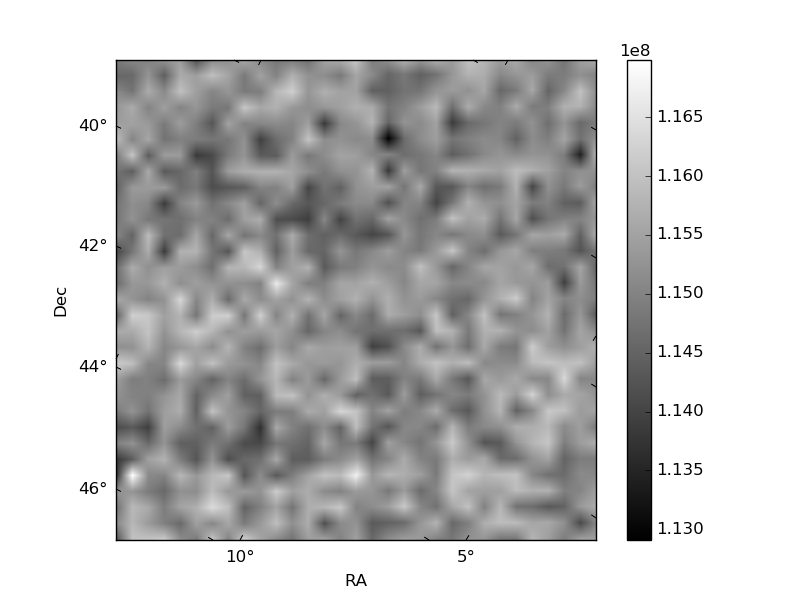
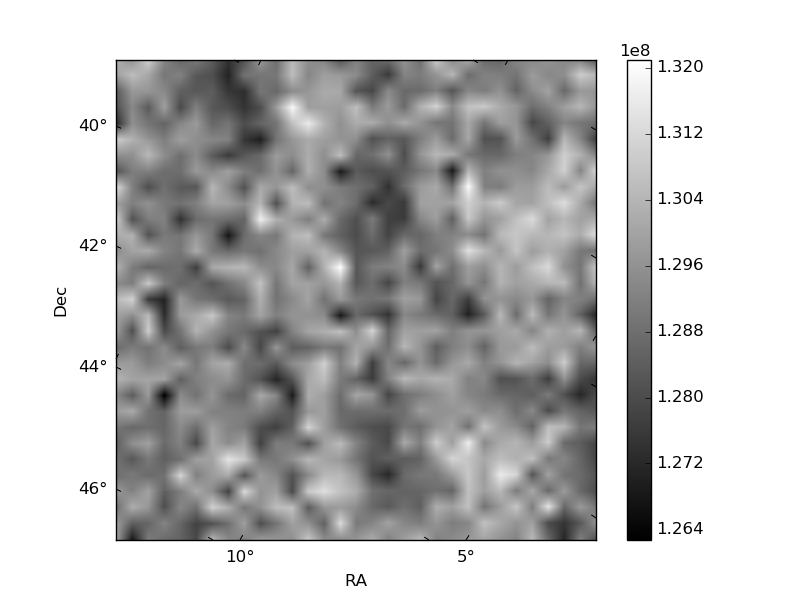
Histogram calculated using DETX and DETY for each event in the final _common_clean file
| Quadrant A | 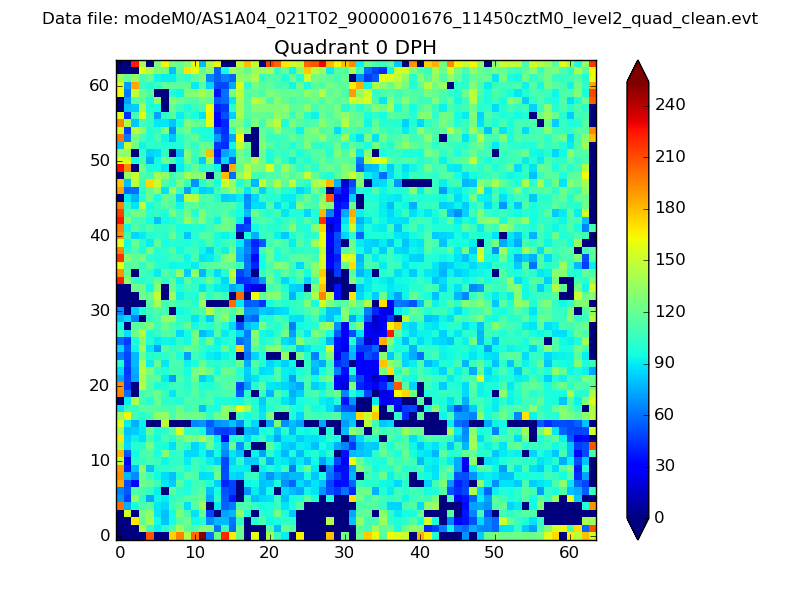 |
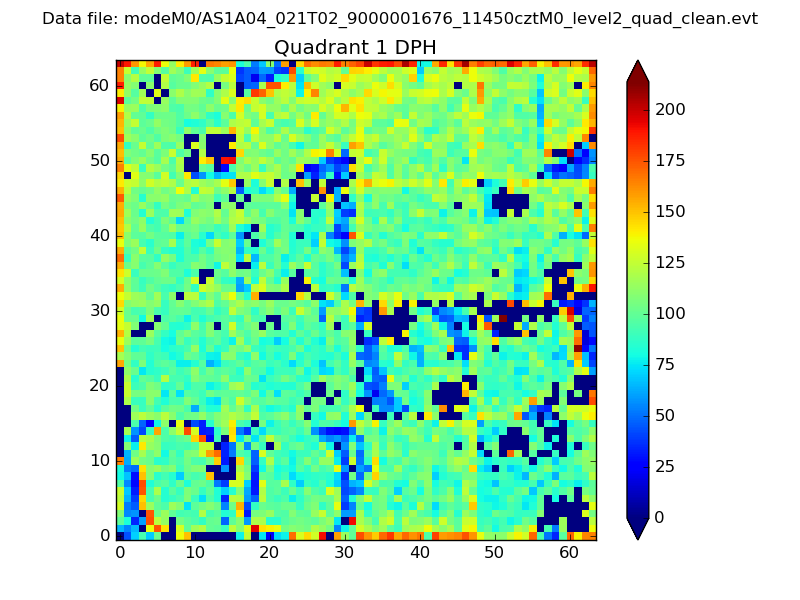 |
Quadrant B |
|---|---|---|---|
| Quadrant D | 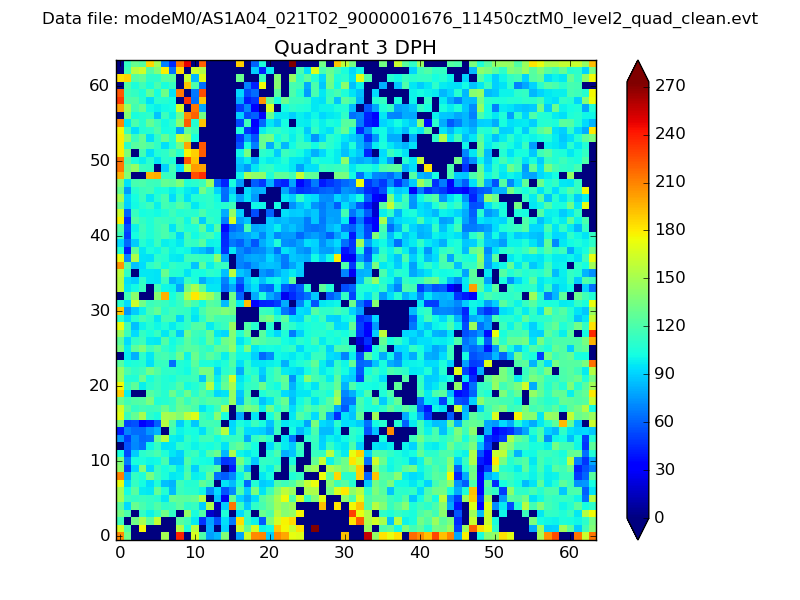 |
 |
Quadrant C |
| Plot type | Count rate plots | Images |
|---|---|---|
| Comparison with Poisson distribution Blue bars denote a histogram of data divided into 1 sec bins. Red curve is a Poisson curve with rate = median count rate of data. |
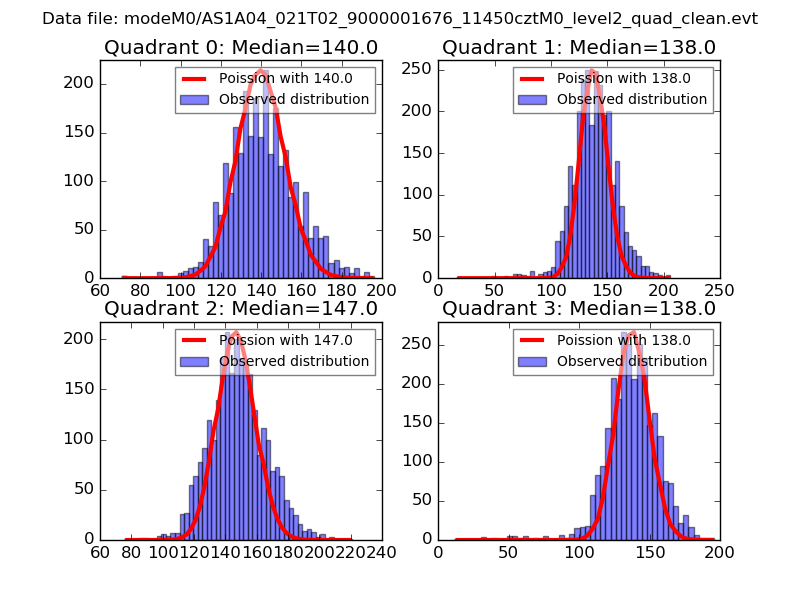 |
 |
| Quadrant-wise count rates Data is divided into 100 sec bins |
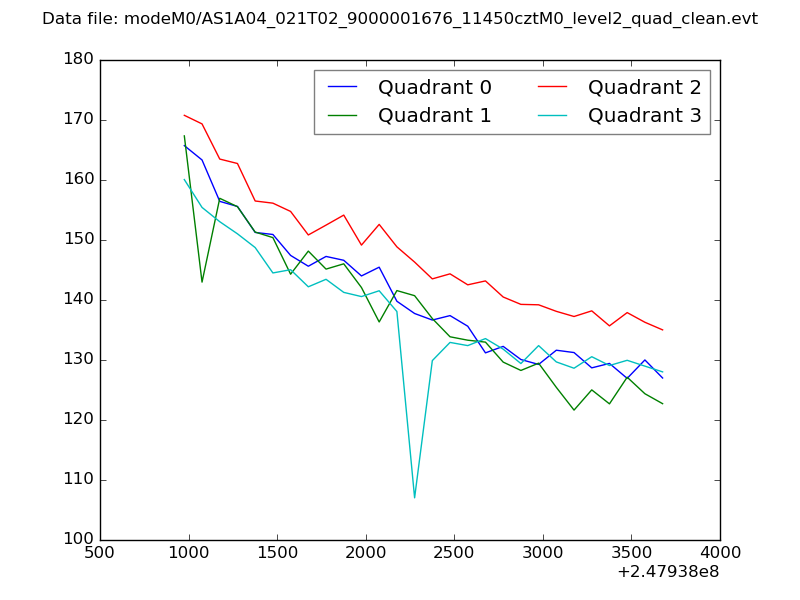 |
|
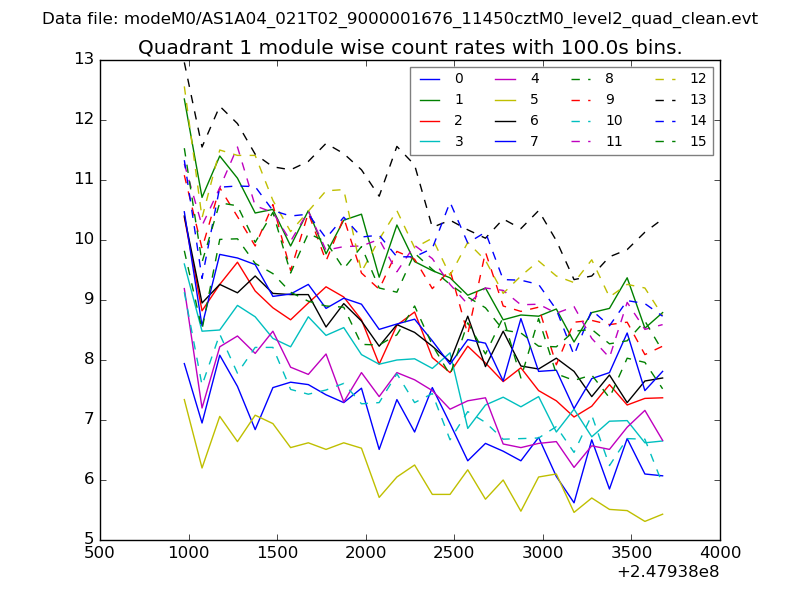
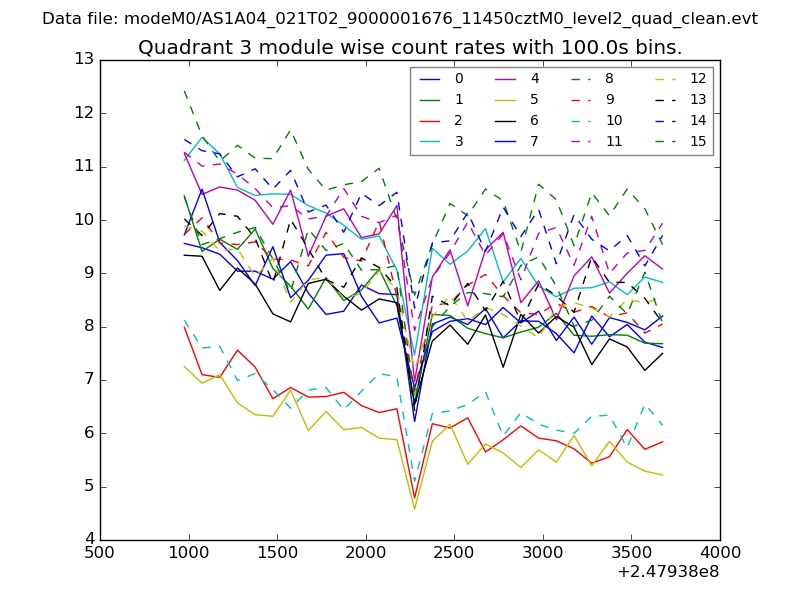
| Module-wise count rates for Quadrant A Data is divided into 100 sec bins |
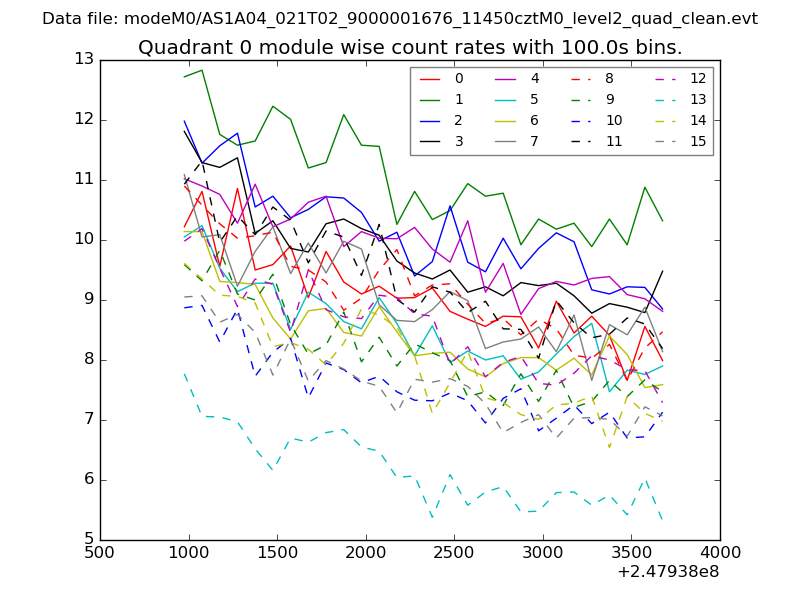 |
 |
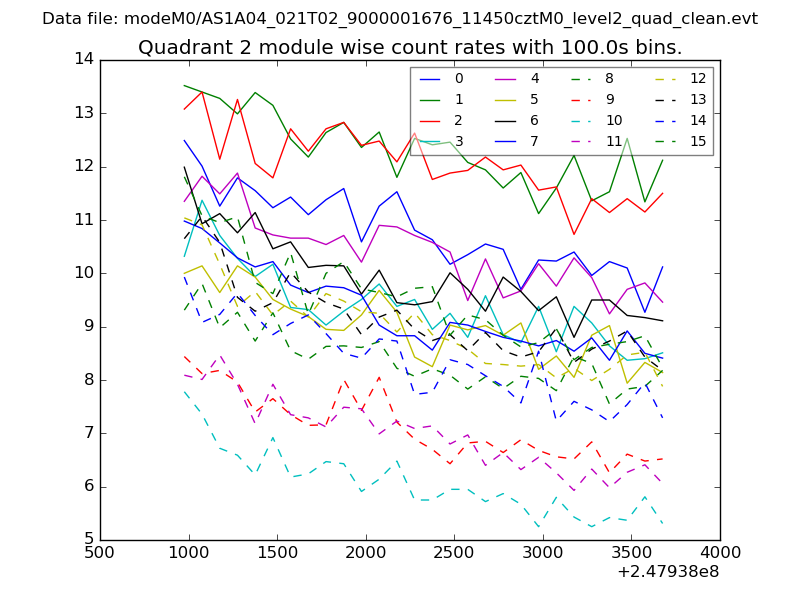
| Module-wise count rates for Quadrant B Data is divided into 100 sec bins |
 |
 |
| Module-wise count rates for Quadrant C Data is divided into 100 sec bins |
 |
 |
| Module-wise count rates for Quadrant D Data is divided into 100 sec bins |
 |
 |
| Parameter | Plot |
|---|---|
| CZT HV Monitor | 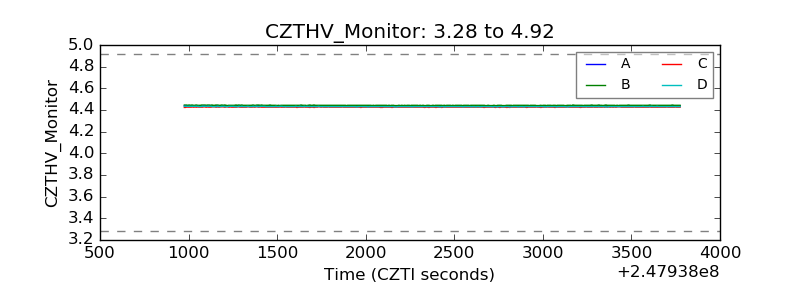 |
| D_VDD | 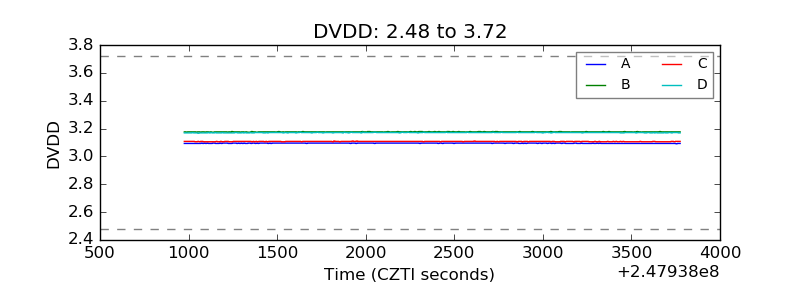 |
| Temperature 1 | 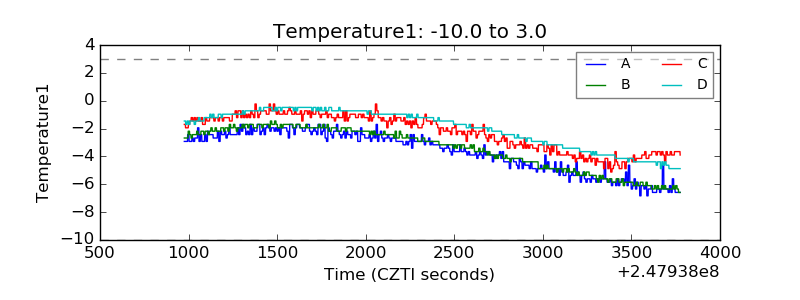 |
| Veto HV Monitor | 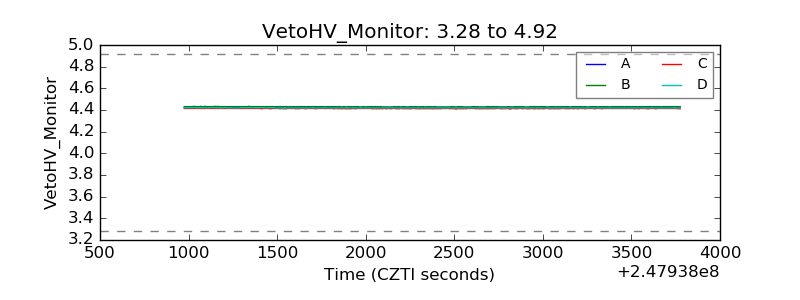 |
| Veto LLD | 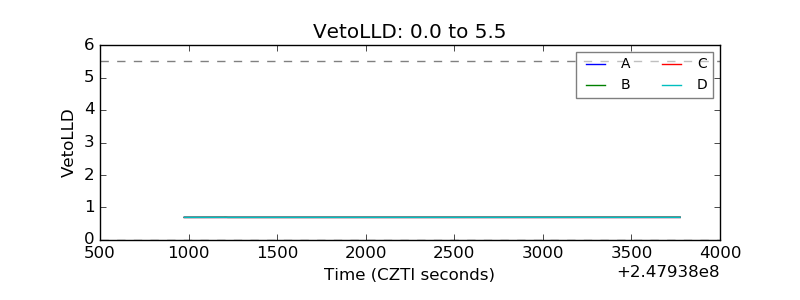 |
| Alpha Counter | 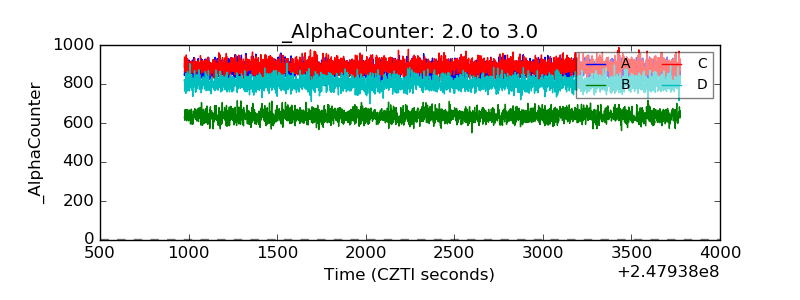 |
| _CPM_Rate | 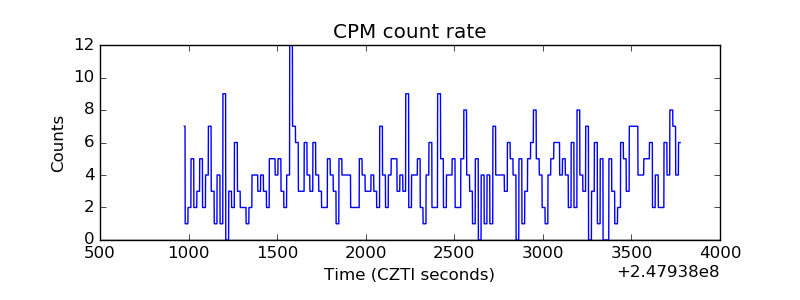 |
| CZT Counter | 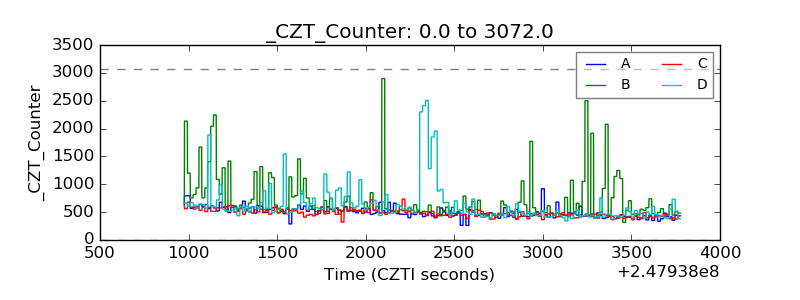 |
| +2.5 Volts monitor |  |
| +5 Volts monitor | 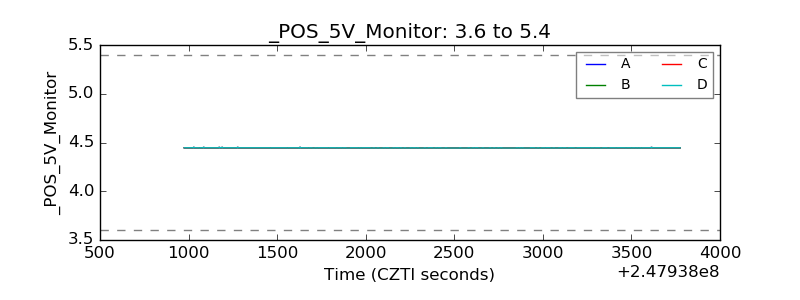 |
| _ROLL_ROT |  |
| _Roll_DEC | 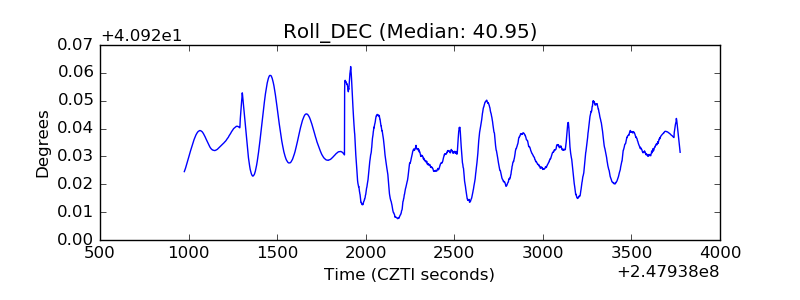 |
| _Roll_RA | 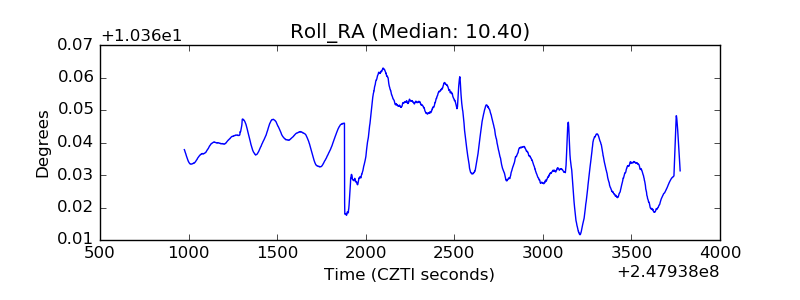 |
| Veto Counter | 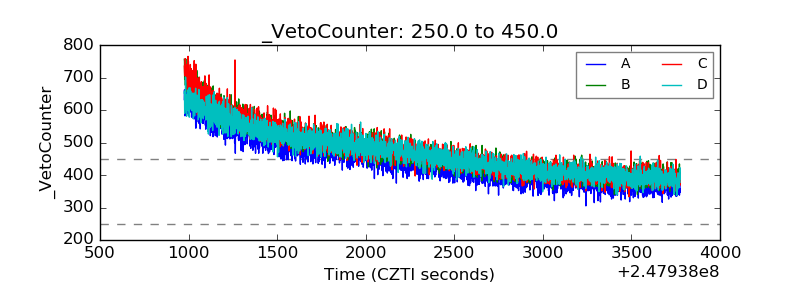 |