| Param | Original file | Final file |
|---|---|---|
| Filename | modeM0/AS1A04_054T02_9000001674cztM0_level2.fits | modeM0/AS1A04_054T02_9000001674cztM0_level2_quad_clean.evt |
| Size (bytes) | 80,717,760 | 59,630,400 |
| Size | 77.0 MB | 56.9 MB |
| Events in quadrant A | 491,676 | 326,076 |
| Events in quadrant B | 470,106 | 314,028 |
| Events in quadrant C | 481,090 | 298,229 |
| Events in quadrant D | 418,180 | 282,836 |
| Mode M9 | |||
|---|---|---|---|
| Quadrant | BADHDUFLAG | Total packets | Discarded packets |
| A | 0 | 19 | 0 |
| B | 0 | 19 | 0 |
| C | 0 | 19 | 0 |
| D | 0 | 19 | 0 |
| Mode M0 | |||
|---|---|---|---|
| Quadrant | BADHDUFLAG | Total packets | Discarded packets |
| A | 0 | 17874 | 0 |
| B | 0 | 21252 | 0 |
| C | 0 | 17487 | 0 |
| D | 0 | 19150 | 0 |
| Mode SS | |||
|---|---|---|---|
| Quadrant | BADHDUFLAG | Total packets | Discarded packets |
| A | 0 | 172 | 0 |
| B | 0 | 172 | 0 |
| C | 0 | 172 | 0 |
| D | 0 | 172 | 0 |
| Quadrant | Total seconds | Saturated seconds | Saturation percentage |
|---|---|---|---|
| A | 8402 | 122 | 1.452035% |
| B | 8402 | 396 | 4.713164% |
| C | 8402 | 57 | 0.678410% |
| D | 8402 | 137 | 1.630564% |
Noise dominated data is calculated using 1-second bins in cleaned event files. If a bin has >2000 counts, and if more than 50% of those come from <1% of pixels, then it is considered to be noise-dominated and hence unusable.
| Quadrant | # 1 sec bins | Bins with >0 counts | Bins with >2000 counts | High rate bins dominated by noise | Noise dominated (total time) | Noise dominated (detector-on time) | Marked lightcurve |
|---|---|---|---|---|---|---|---|
| A | 10307 | 8402 | 0 | 0 | 0.00% | 0.00% | 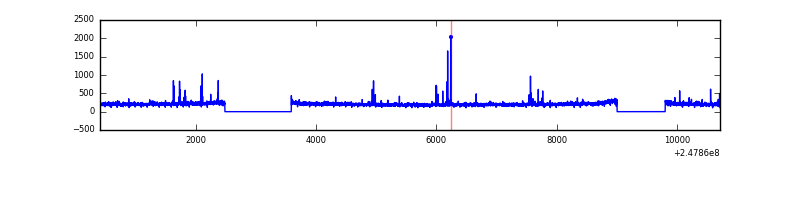 |
| B | 10307 | 8402 | 0 | 0 | 0.00% | 0.00% | 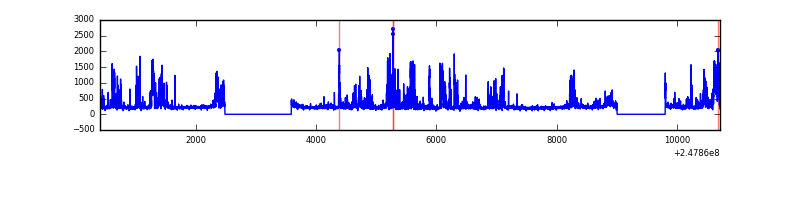 |
| C | 10307 | 8402 | 0 | 0 | 0.00% | 0.00% | 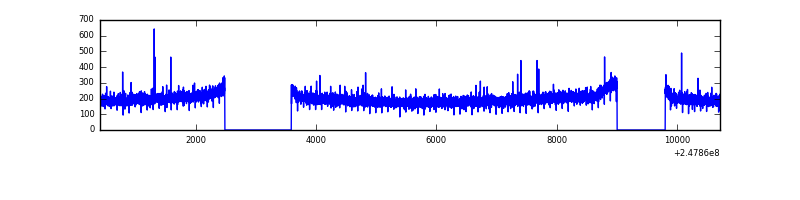 |
| D | 10307 | 8398 | 0 | 0 | 0.00% | 0.00% | 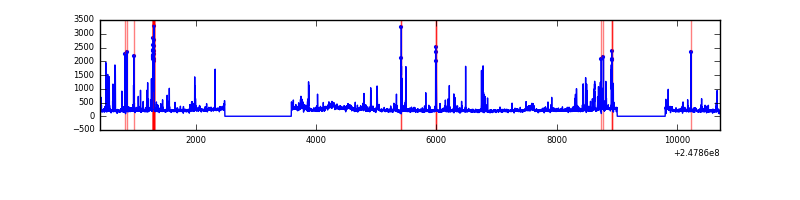 |
Top three noisy pixels from each quadrant. If the there are fewer than three noisy pixels in the level2.evt file, extra rows are filled as -1
| Pixel properties | Quadrant properties | ||||||
|---|---|---|---|---|---|---|---|
| Quadrant | DetID | PixID | Counts | Sigma | Mean | Median | Sigma |
| A | 0 | 29 | 468 | 10.21 | 127 | 120 | 34.1 |
| A | 7 | 110 | 407 | 8.42 | 127 | 120 | 34.1 |
| A | 14 | 79 | 371 | 7.36 | 127 | 120 | 34.1 |
| B | 2 | 9 | 407 | 10.27 | 124 | 117 | 28.2 |
| B | 5 | 128 | 326 | 7.4 | 124 | 117 | 28.2 |
| B | 14 | 254 | 324 | 7.33 | 124 | 117 | 28.2 |
| C | 1 | 81 | 345 | 6.51 | 127 | 118 | 34.8 |
| C | 2 | 191 | 332 | 6.14 | 127 | 118 | 34.8 |
| C | 12 | 241 | 324 | 5.91 | 127 | 118 | 34.8 |
| D | 3 | 14 | 333 | 6.7 | 119 | 108 | 33.6 |
| D | 1 | 19 | 314 | 6.13 | 119 | 108 | 33.6 |
| D | 7 | 5 | 312 | 6.07 | 119 | 108 | 33.6 |
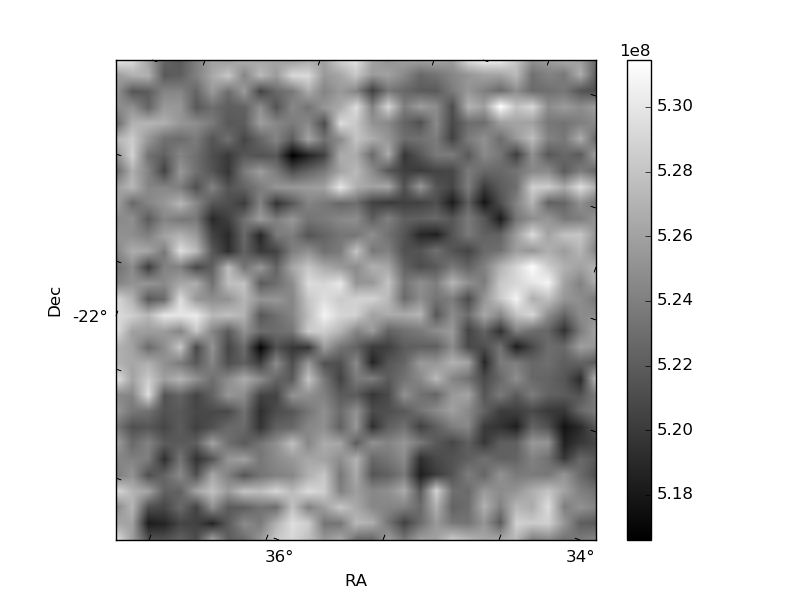
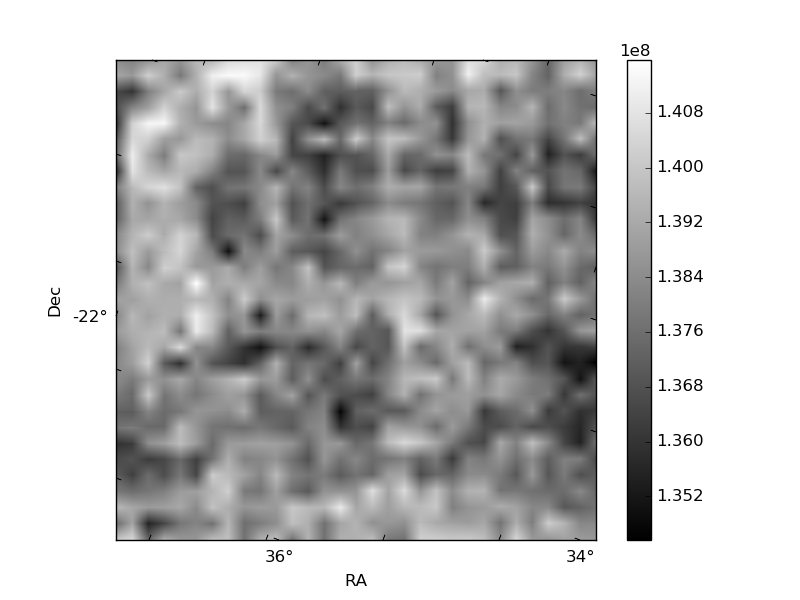
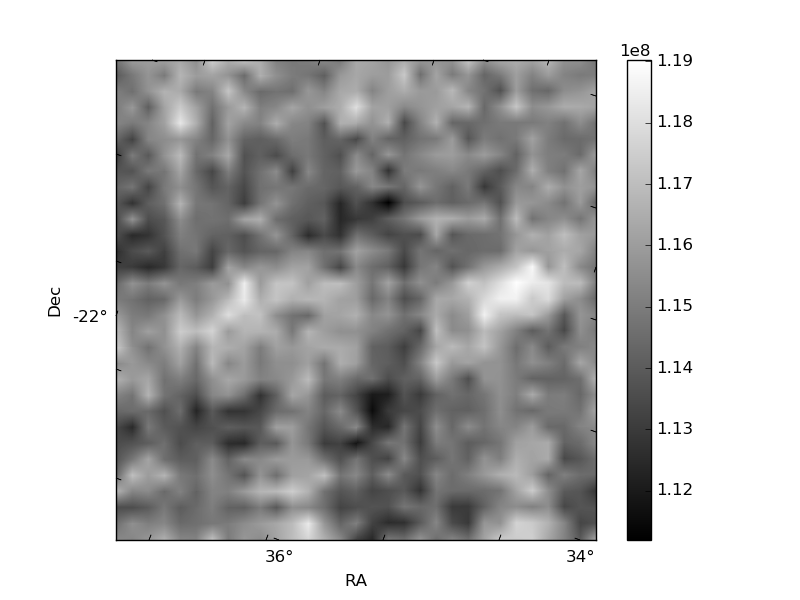
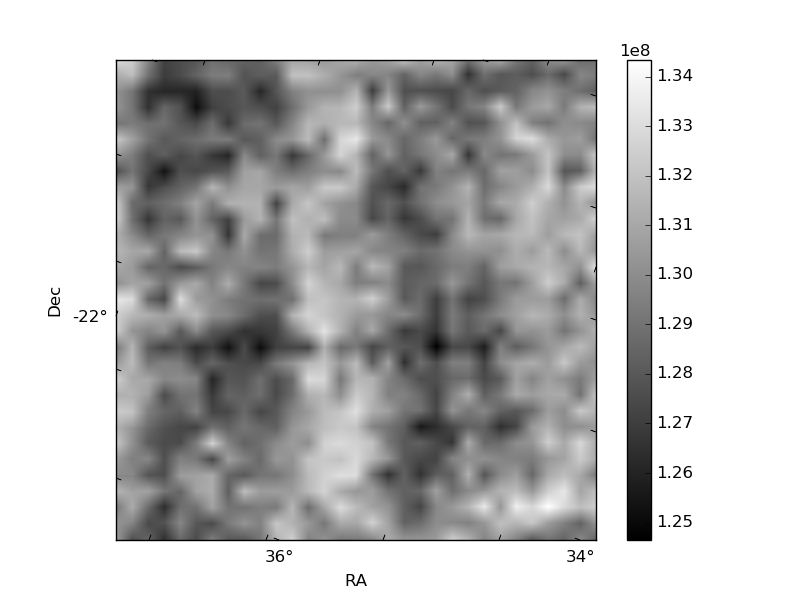
Histogram calculated using DETX and DETY for each event in the final _common_clean file
| Quadrant A | 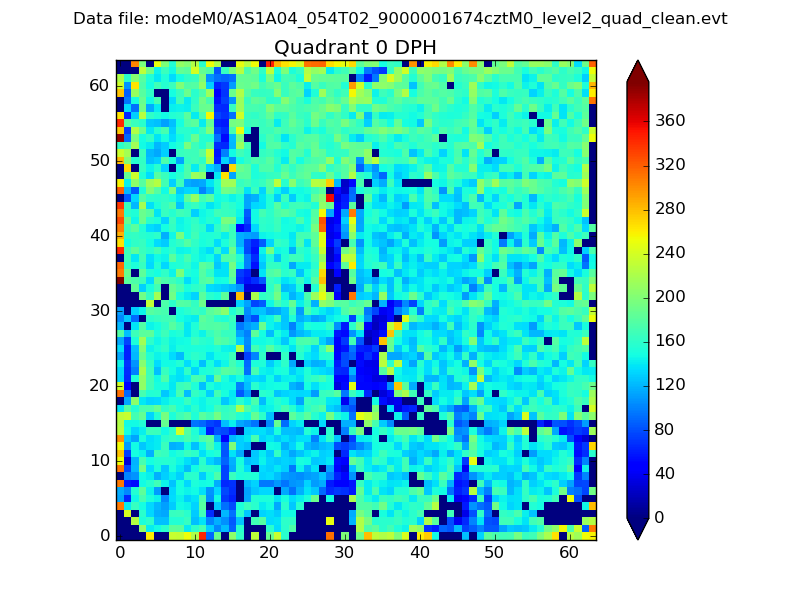 |
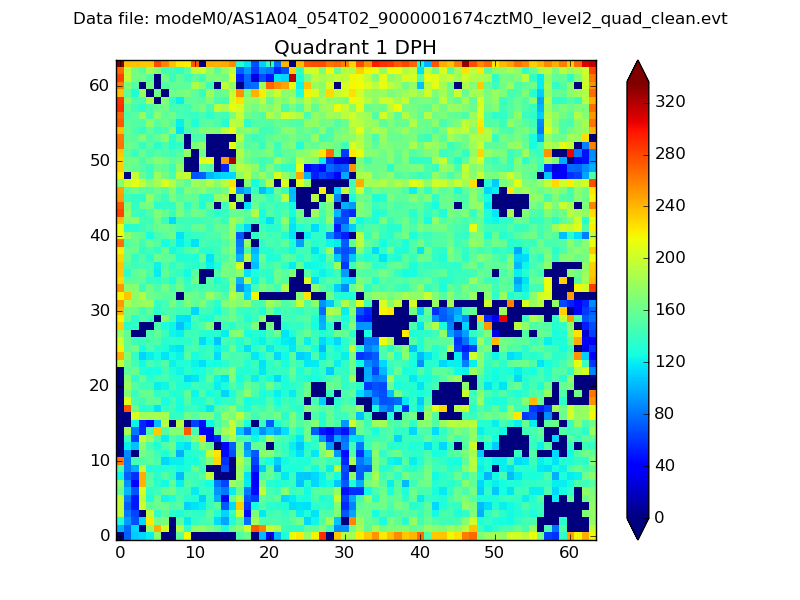 |
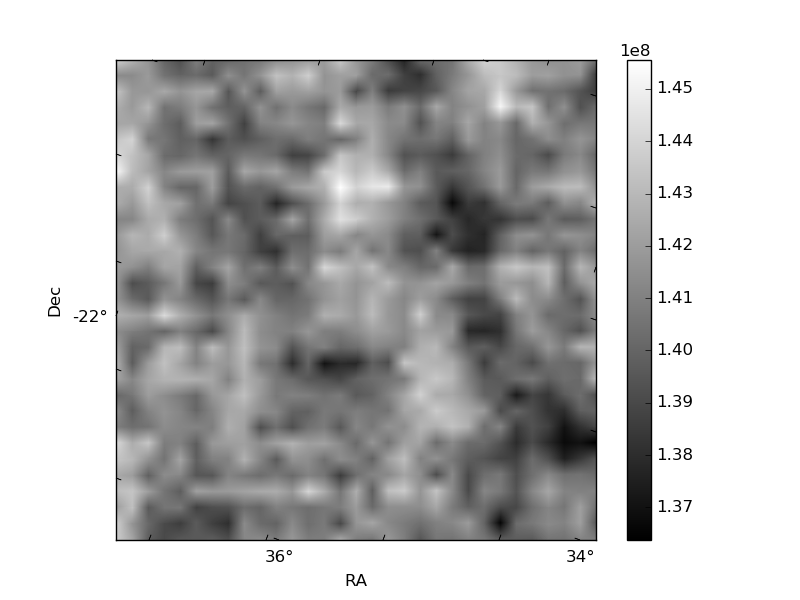
Quadrant B |
|---|---|---|---|
| Quadrant D | 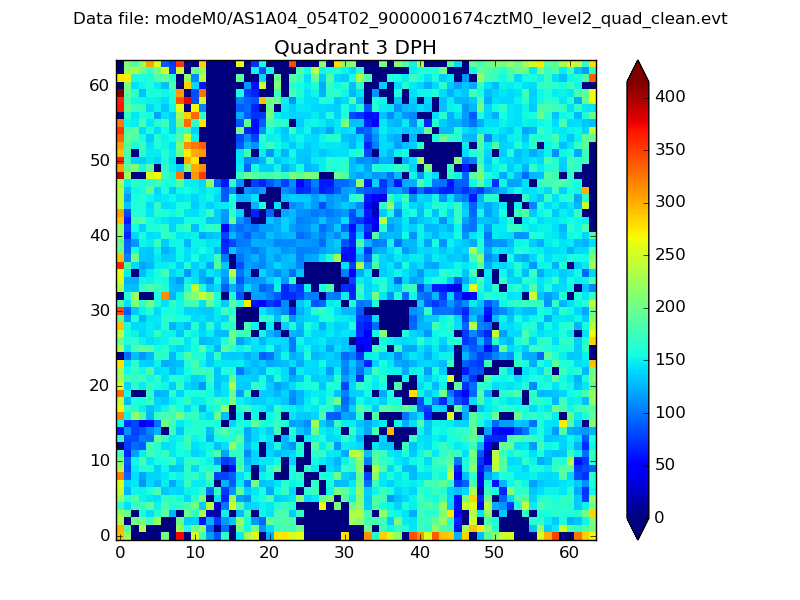 |
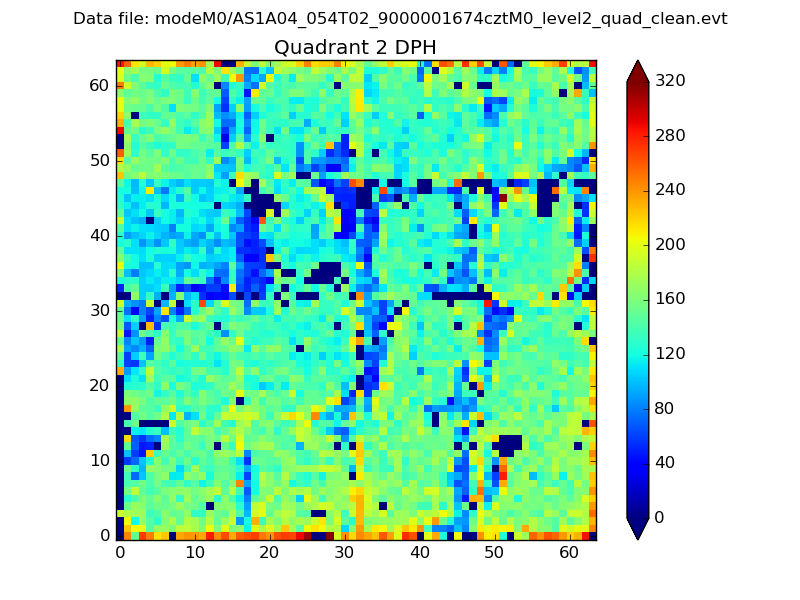 |
Quadrant C |
| Plot type | Count rate plots | Images |
|---|---|---|
| Comparison with Poisson distribution Blue bars denote a histogram of data divided into 1 sec bins. Red curve is a Poisson curve with rate = median count rate of data. |
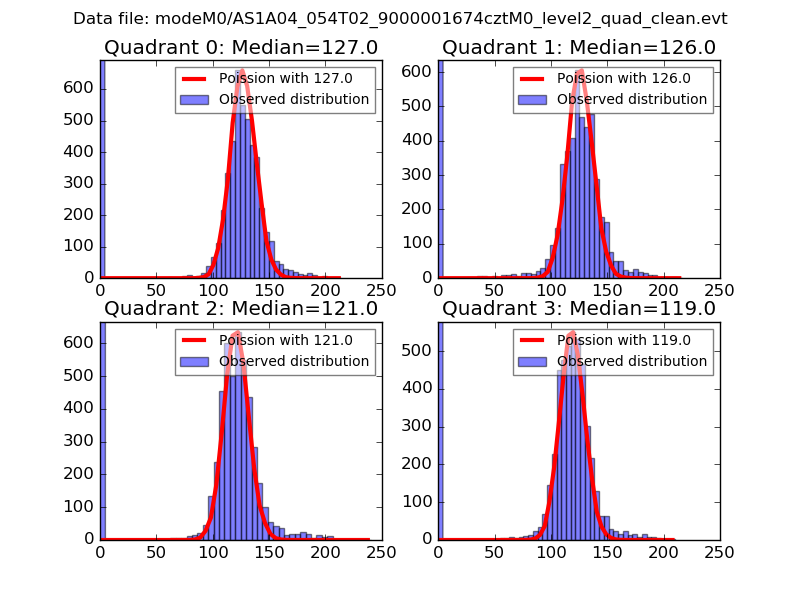 |
 |
| Quadrant-wise count rates Data is divided into 100 sec bins |
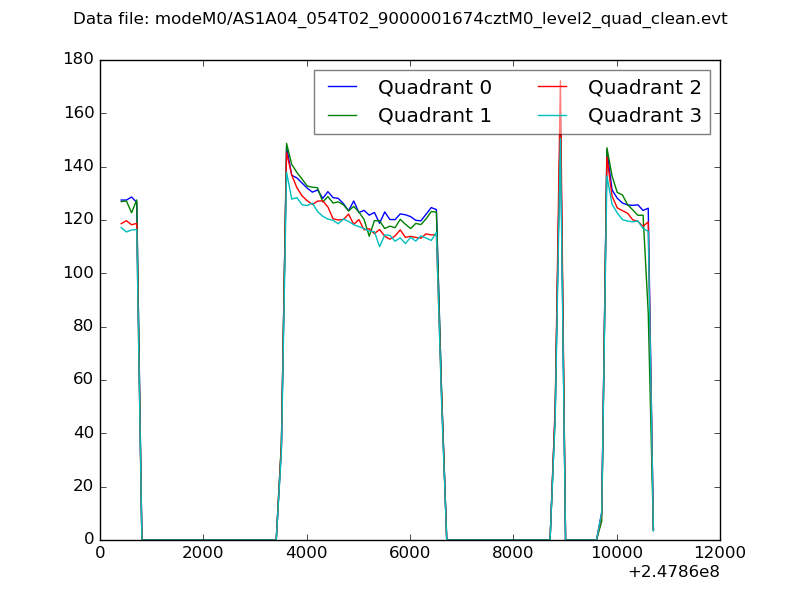 |
|
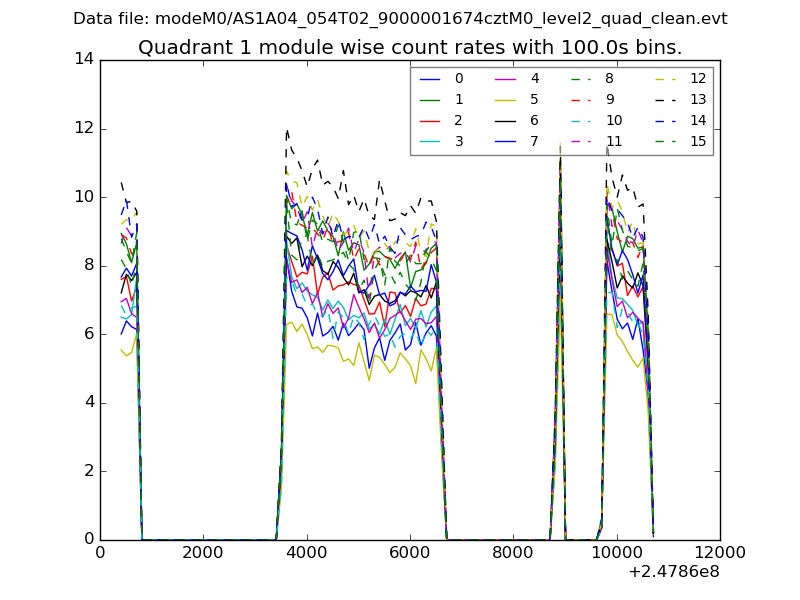
| Module-wise count rates for Quadrant A Data is divided into 100 sec bins |
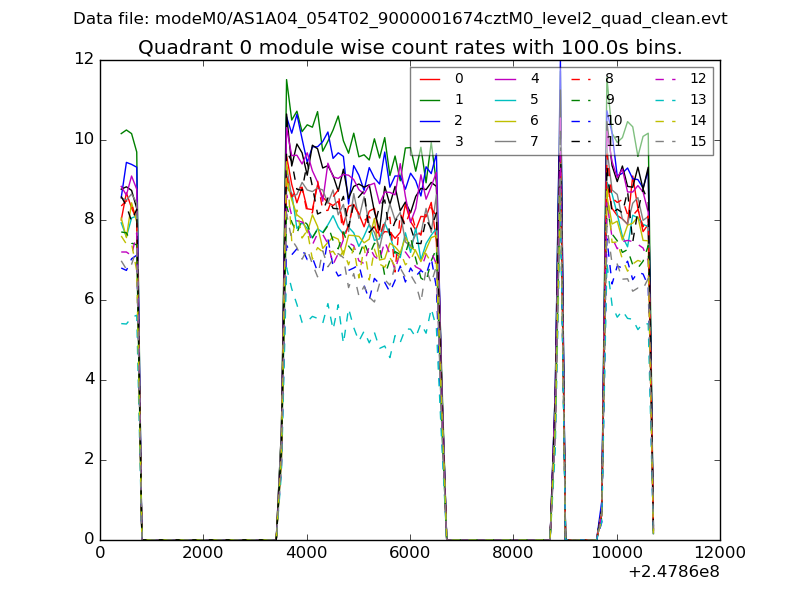 |
 |
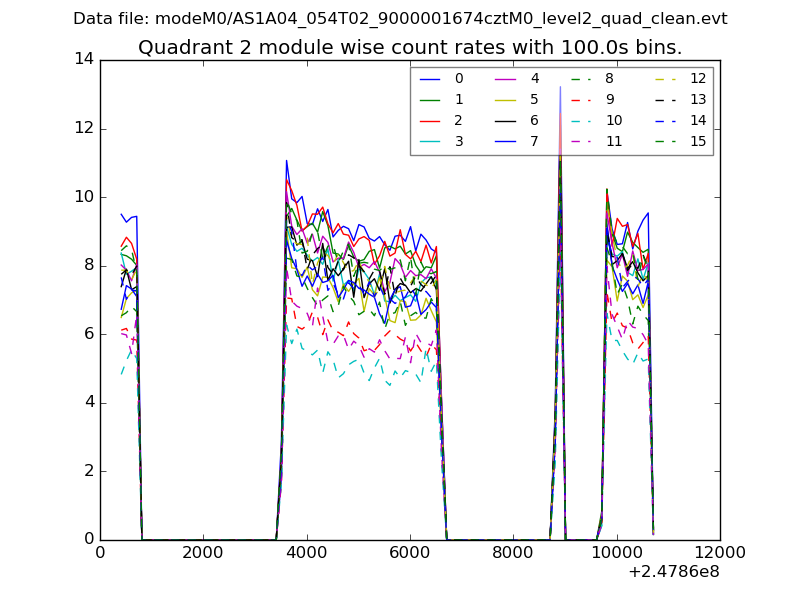
| Module-wise count rates for Quadrant B Data is divided into 100 sec bins |
 |
 |
| Module-wise count rates for Quadrant C Data is divided into 100 sec bins |
 |
 |
| Module-wise count rates for Quadrant D Data is divided into 100 sec bins |
 |
 |
| Parameter | Plot |
|---|---|
| CZT HV Monitor | 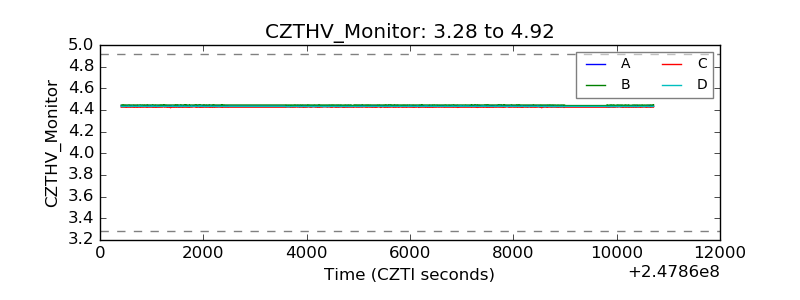 |
| D_VDD | 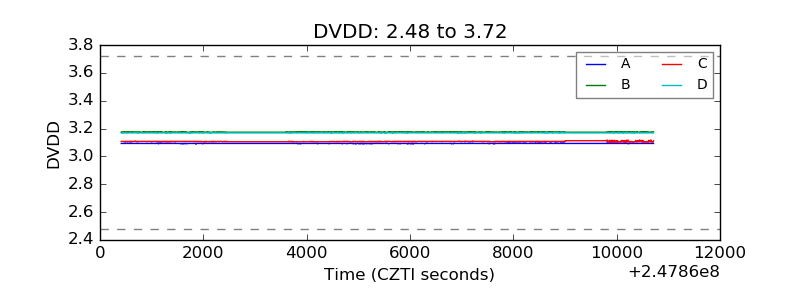 |
| Temperature 1 | 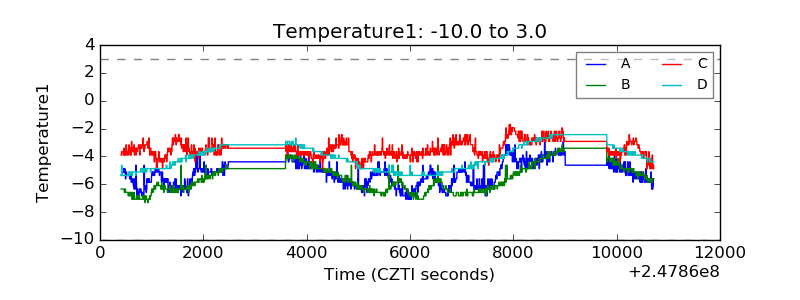 |
| Veto HV Monitor | 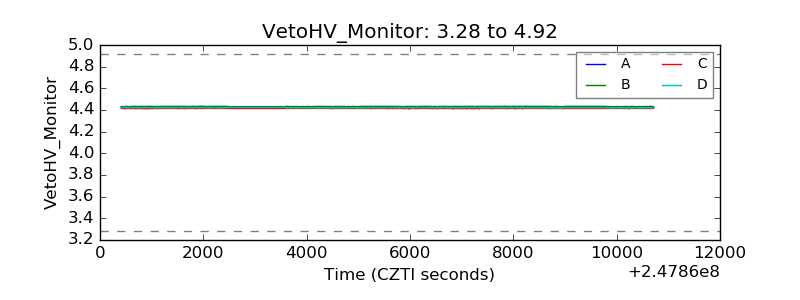 |
| Veto LLD | 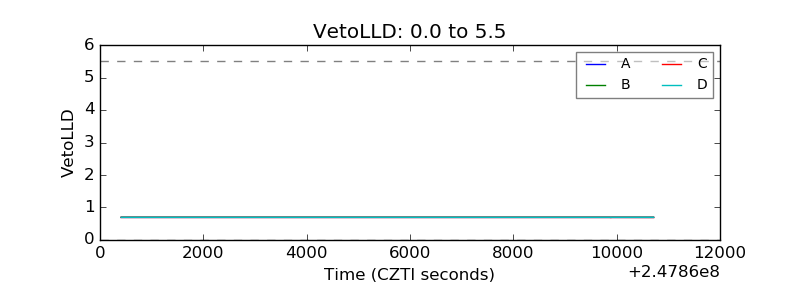 |
| Alpha Counter | 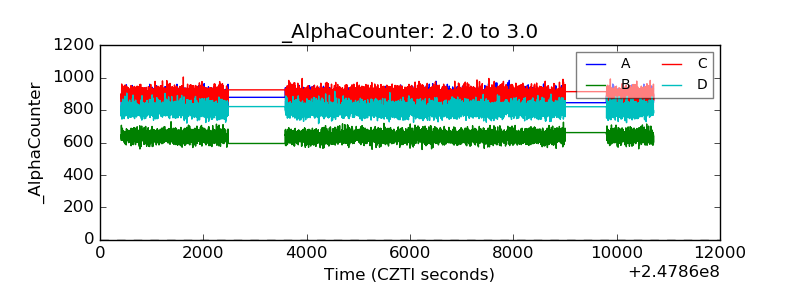 |
| _CPM_Rate | 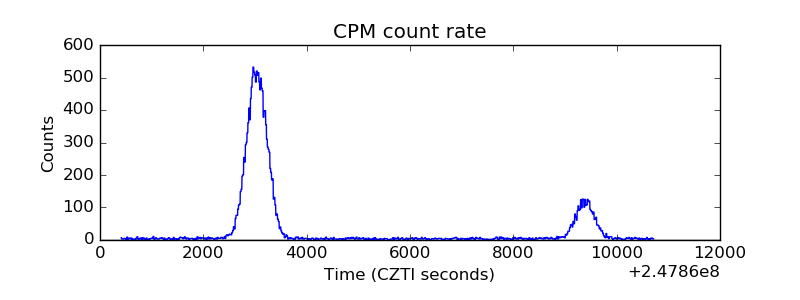 |
| CZT Counter | 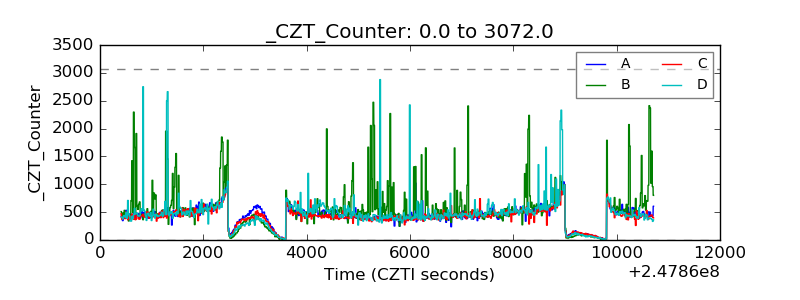 |
| +2.5 Volts monitor | 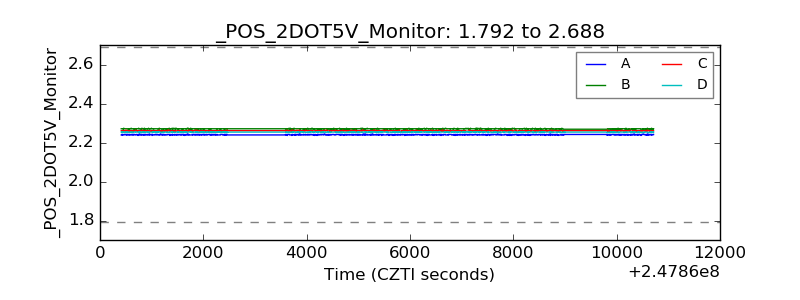 |
| +5 Volts monitor | 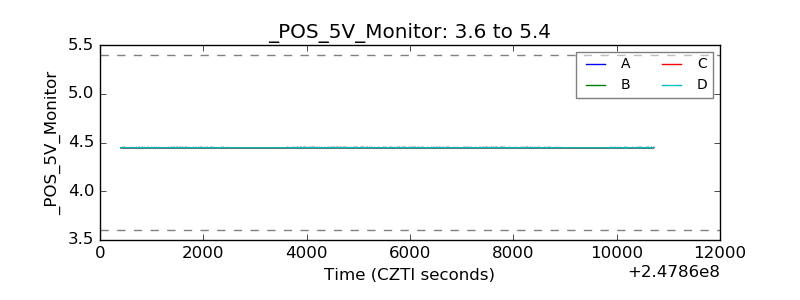 |
| _ROLL_ROT | 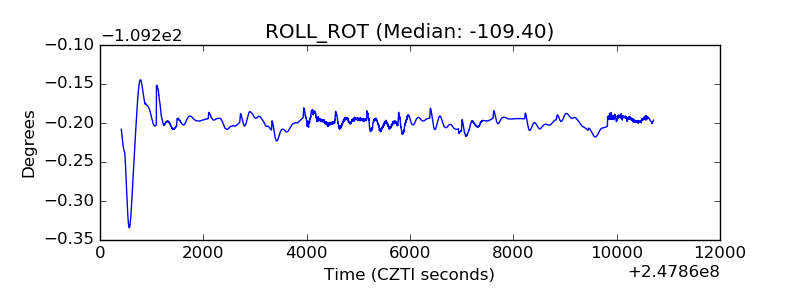 |
| _Roll_DEC | 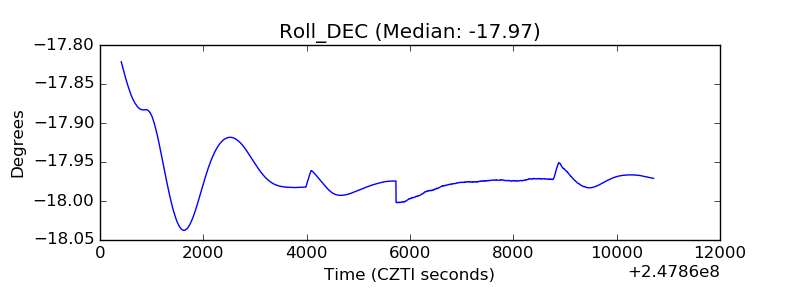 |
| _Roll_RA | 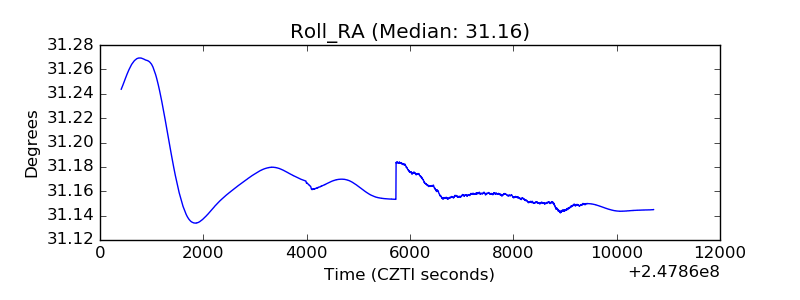 |
| Veto Counter | 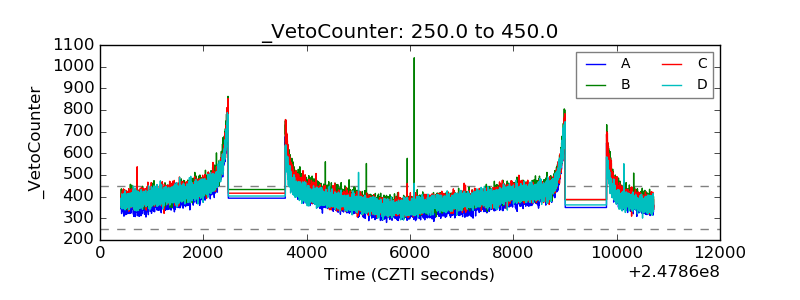 |