| Param | Original file | Final file |
|---|---|---|
| Filename | modeM0/AS1A04_054T02_9000001674_11438cztM0_level2.evt | modeM0/AS1A04_054T02_9000001674_11438cztM0_level2_quad_clean.evt |
| Size (bytes) | 449,781,120 | 82,146,240 |
| Size | 428.9 MB | 78.3 MB |
| Events in quadrant A | 3,061,560 | 525,971 |
| Events in quadrant B | 3,957,104 | 518,248 |
| Events in quadrant C | 2,868,511 | 505,972 |
| Events in quadrant D | 3,304,066 | 495,381 |
| Mode M9 | |||
|---|---|---|---|
| Quadrant | BADHDUFLAG | Total packets | Discarded packets |
| A | 0 | 18 | 0 |
| B | 0 | 18 | 0 |
| C | 0 | 18 | 0 |
| D | 0 | 18 | 0 |
| Mode M0 | |||
|---|---|---|---|
| Quadrant | BADHDUFLAG | Total packets | Discarded packets |
| A | 0 | 13336 | 2 |
| B | 0 | 15849 | 2 |
| C | 0 | 13039 | 2 |
| D | 0 | 14214 | 2 |
| Mode SS | |||
|---|---|---|---|
| Quadrant | BADHDUFLAG | Total packets | Discarded packets |
| A | 0 | 130 | 0 |
| B | 0 | 130 | 0 |
| C | 0 | 130 | 0 |
| D | 0 | 130 | 0 |
| Quadrant | Total seconds | Saturated seconds | Saturation percentage |
|---|---|---|---|
| A | 6327 | 50 | 0.790264% |
| B | 6327 | 228 | 3.603604% |
| C | 6327 | 16 | 0.252884% |
| D | 6327 | 60 | 0.948317% |
Noise dominated data is calculated using 1-second bins in cleaned event files. If a bin has >2000 counts, and if more than 50% of those come from <1% of pixels, then it is considered to be noise-dominated and hence unusable.
| Quadrant | # 1 sec bins | Bins with >0 counts | Bins with >2000 counts | High rate bins dominated by noise | Noise dominated (total time) | Noise dominated (detector-on time) | Marked lightcurve |
|---|---|---|---|---|---|---|---|
| A | 7127 | 6328 | 4 | 4 | 0.06% | 0.06% | 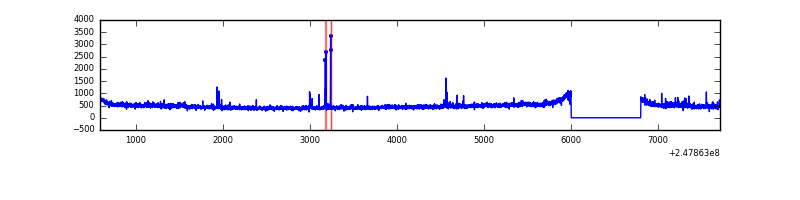 |
| B | 7127 | 6328 | 109 | 109 | 1.53% | 1.72% | 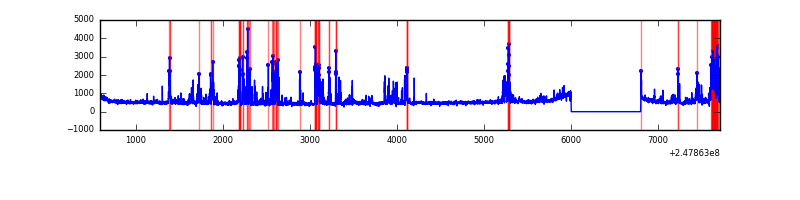 |
| C | 7127 | 6328 | 0 | 0 | 0.00% | 0.00% | 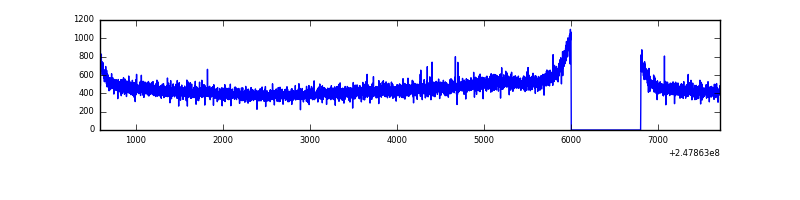 |
| D | 7127 | 6328 | 38 | 38 | 0.53% | 0.60% | 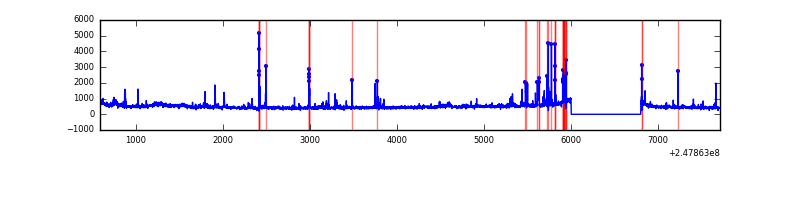 |
Top three noisy pixels from each quadrant. If the there are fewer than three noisy pixels in the level2.evt file, extra rows are filled as -1
| Pixel properties | Quadrant properties | ||||||
|---|---|---|---|---|---|---|---|
| Quadrant | DetID | PixID | Counts | Sigma | Mean | Median | Sigma |
| A | 9 | 143 | 39093 | 245.99 | 766 | 753 | 155.9 |
| A | 1 | 162 | 27071 | 168.86 | 766 | 753 | 155.9 |
| A | 1 | 178 | 15877 | 97.04 | 766 | 753 | 155.9 |
| B | 4 | 239 | 726191 | 4902.42 | 760 | 741 | 148.0 |
| B | 10 | 245 | 72849 | 487.29 | 760 | 741 | 148.0 |
| B | 3 | 189 | 66275 | 442.86 | 760 | 741 | 148.0 |
| C | 13 | 61 | 5260 | 26.26 | 735 | 740 | 172.1 |
| C | 8 | 128 | 3228 | 14.46 | 735 | 740 | 172.1 |
| C | 8 | 112 | 1894 | 6.71 | 735 | 740 | 172.1 |
| D | 1 | 52 | 240719 | 1352.87 | 730 | 709 | 177.4 |
| D | 13 | 104 | 85906 | 480.23 | 730 | 709 | 177.4 |
| D | 13 | 152 | 75816 | 423.36 | 730 | 709 | 177.4 |
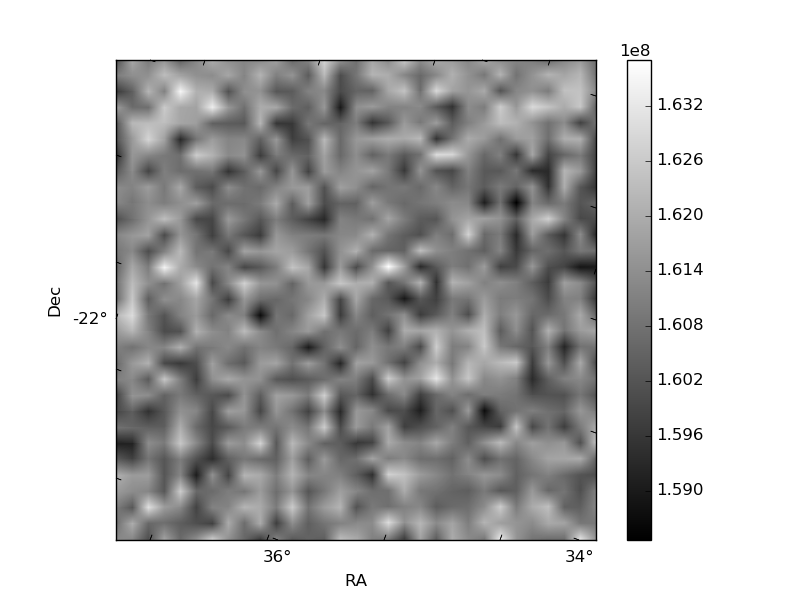
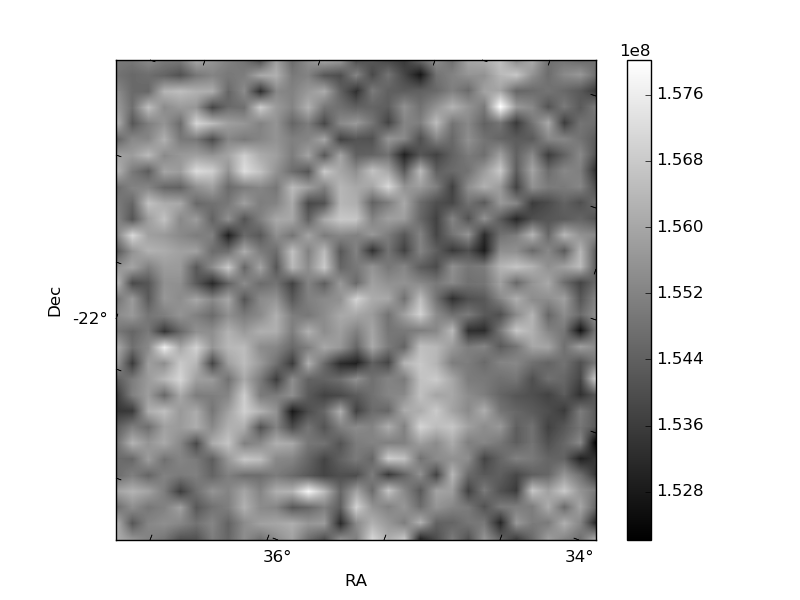
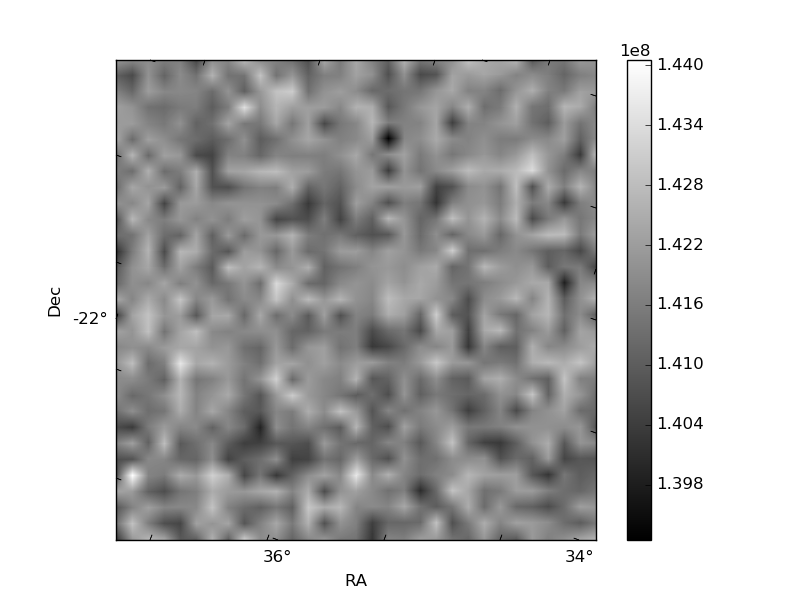
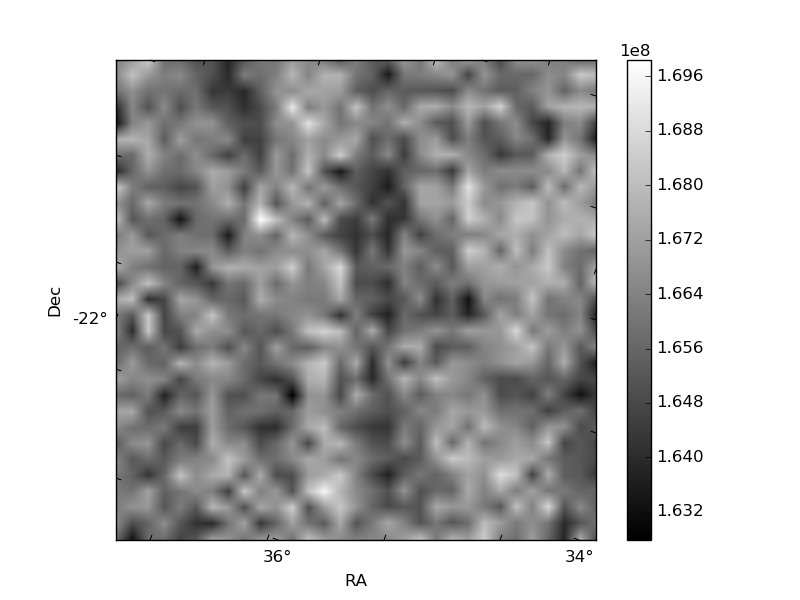
Histogram calculated using DETX and DETY for each event in the final _common_clean file
| Quadrant A |  |
 |
Quadrant B |
|---|---|---|---|
| Quadrant D |  |
 |
Quadrant C |
| Plot type | Count rate plots | Images |
|---|---|---|
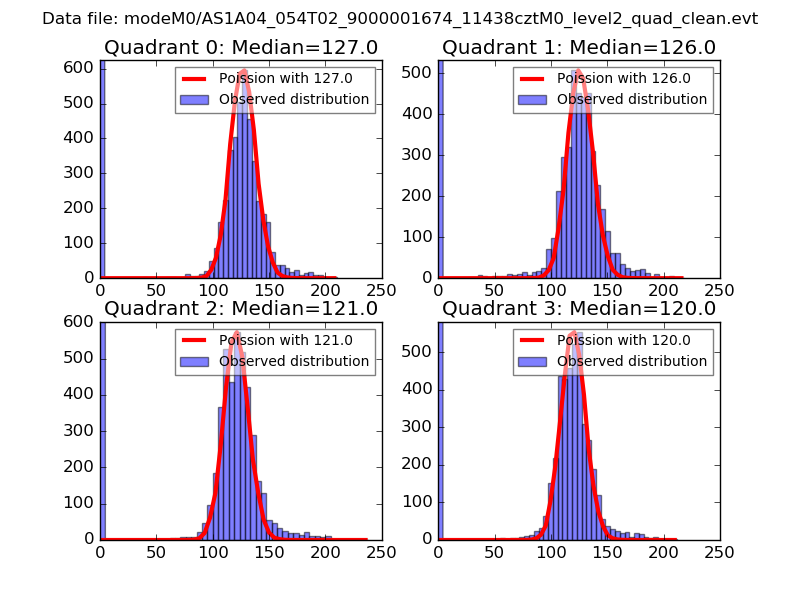
| Comparison with Poisson distribution Blue bars denote a histogram of data divided into 1 sec bins. Red curve is a Poisson curve with rate = median count rate of data. |
 |
 |
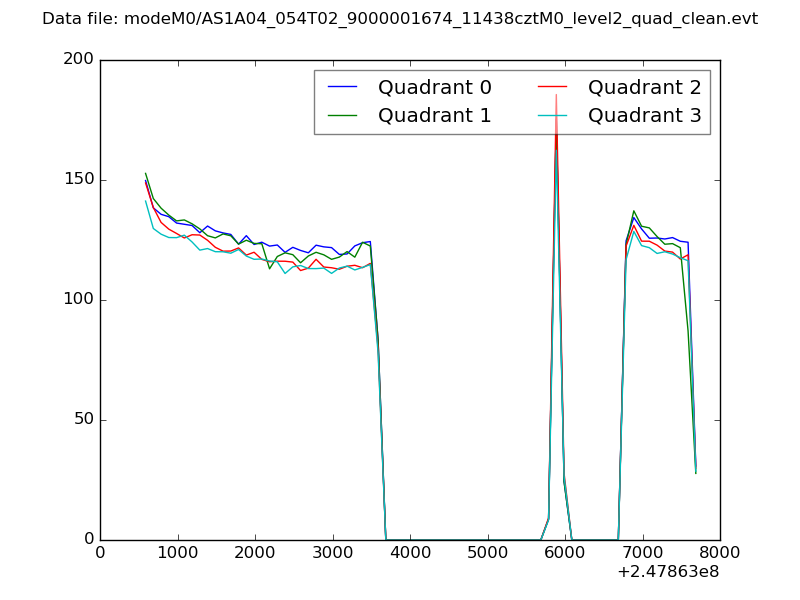
| Quadrant-wise count rates Data is divided into 100 sec bins |
 |
|
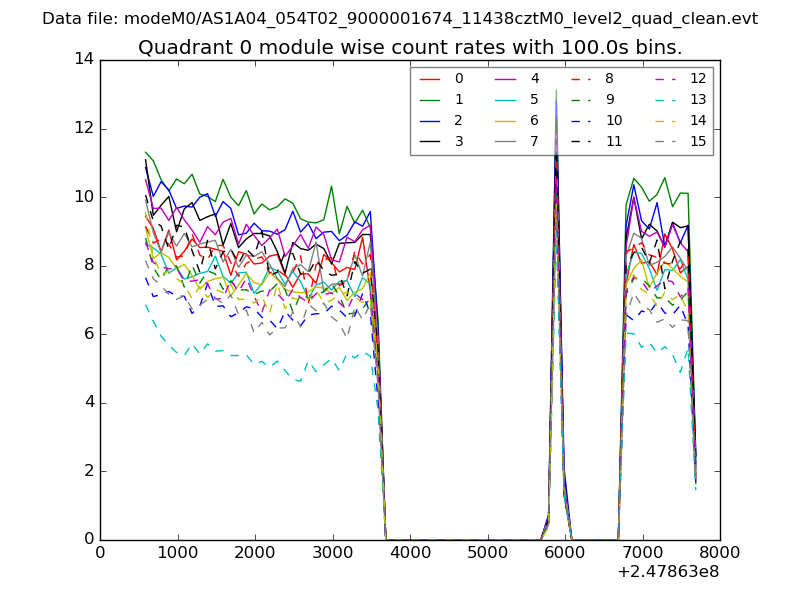
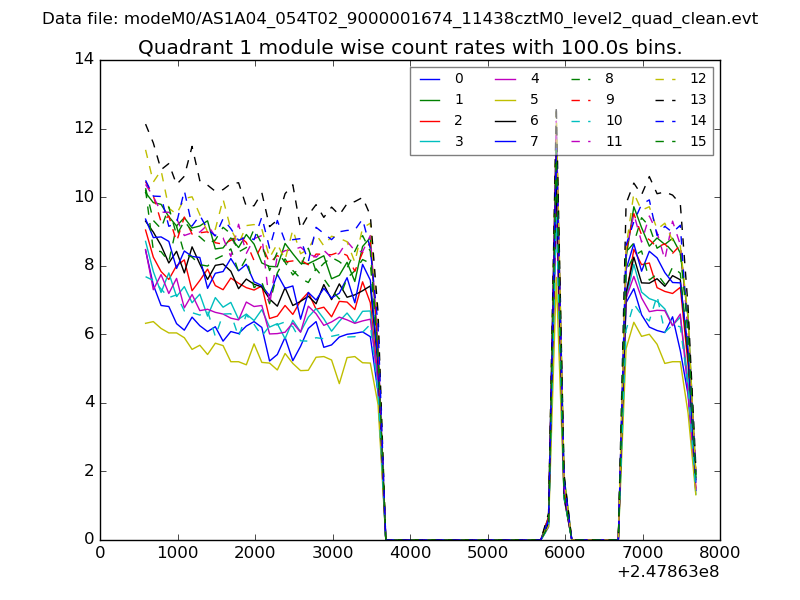
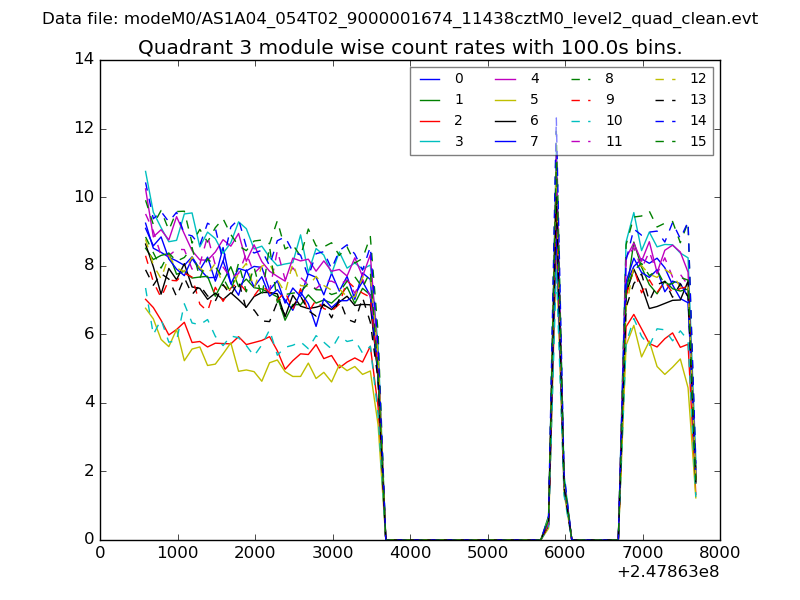
| Module-wise count rates for Quadrant A Data is divided into 100 sec bins |
 |
 |
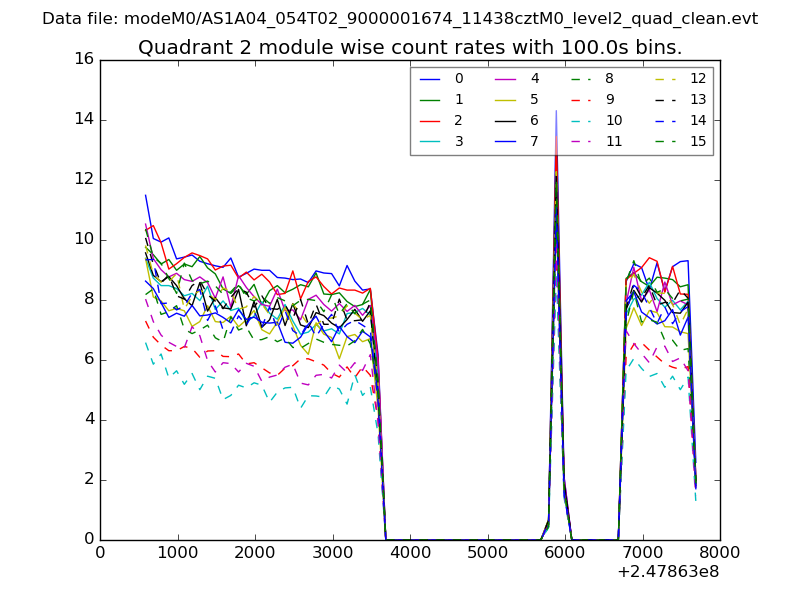
| Module-wise count rates for Quadrant B Data is divided into 100 sec bins |
 |
 |
| Module-wise count rates for Quadrant C Data is divided into 100 sec bins |
 |
 |
| Module-wise count rates for Quadrant D Data is divided into 100 sec bins |
 |
 |
| Parameter | Plot |
|---|---|
| CZT HV Monitor | 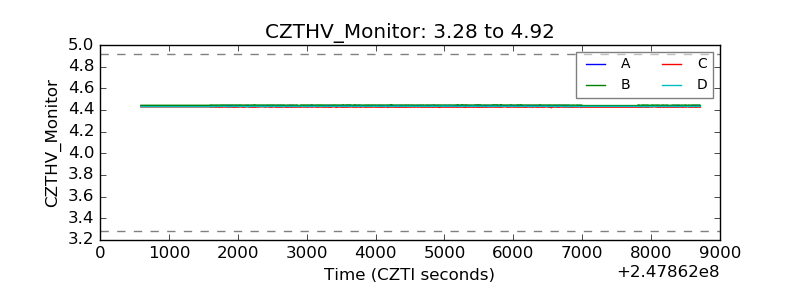 |
| D_VDD | 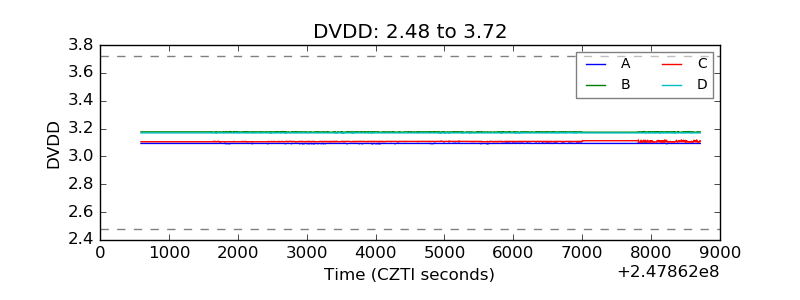 |
| Temperature 1 | 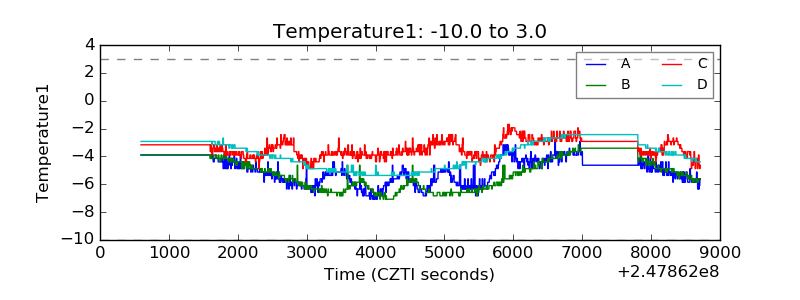 |
| Veto HV Monitor | 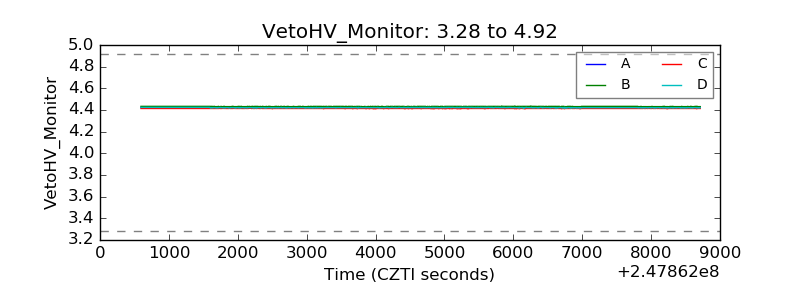 |
| Veto LLD | 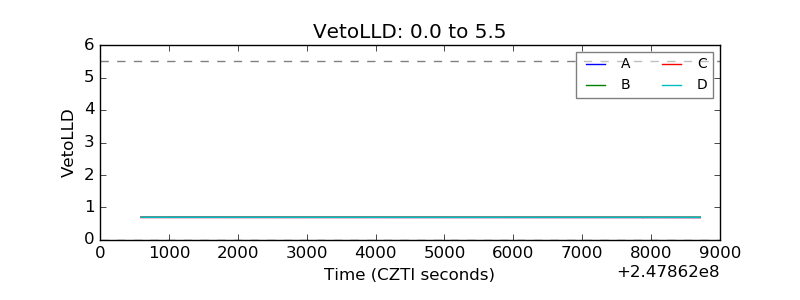 |
| Alpha Counter | 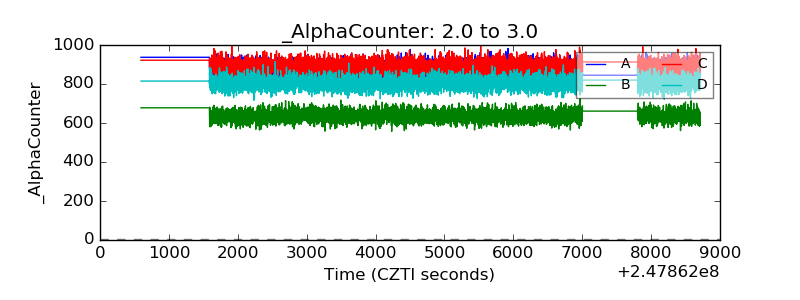 |
| _CPM_Rate | 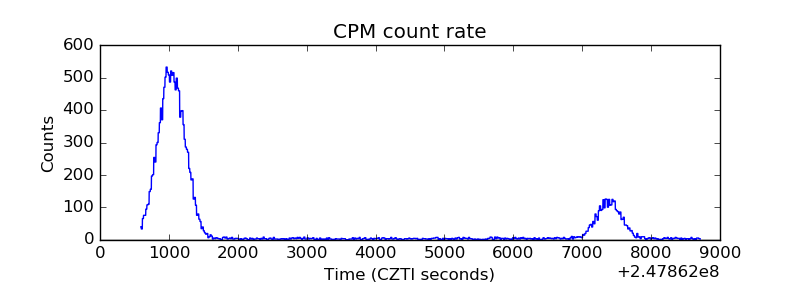 |
| CZT Counter |  |
| +2.5 Volts monitor |  |
| +5 Volts monitor |  |
| _ROLL_ROT | 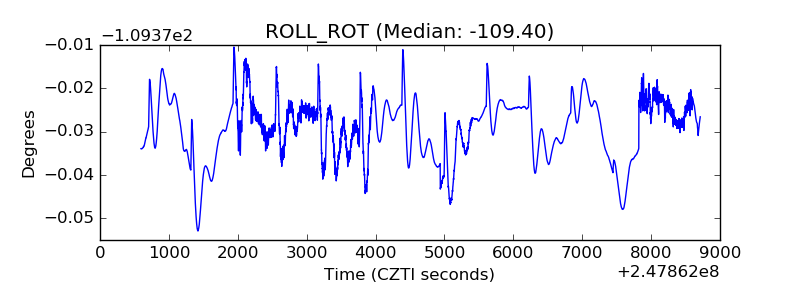 |
| _Roll_DEC | 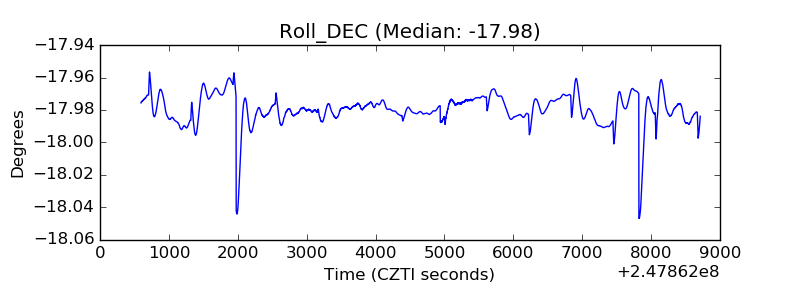 |
| _Roll_RA | 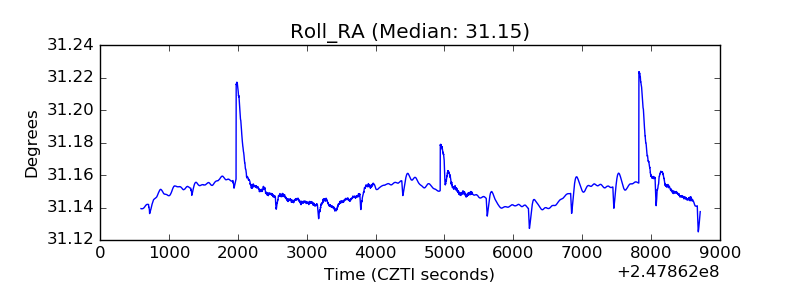 |
| Veto Counter | 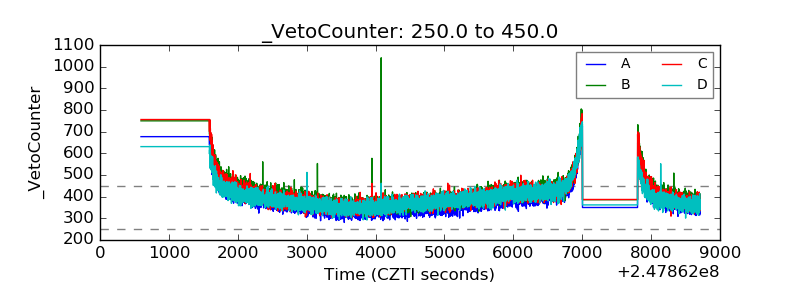 |