| Param | Original file | Final file |
|---|---|---|
| Filename | modeM0/AS1G08_010T01_9000001672cztM0_level2.fits | modeM0/AS1G08_010T01_9000001672cztM0_level2_quad_clean.evt |
| Size (bytes) | 323,965,440 | 320,405,760 |
| Size | 309.0 MB | 305.6 MB |
| Events in quadrant A | 2,003,912 | 1,983,312 |
| Events in quadrant B | 1,885,800 | 1,861,128 |
| Events in quadrant C | 1,943,604 | 1,849,386 |
| Events in quadrant D | 1,689,492 | 1,721,669 |
| Mode SS | |||
|---|---|---|---|
| Quadrant | BADHDUFLAG | Total packets | Discarded packets |
| A | 0 | 678 | 0 |
| B | 0 | 678 | 0 |
| C | 0 | 678 | 0 |
| D | 0 | 678 | 0 |
| Mode M0 | |||
|---|---|---|---|
| Quadrant | BADHDUFLAG | Total packets | Discarded packets |
| A | 0 | 71641 | 0 |
| B | 0 | 91450 | 0 |
| C | 0 | 68910 | 0 |
| D | 0 | 76882 | 0 |
| Mode M9 | |||
|---|---|---|---|
| Quadrant | BADHDUFLAG | Total packets | Discarded packets |
| A | 0 | 71 | 0 |
| B | 0 | 71 | 0 |
| C | 0 | 71 | 0 |
| D | 0 | 71 | 0 |
| Quadrant | Total seconds | Saturated seconds | Saturation percentage |
|---|---|---|---|
| A | 33297 | 467 | 1.402529% |
| B | 33297 | 2085 | 6.261825% |
| C | 33297 | 293 | 0.879959% |
| D | 33297 | 768 | 2.306514% |
Noise dominated data is calculated using 1-second bins in cleaned event files. If a bin has >2000 counts, and if more than 50% of those come from <1% of pixels, then it is considered to be noise-dominated and hence unusable.
| Quadrant | # 1 sec bins | Bins with >0 counts | Bins with >2000 counts | High rate bins dominated by noise | Noise dominated (total time) | Noise dominated (detector-on time) | Marked lightcurve |
|---|---|---|---|---|---|---|---|
| A | 40211 | 33295 | 0 | 0 | 0.00% | 0.00% | 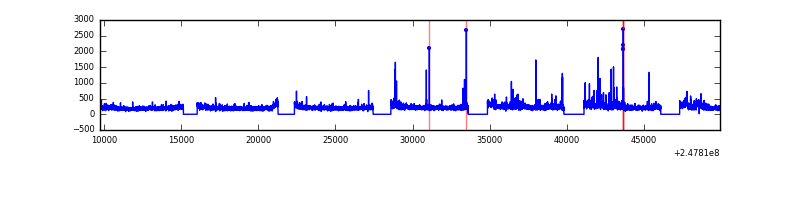 |
| B | 40211 | 33285 | 0 | 0 | 0.00% | 0.00% |  |
| C | 40211 | 33296 | 0 | 0 | 0.00% | 0.00% | 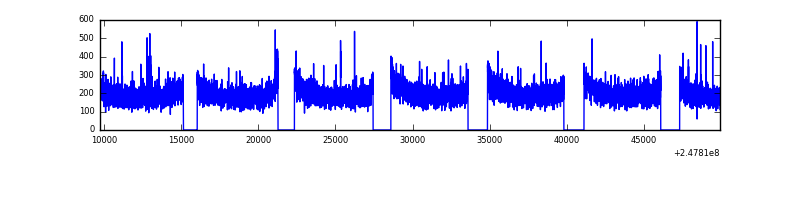 |
| D | 40211 | 33294 | 0 | 0 | 0.00% | 0.00% | 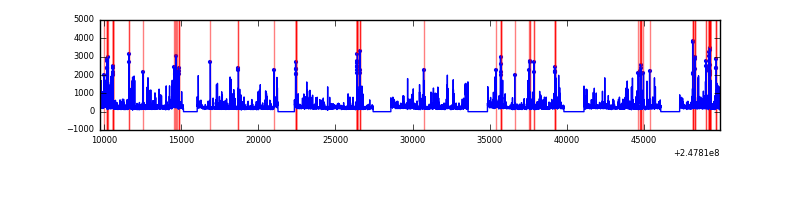 |
Top three noisy pixels from each quadrant. If the there are fewer than three noisy pixels in the level2.evt file, extra rows are filled as -1
| Pixel properties | Quadrant properties | ||||||
|---|---|---|---|---|---|---|---|
| Quadrant | DetID | PixID | Counts | Sigma | Mean | Median | Sigma |
| A | 0 | 29 | 2033 | 11.88 | 521 | 488 | 130.0 |
| A | 7 | 110 | 1651 | 8.94 | 521 | 488 | 130.0 |
| A | 0 | 30 | 1508 | 7.84 | 521 | 488 | 130.0 |
| B | 2 | 9 | 1645 | 11.53 | 498 | 476 | 101.4 |
| B | 3 | 17 | 1264 | 7.77 | 498 | 476 | 101.4 |
| B | 2 | 8 | 1260 | 7.73 | 498 | 476 | 101.4 |
| C | 1 | 80 | 1422 | 6.99 | 513 | 479 | 135.0 |
| C | 1 | 81 | 1419 | 6.97 | 513 | 479 | 135.0 |
| C | 2 | 191 | 1356 | 6.5 | 513 | 479 | 135.0 |
| D | 3 | 14 | 1245 | 6.21 | 482 | 439 | 129.9 |
| D | 6 | 231 | 1223 | 6.04 | 482 | 439 | 129.9 |
| D | 10 | 189 | 1199 | 5.85 | 482 | 439 | 129.9 |
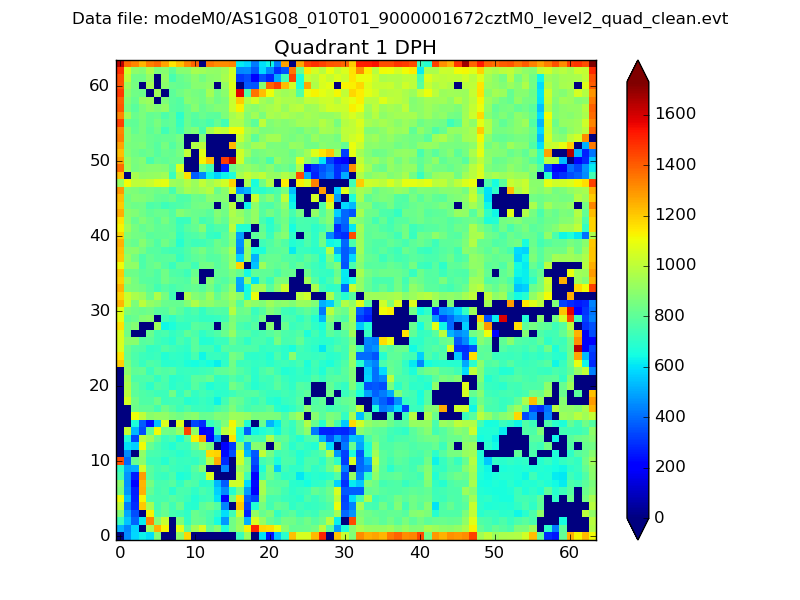
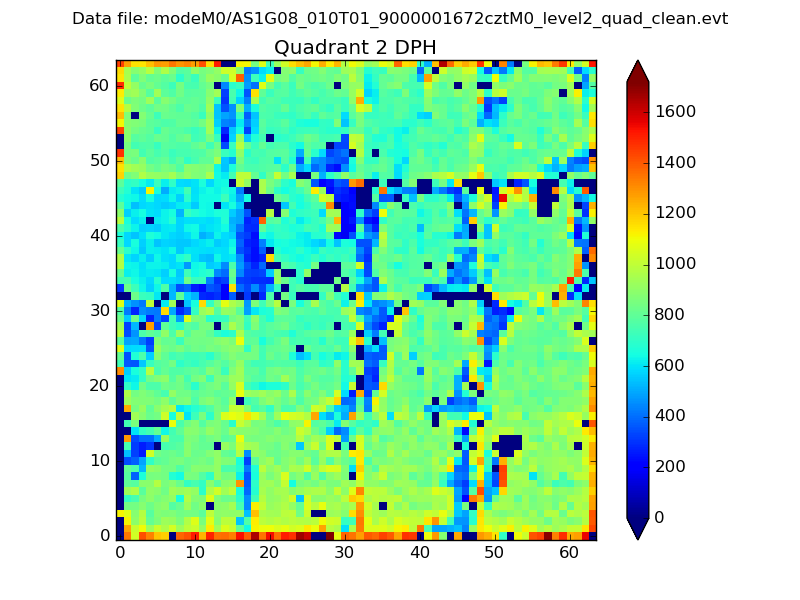
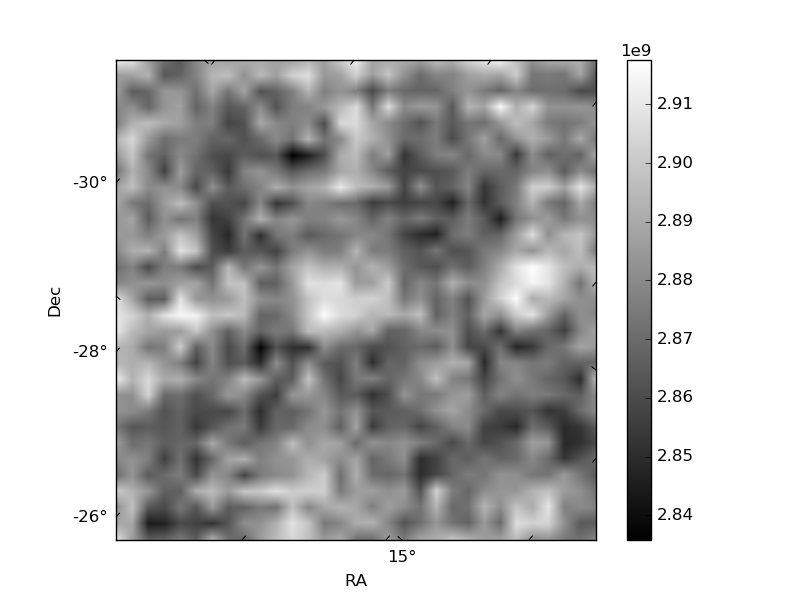
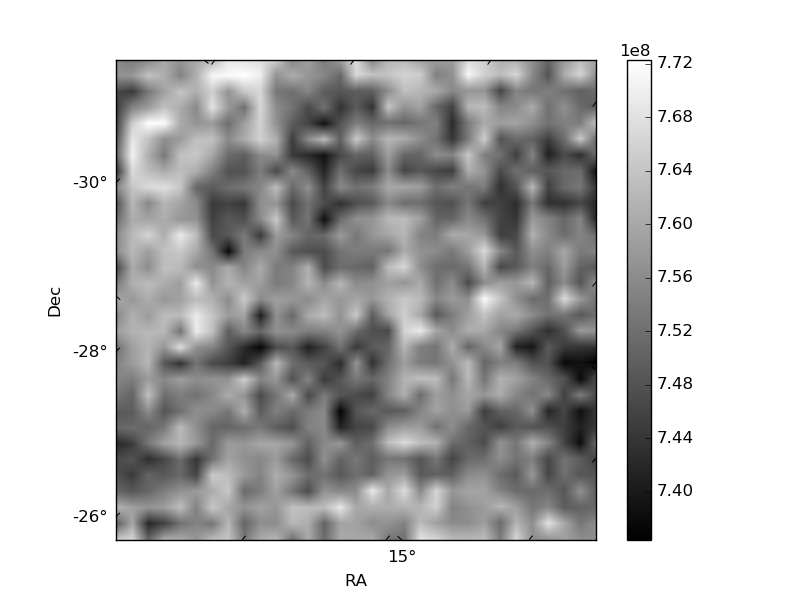
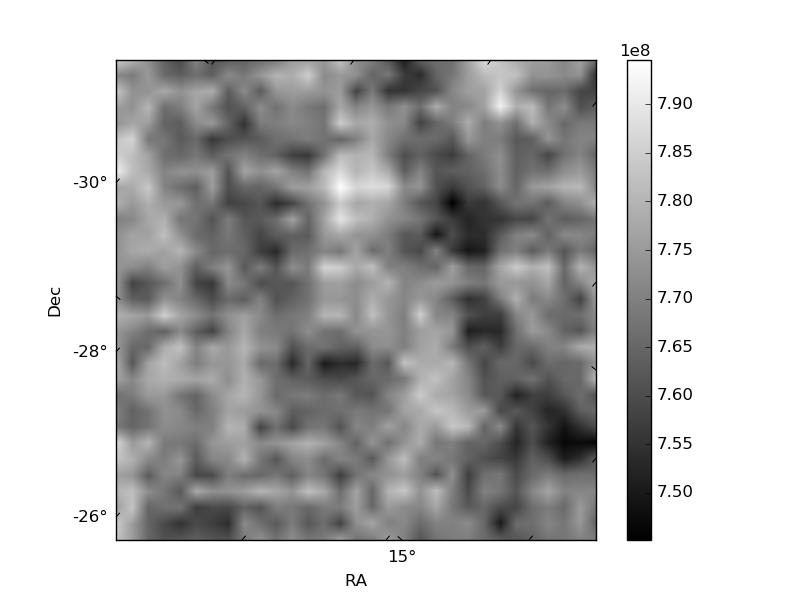
Histogram calculated using DETX and DETY for each event in the final _common_clean file
| Quadrant A | 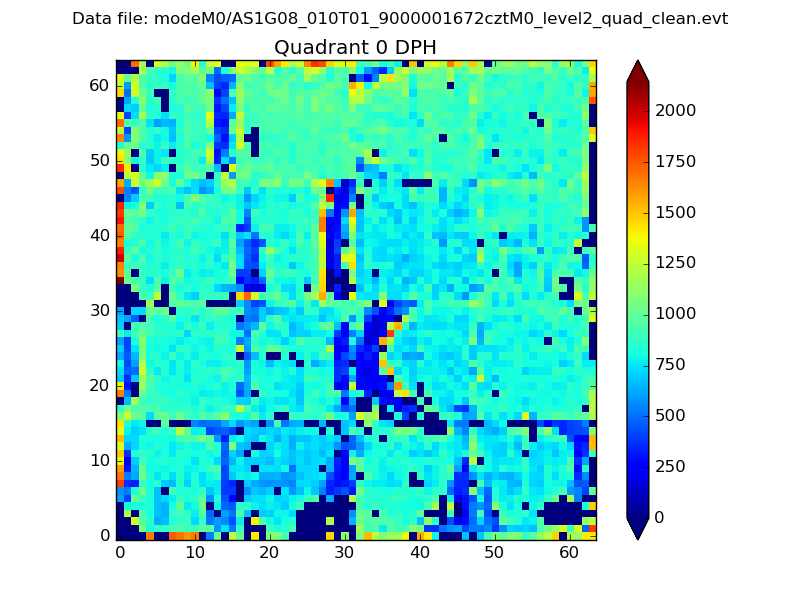 |
 |
Quadrant B |
|---|---|---|---|
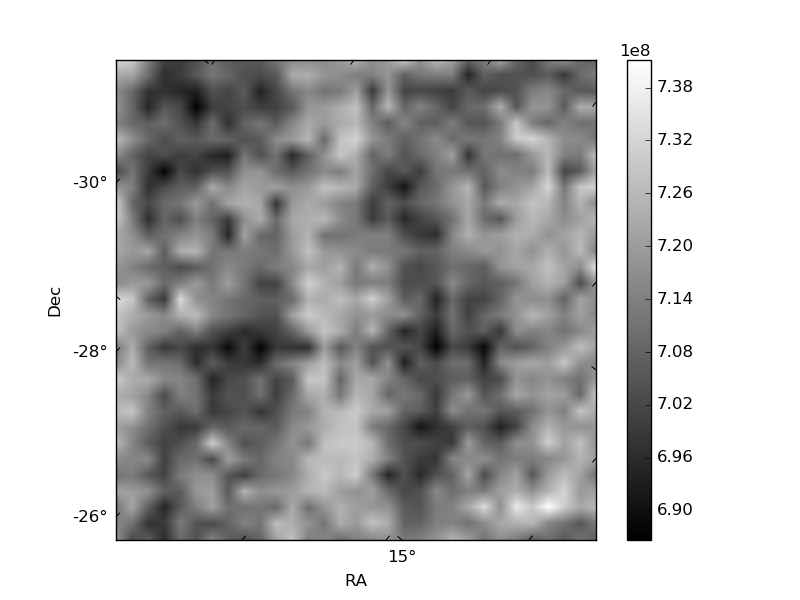
| Quadrant D | 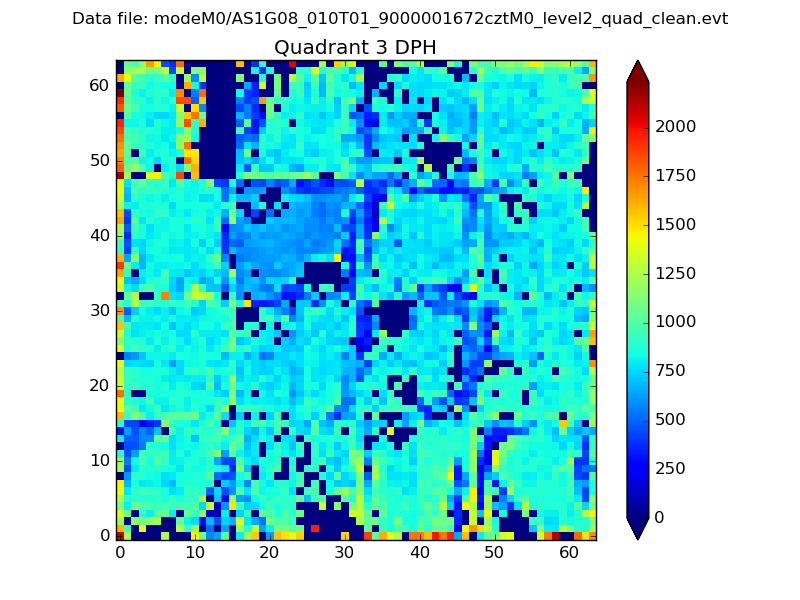 |
 |
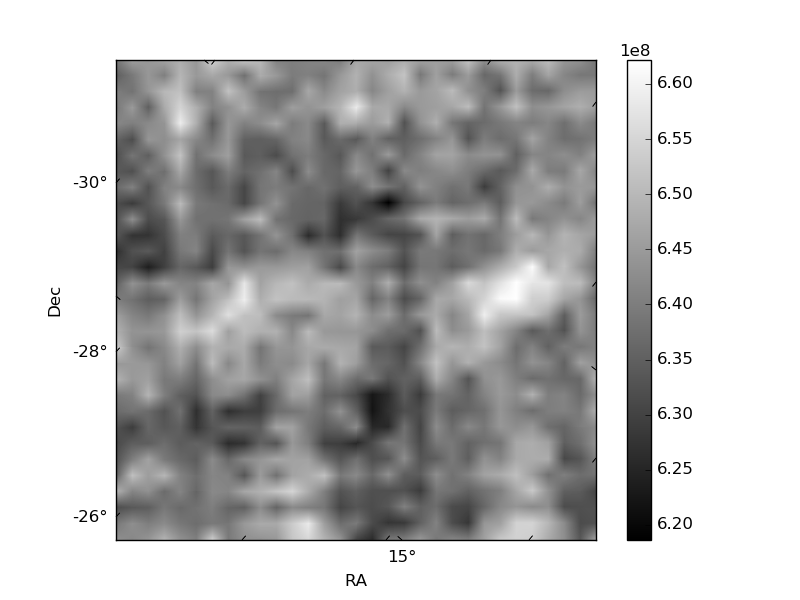
Quadrant C |
| Plot type | Count rate plots | Images |
|---|---|---|
| Comparison with Poisson distribution Blue bars denote a histogram of data divided into 1 sec bins. Red curve is a Poisson curve with rate = median count rate of data. |
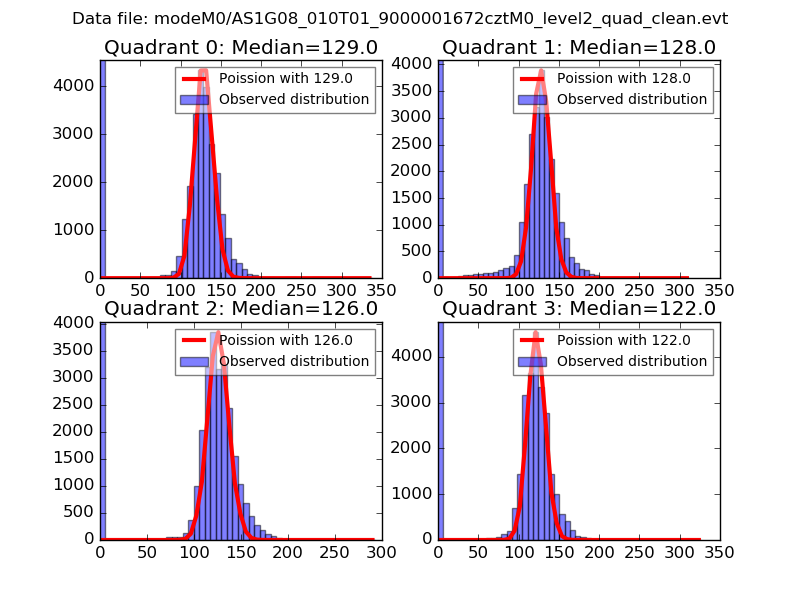 |
 |
| Quadrant-wise count rates Data is divided into 100 sec bins |
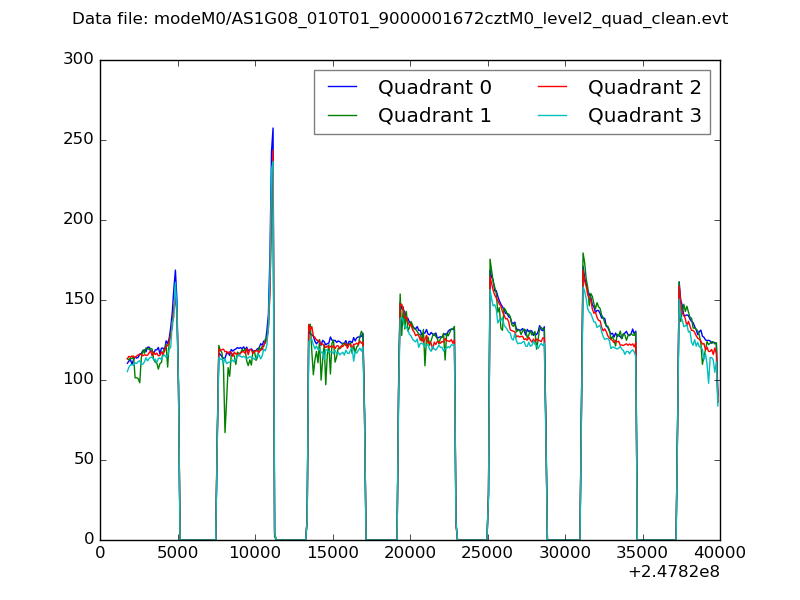 |
|
| Module-wise count rates for Quadrant A Data is divided into 100 sec bins |
 |
 |
| Module-wise count rates for Quadrant B Data is divided into 100 sec bins |
 |
 |
| Module-wise count rates for Quadrant C Data is divided into 100 sec bins |
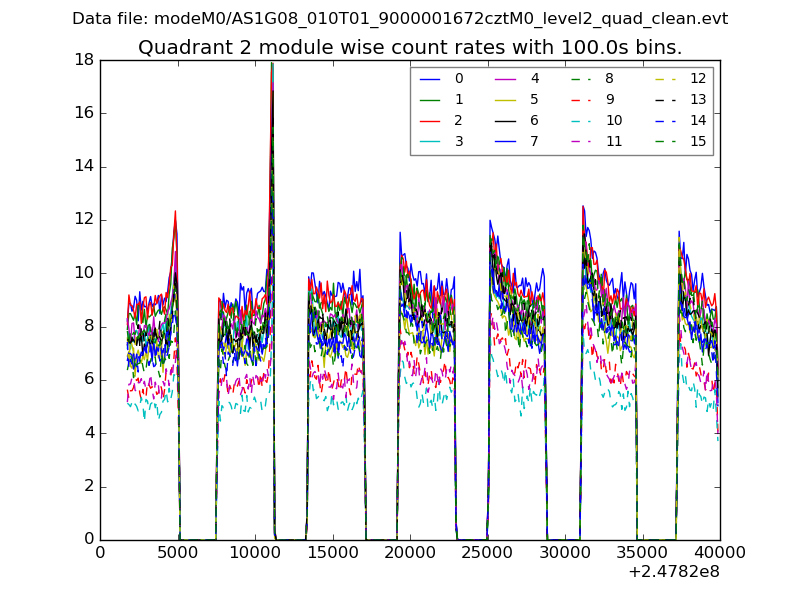 |
 |
| Module-wise count rates for Quadrant D Data is divided into 100 sec bins |
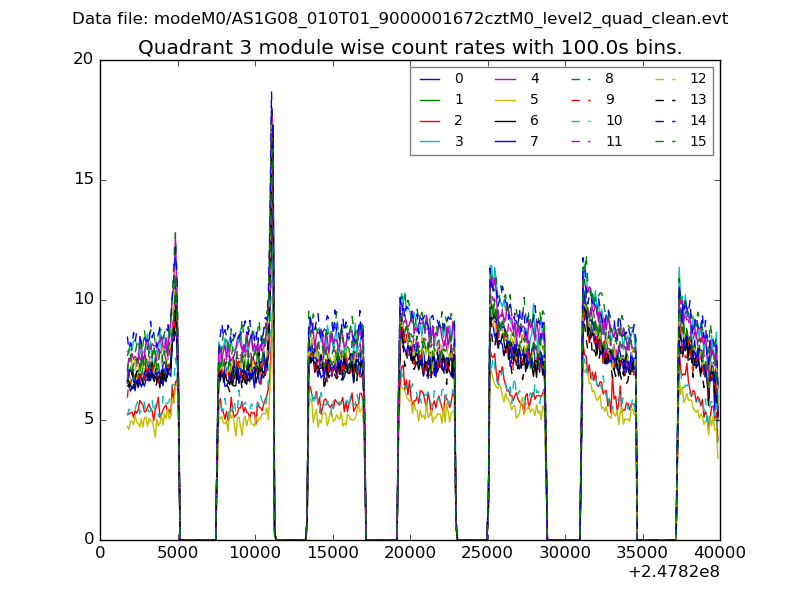 |
 |
| Parameter | Plot |
|---|---|
| CZT HV Monitor | 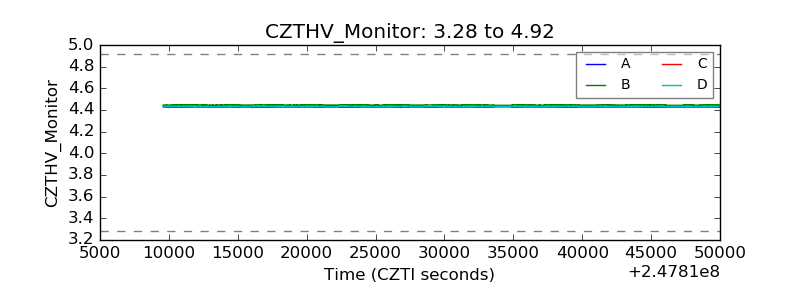 |
| D_VDD | 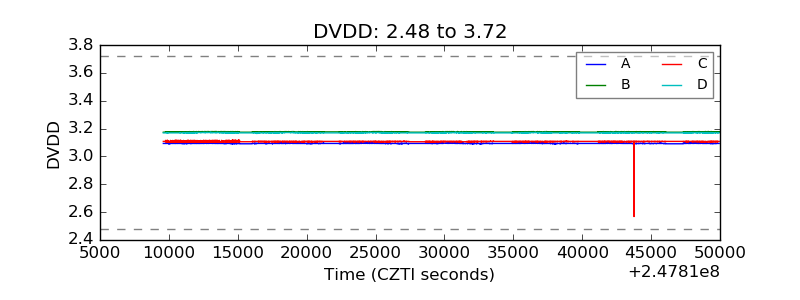 |
| Temperature 1 | 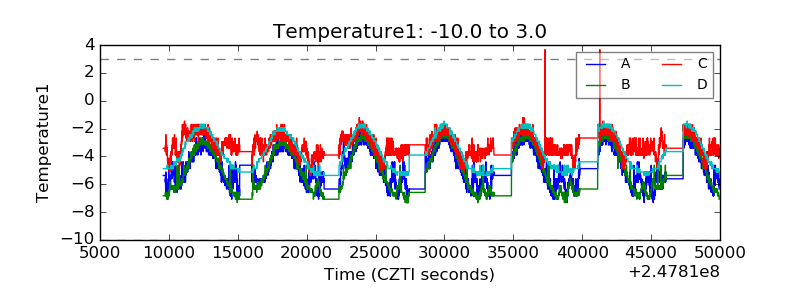 |
| Veto HV Monitor | 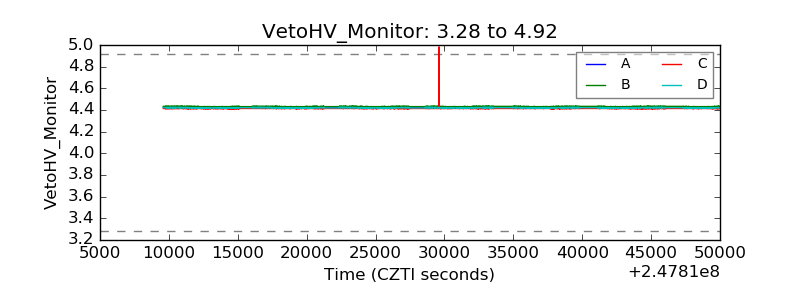 |
| Veto LLD | 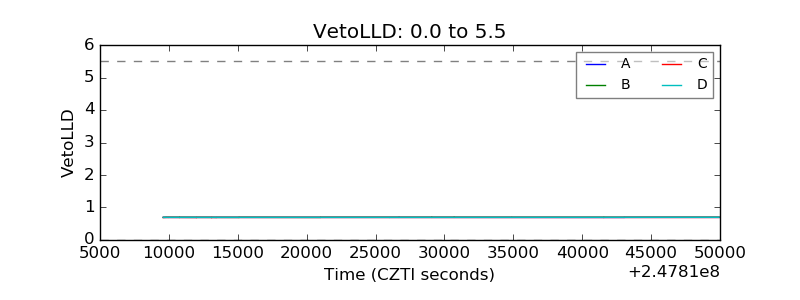 |
| Alpha Counter |  |
| _CPM_Rate | 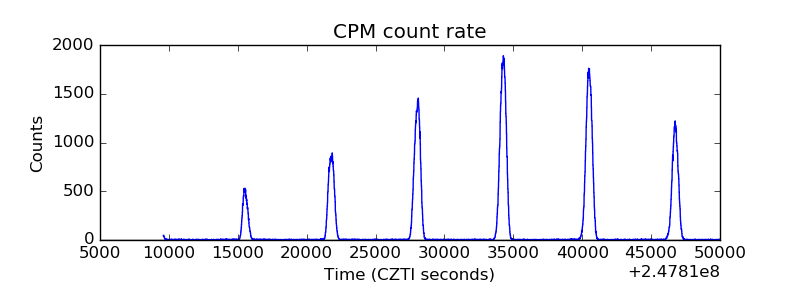 |
| CZT Counter | 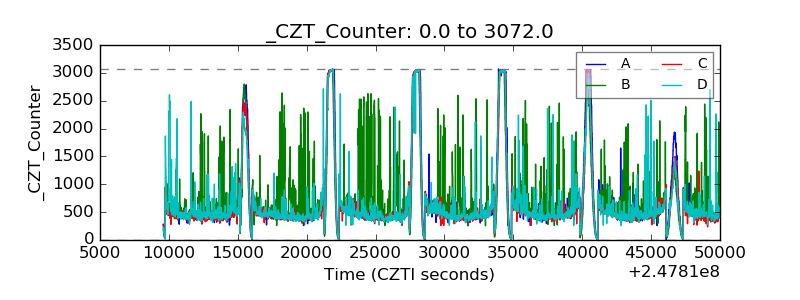 |
| +2.5 Volts monitor | 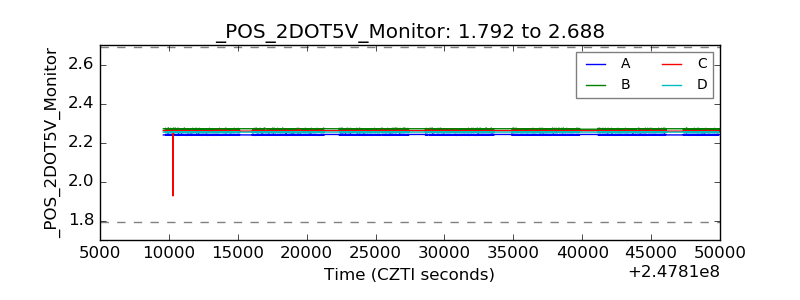 |
| +5 Volts monitor |  |
| _ROLL_ROT | 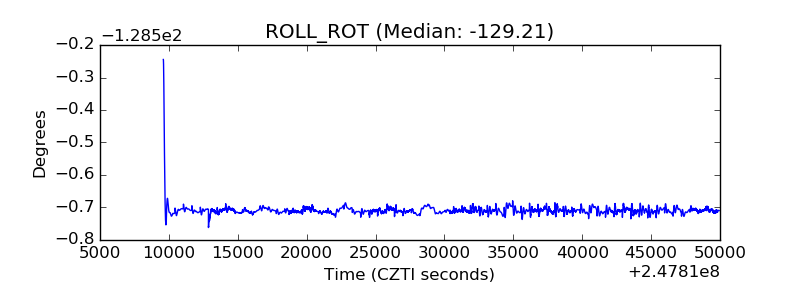 |
| _Roll_DEC | 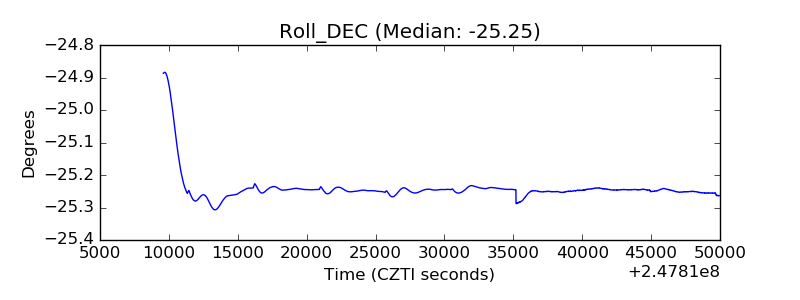 |
| _Roll_RA | 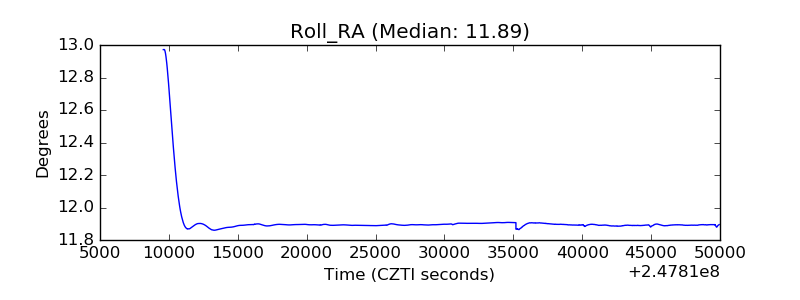 |
| Veto Counter |  |