| Param | Original file | Final file |
|---|---|---|
| Filename | modeM0/AS1G08_010T01_9000001672_11431cztM0_level2.evt | modeM0/AS1G08_010T01_9000001672_11431cztM0_level2_quad_clean.evt |
| Size (bytes) | 491,575,680 | 80,087,040 |
| Size | 468.8 MB | 76.4 MB |
| Events in quadrant A | 3,264,381 | 505,223 |
| Events in quadrant B | 4,657,103 | 478,610 |
| Events in quadrant C | 3,099,868 | 495,033 |
| Events in quadrant D | 3,416,879 | 484,643 |
| Mode SS | |||
|---|---|---|---|
| Quadrant | BADHDUFLAG | Total packets | Discarded packets |
| A | 0 | 134 | 0 |
| B | 0 | 134 | 0 |
| C | 0 | 134 | 0 |
| D | 0 | 134 | 0 |
| Mode M0 | |||
|---|---|---|---|
| Quadrant | BADHDUFLAG | Total packets | Discarded packets |
| A | 0 | 13977 | 3 |
| B | 0 | 18087 | 2 |
| C | 0 | 13776 | 2 |
| D | 0 | 14768 | 2 |
| Mode M9 | |||
|---|---|---|---|
| Quadrant | BADHDUFLAG | Total packets | Discarded packets |
| A | 0 | 15 | 0 |
| B | 0 | 15 | 0 |
| C | 0 | 15 | 0 |
| D | 0 | 16 | 0 |
| Quadrant | Total seconds | Saturated seconds | Saturation percentage |
|---|---|---|---|
| A | 6617 | 65 | 0.982318% |
| B | 6617 | 416 | 6.286837% |
| C | 6617 | 41 | 0.619616% |
| D | 6617 | 78 | 1.178782% |
Noise dominated data is calculated using 1-second bins in cleaned event files. If a bin has >2000 counts, and if more than 50% of those come from <1% of pixels, then it is considered to be noise-dominated and hence unusable.
| Quadrant | # 1 sec bins | Bins with >0 counts | Bins with >2000 counts | High rate bins dominated by noise | Noise dominated (total time) | Noise dominated (detector-on time) | Marked lightcurve |
|---|---|---|---|---|---|---|---|
| A | 7687 | 6618 | 1 | 1 | 0.01% | 0.02% | 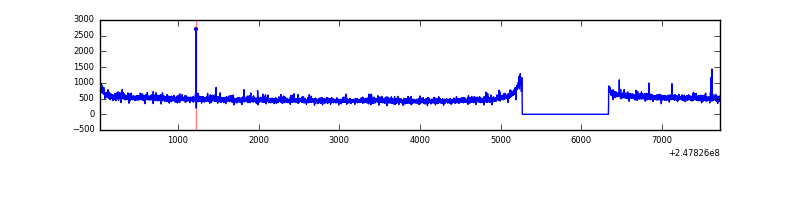 |
| B | 7687 | 6618 | 218 | 218 | 2.84% | 3.29% |  |
| C | 7687 | 6618 | 0 | 0 | 0.00% | 0.00% | 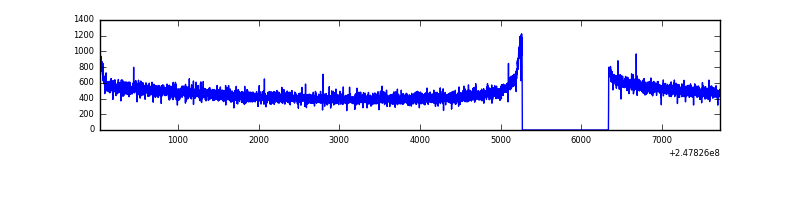 |
| D | 7687 | 6618 | 31 | 31 | 0.40% | 0.47% |  |
Top three noisy pixels from each quadrant. If the there are fewer than three noisy pixels in the level2.evt file, extra rows are filled as -1
| Pixel properties | Quadrant properties | ||||||
|---|---|---|---|---|---|---|---|
| Quadrant | DetID | PixID | Counts | Sigma | Mean | Median | Sigma |
| A | 1 | 162 | 33476 | 191.33 | 826 | 808 | 170.7 |
| A | 1 | 178 | 18597 | 104.19 | 826 | 808 | 170.7 |
| A | 1 | 161 | 16094 | 89.53 | 826 | 808 | 170.7 |
| B | 4 | 239 | 1090091 | 7112.55 | 804 | 785 | 153.2 |
| B | 3 | 64 | 225358 | 1466.34 | 804 | 785 | 153.2 |
| B | 3 | 189 | 63695 | 410.77 | 804 | 785 | 153.2 |
| C | 13 | 61 | 5679 | 26.47 | 794 | 798 | 184.4 |
| C | 3 | 202 | 2009 | 6.57 | 794 | 798 | 184.4 |
| C | 14 | 67 | 1944 | 6.22 | 794 | 798 | 184.4 |
| D | 10 | 253 | 94592 | 492.18 | 795 | 775 | 190.6 |
| D | 1 | 52 | 77389 | 401.93 | 795 | 775 | 190.6 |
| D | 13 | 104 | 62154 | 322.0 | 795 | 775 | 190.6 |
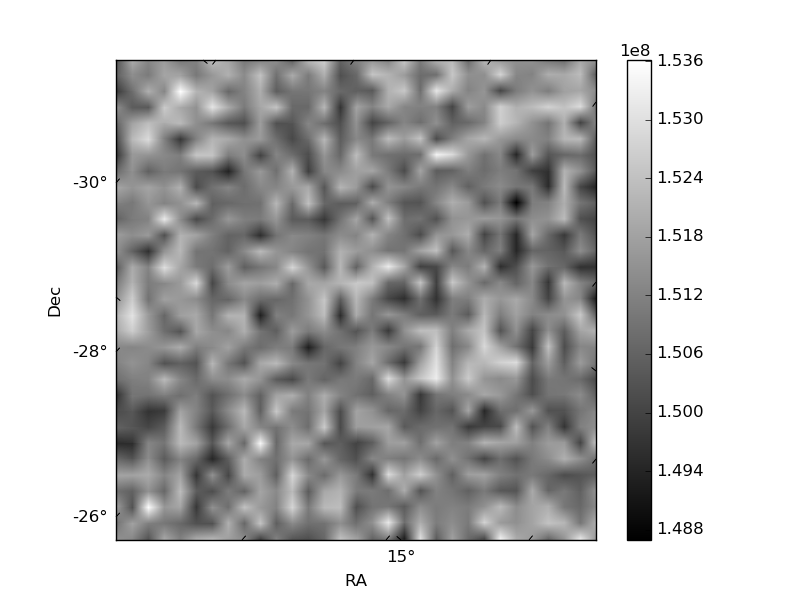
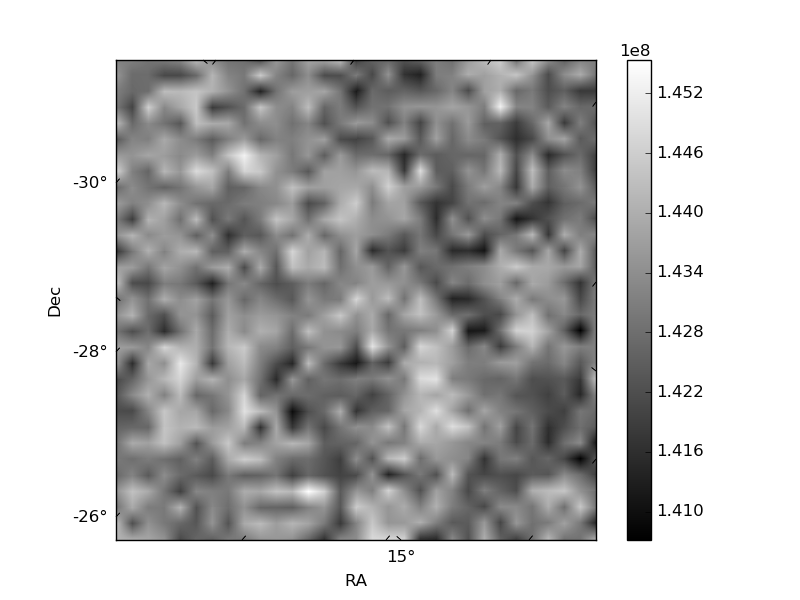
Histogram calculated using DETX and DETY for each event in the final _common_clean file
| Quadrant A | 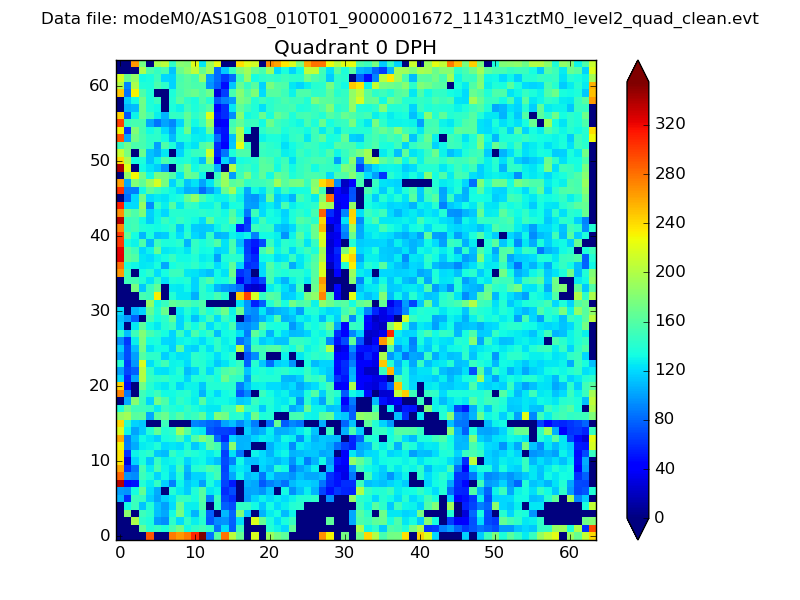 |
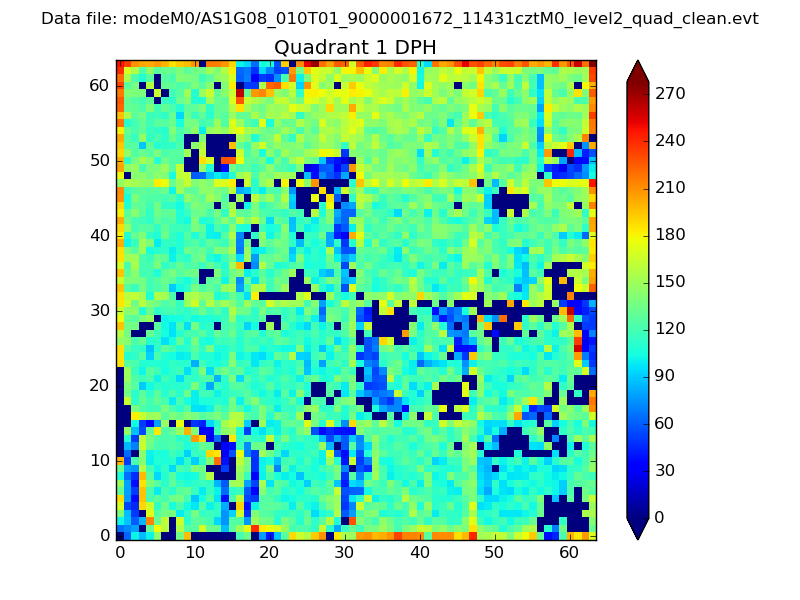 |
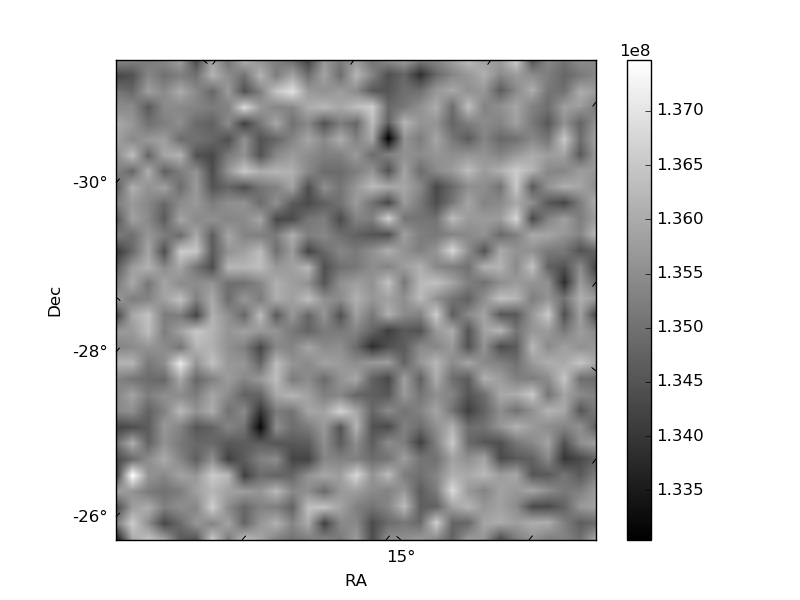
Quadrant B |
|---|---|---|---|
| Quadrant D |  |
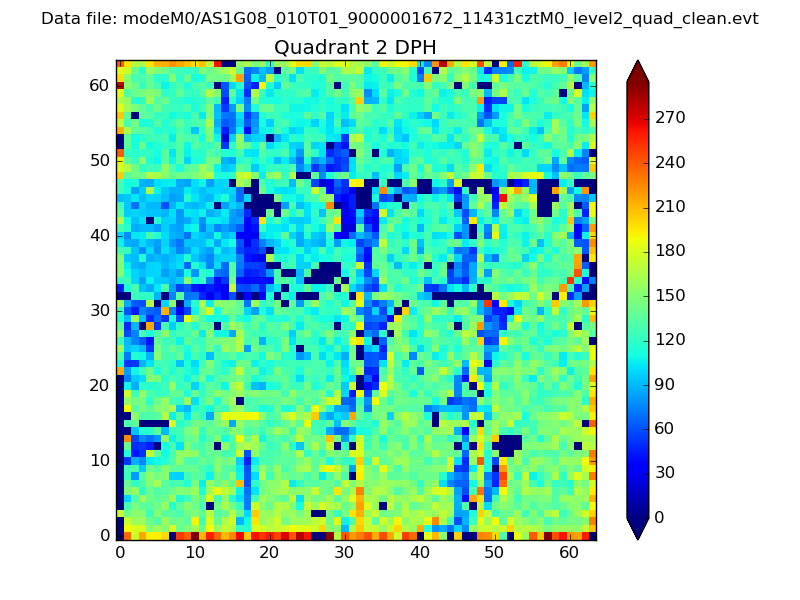 |
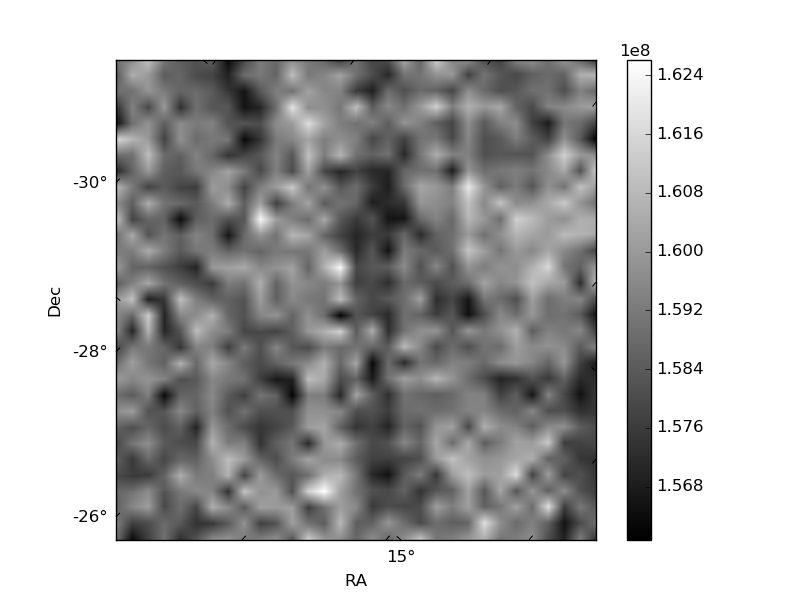
Quadrant C |
| Plot type | Count rate plots | Images |
|---|---|---|
| Comparison with Poisson distribution Blue bars denote a histogram of data divided into 1 sec bins. Red curve is a Poisson curve with rate = median count rate of data. |
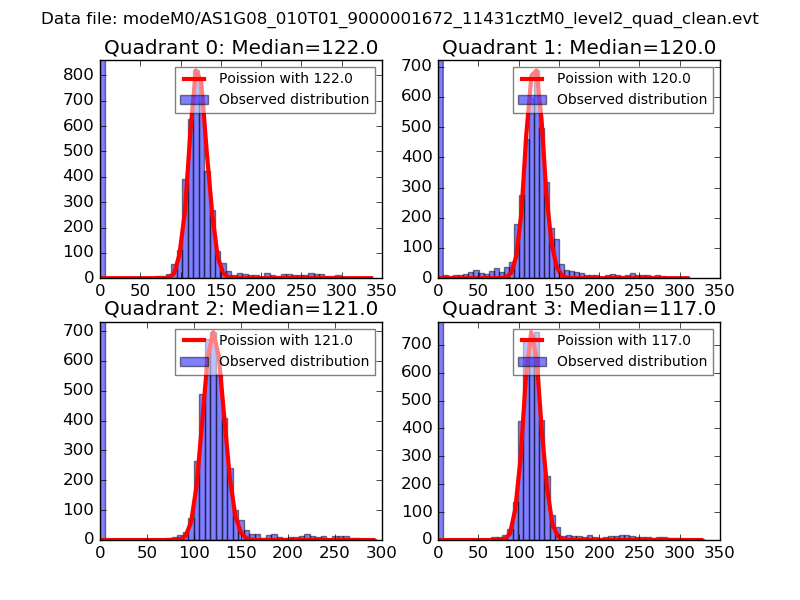 |
 |
| Quadrant-wise count rates Data is divided into 100 sec bins |
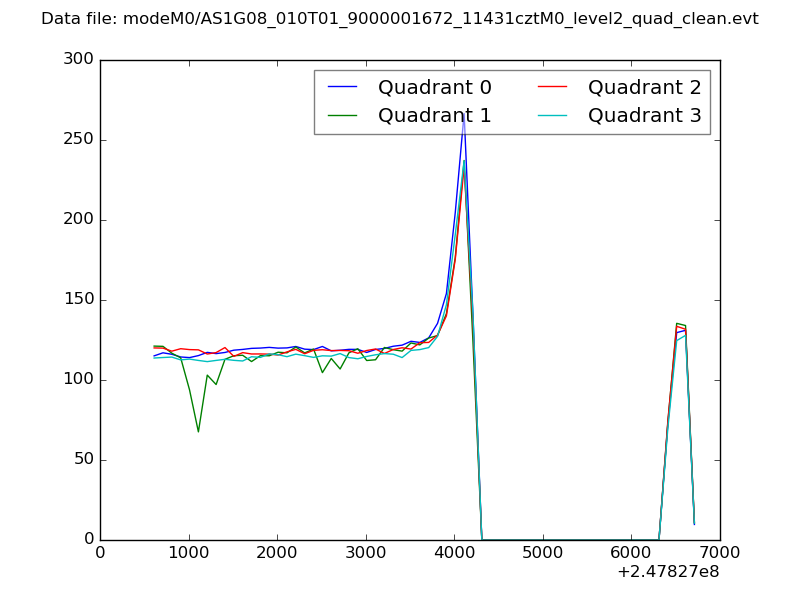 |
|
| Module-wise count rates for Quadrant A Data is divided into 100 sec bins |
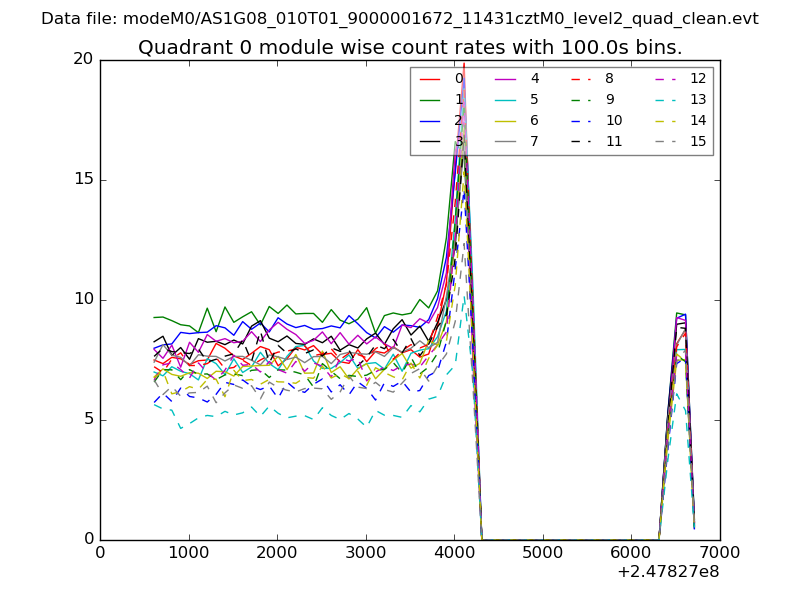 |
 |
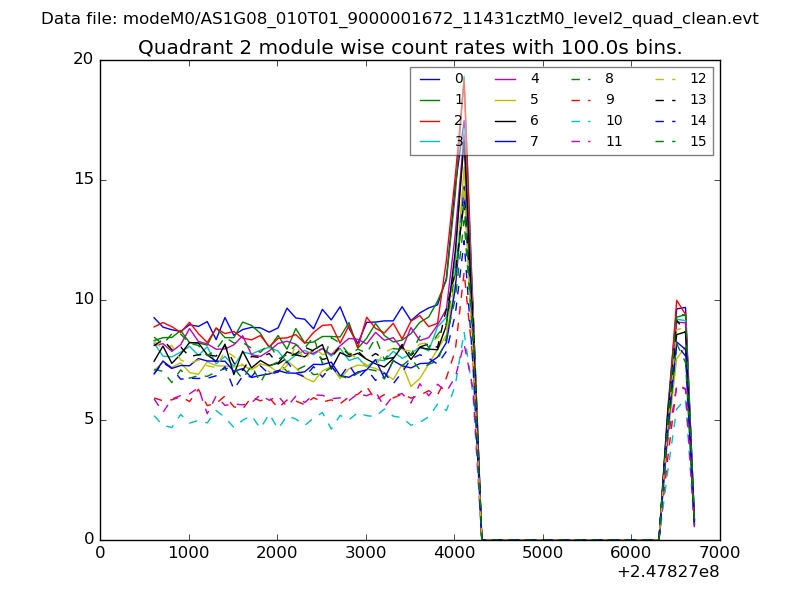
| Module-wise count rates for Quadrant B Data is divided into 100 sec bins |
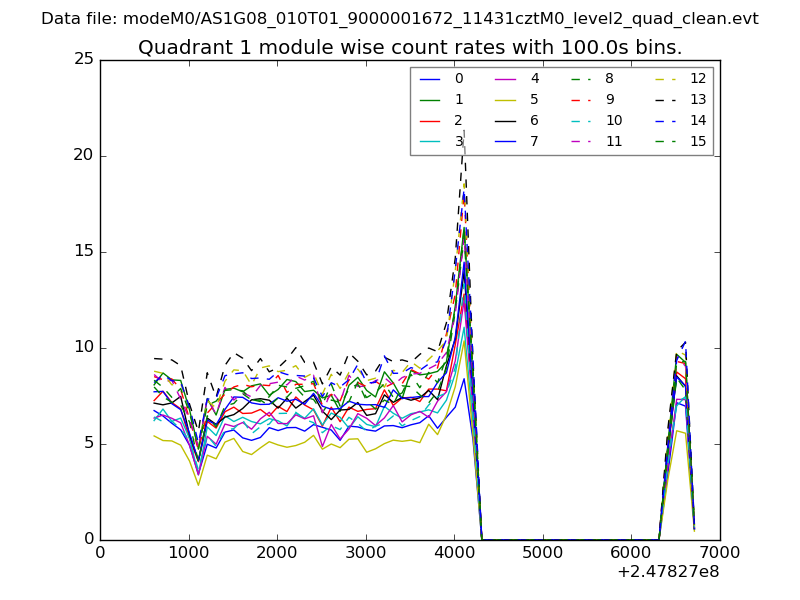 |
 |
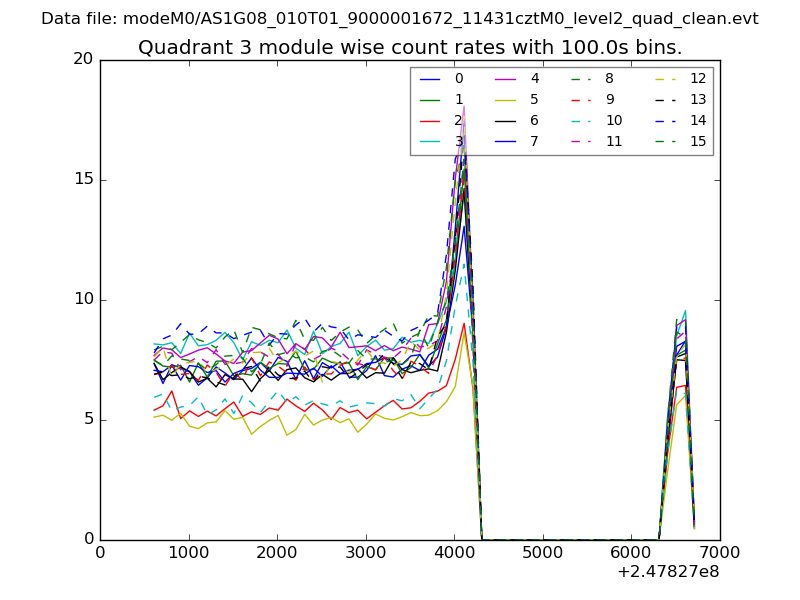
| Module-wise count rates for Quadrant C Data is divided into 100 sec bins |
 |
 |
| Module-wise count rates for Quadrant D Data is divided into 100 sec bins |
 |
 |
| Parameter | Plot |
|---|---|
| CZT HV Monitor | 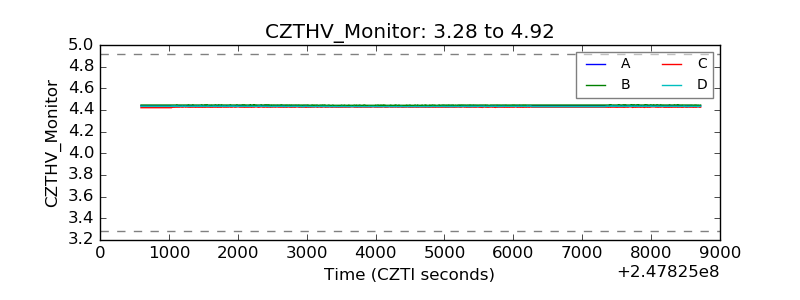 |
| D_VDD | 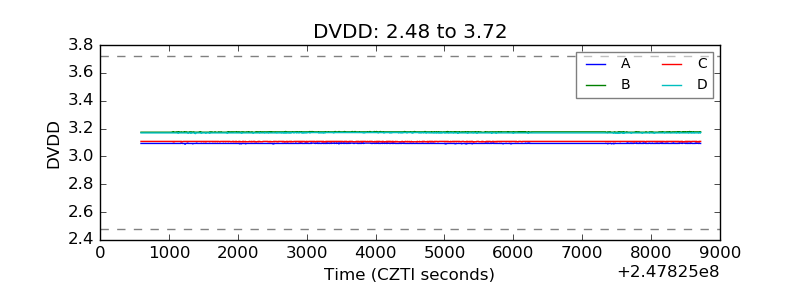 |
| Temperature 1 | 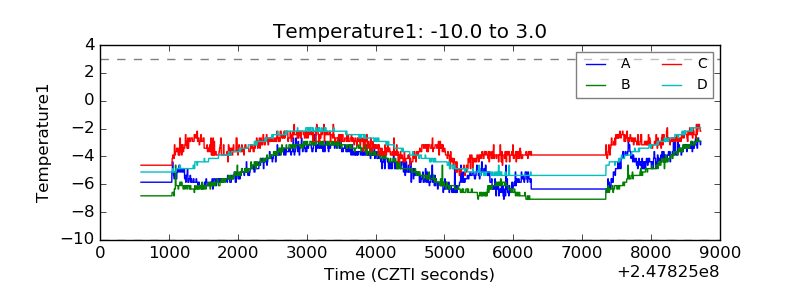 |
| Veto HV Monitor | 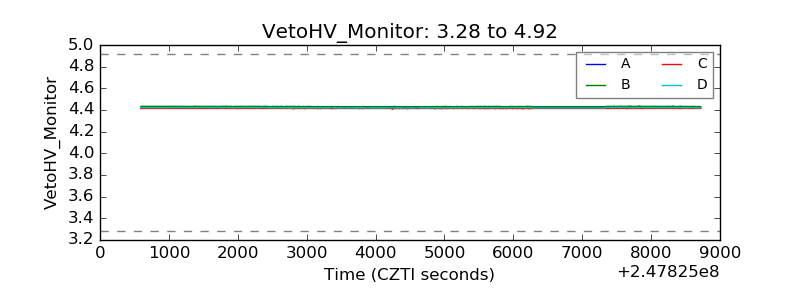 |
| Veto LLD |  |
| Alpha Counter | 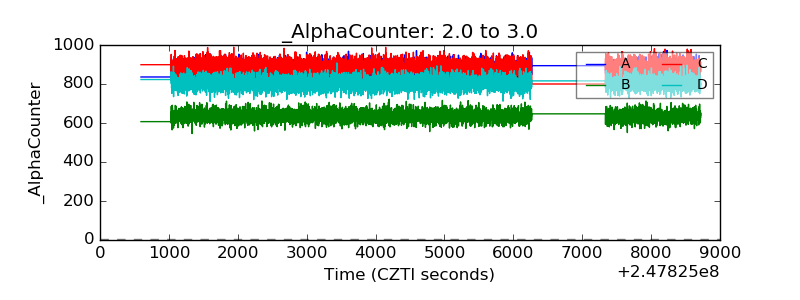 |
| _CPM_Rate | 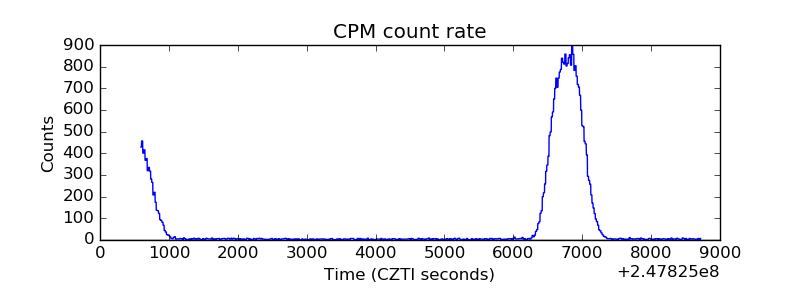 |
| CZT Counter | 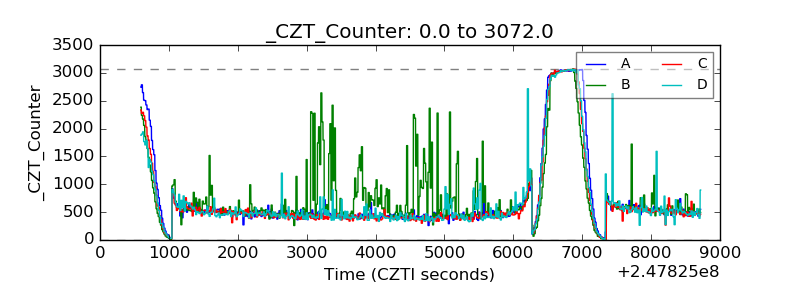 |
| +2.5 Volts monitor |  |
| +5 Volts monitor |  |
| _ROLL_ROT | 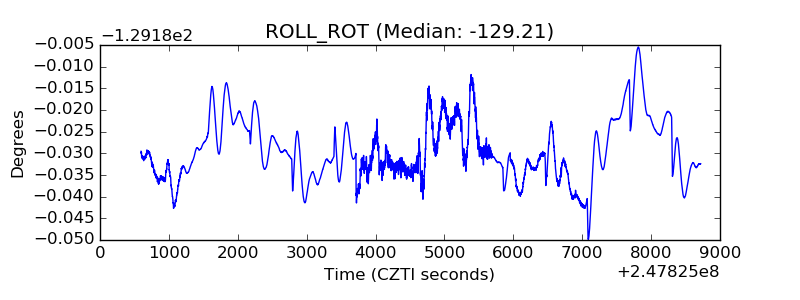 |
| _Roll_DEC | 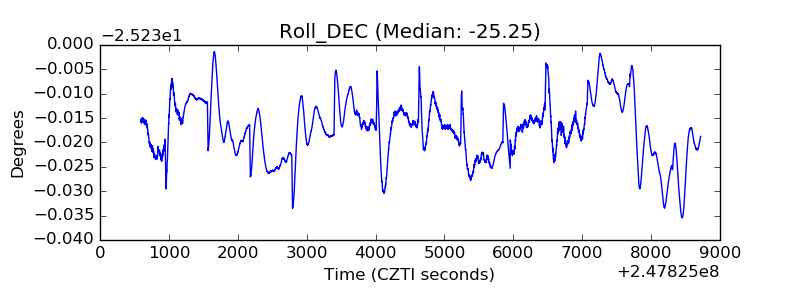 |
| _Roll_RA | 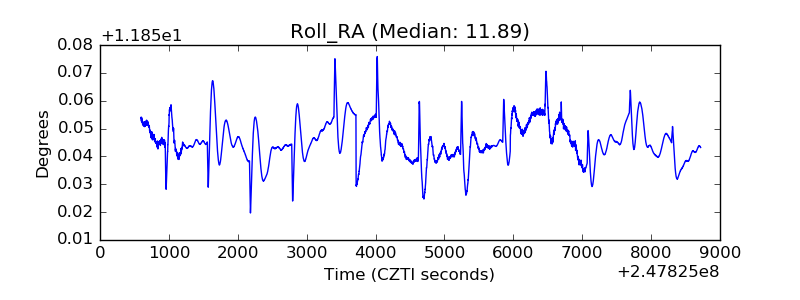 |
| Veto Counter | 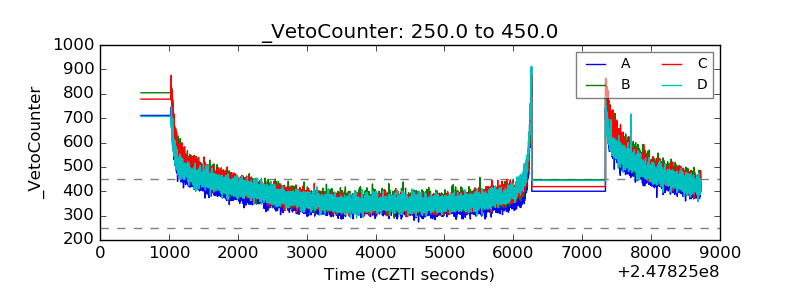 |