| Param | Original file | Final file |
|---|---|---|
| Filename | modeM0/AS1G08_010T01_9000001672_11432cztM0_level2.evt | modeM0/AS1G08_010T01_9000001672_11432cztM0_level2_quad_clean.evt |
| Size (bytes) | 510,644,160 | 88,467,840 |
| Size | 487.0 MB | 84.4 MB |
| Events in quadrant A | 3,347,478 | 571,139 |
| Events in quadrant B | 5,129,802 | 543,938 |
| Events in quadrant C | 3,154,922 | 564,459 |
| Events in quadrant D | 3,388,613 | 543,032 |
| Mode SS | |||
|---|---|---|---|
| Quadrant | BADHDUFLAG | Total packets | Discarded packets |
| A | 0 | 134 | 0 |
| B | 0 | 134 | 0 |
| C | 0 | 134 | 0 |
| D | 0 | 134 | 0 |
| Mode M0 | |||
|---|---|---|---|
| Quadrant | BADHDUFLAG | Total packets | Discarded packets |
| A | 0 | 14230 | 3 |
| B | 0 | 19640 | 2 |
| C | 0 | 13863 | 2 |
| D | 0 | 14531 | 2 |
| Mode M9 | |||
|---|---|---|---|
| Quadrant | BADHDUFLAG | Total packets | Discarded packets |
| A | 0 | 22 | 0 |
| B | 0 | 22 | 0 |
| C | 0 | 22 | 0 |
| D | 0 | 22 | 0 |
| Quadrant | Total seconds | Saturated seconds | Saturation percentage |
|---|---|---|---|
| A | 6546 | 115 | 1.756798% |
| B | 6546 | 571 | 8.722884% |
| C | 6546 | 77 | 1.176291% |
| D | 6546 | 122 | 1.863734% |
Noise dominated data is calculated using 1-second bins in cleaned event files. If a bin has >2000 counts, and if more than 50% of those come from <1% of pixels, then it is considered to be noise-dominated and hence unusable.
| Quadrant | # 1 sec bins | Bins with >0 counts | Bins with >2000 counts | High rate bins dominated by noise | Noise dominated (total time) | Noise dominated (detector-on time) | Marked lightcurve |
|---|---|---|---|---|---|---|---|
| A | 8771 | 6548 | 1 | 1 | 0.01% | 0.02% | 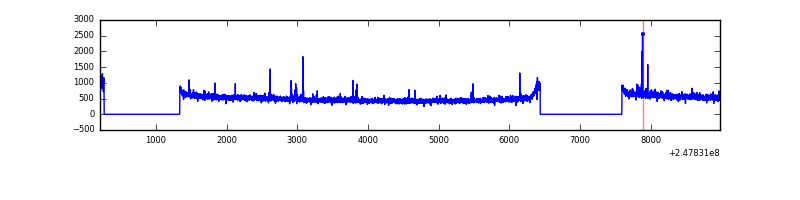 |
| B | 8771 | 6548 | 340 | 340 | 3.88% | 5.19% | 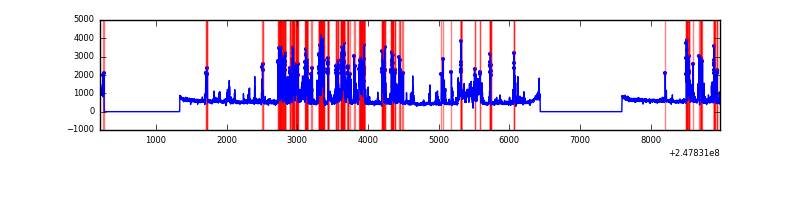 |
| C | 8771 | 6548 | 0 | 0 | 0.00% | 0.00% | 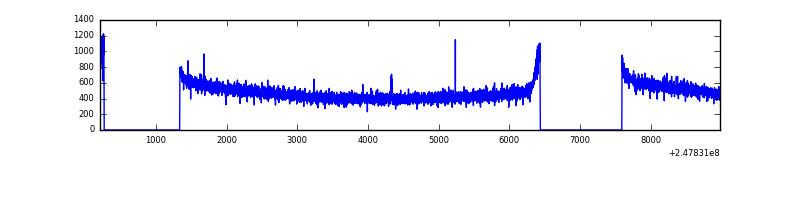 |
| D | 8771 | 6548 | 26 | 26 | 0.30% | 0.40% | 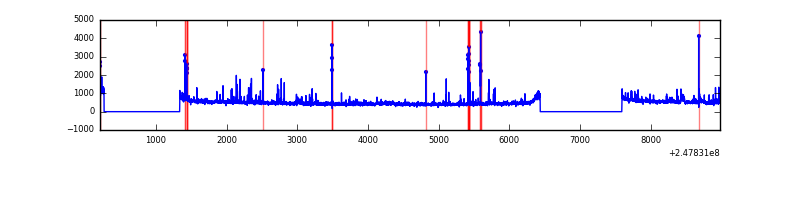 |
Top three noisy pixels from each quadrant. If the there are fewer than three noisy pixels in the level2.evt file, extra rows are filled as -1
| Pixel properties | Quadrant properties | ||||||
|---|---|---|---|---|---|---|---|
| Quadrant | DetID | PixID | Counts | Sigma | Mean | Median | Sigma |
| A | 1 | 162 | 28213 | 159.16 | 846 | 828 | 172.1 |
| A | 8 | 5 | 21524 | 120.28 | 846 | 828 | 172.1 |
| A | 1 | 178 | 14856 | 81.53 | 846 | 828 | 172.1 |
| B | 4 | 239 | 1148769 | 7412.17 | 820 | 801 | 154.9 |
| B | 3 | 64 | 411185 | 2649.76 | 820 | 801 | 154.9 |
| B | 3 | 189 | 278155 | 1790.81 | 820 | 801 | 154.9 |
| C | 13 | 61 | 5848 | 26.93 | 808 | 812 | 187.0 |
| C | 12 | 4 | 2919 | 11.27 | 808 | 812 | 187.0 |
| C | 3 | 202 | 2032 | 6.52 | 808 | 812 | 187.0 |
| D | 10 | 253 | 105320 | 534.07 | 811 | 789 | 195.7 |
| D | 2 | 120 | 35796 | 178.86 | 811 | 789 | 195.7 |
| D | 8 | 195 | 35079 | 175.2 | 811 | 789 | 195.7 |
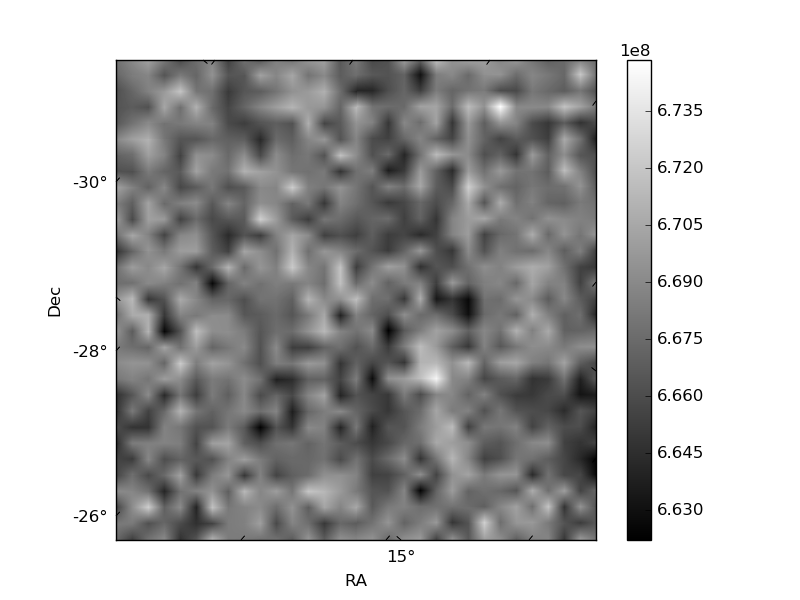
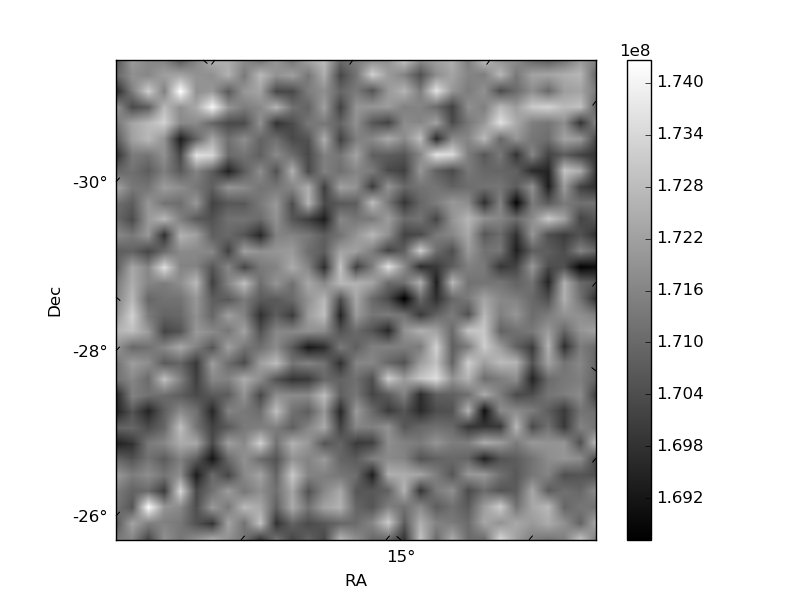
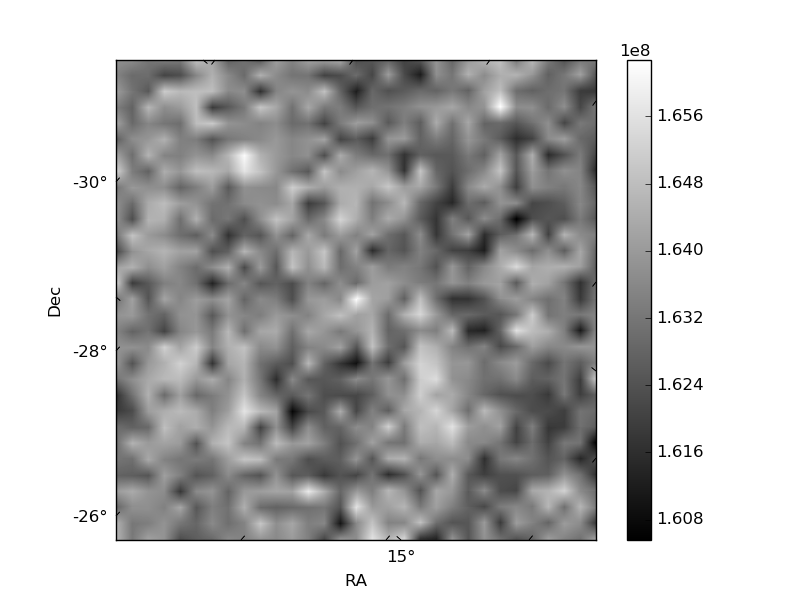
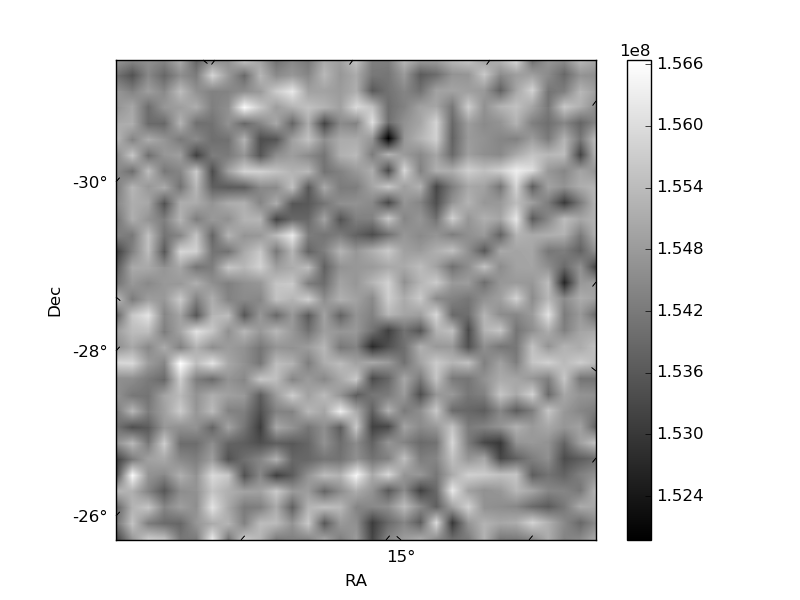
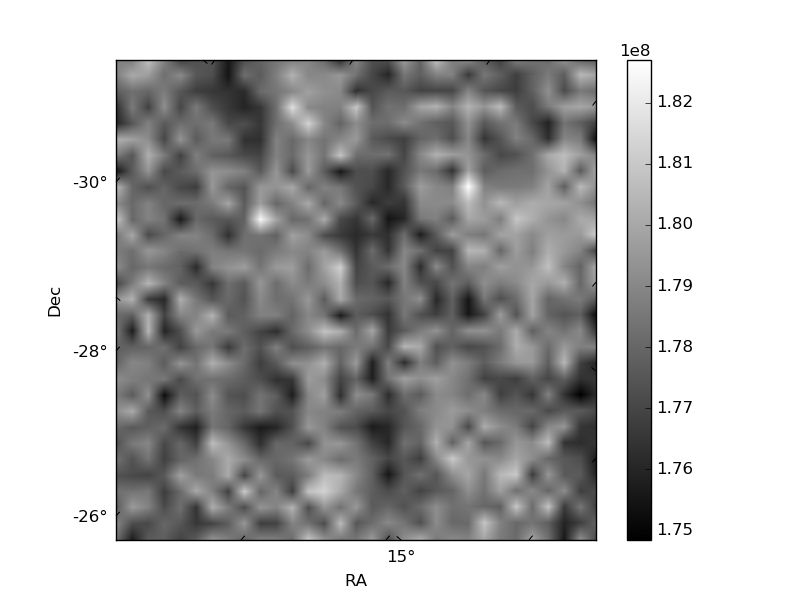
Histogram calculated using DETX and DETY for each event in the final _common_clean file
| Quadrant A | 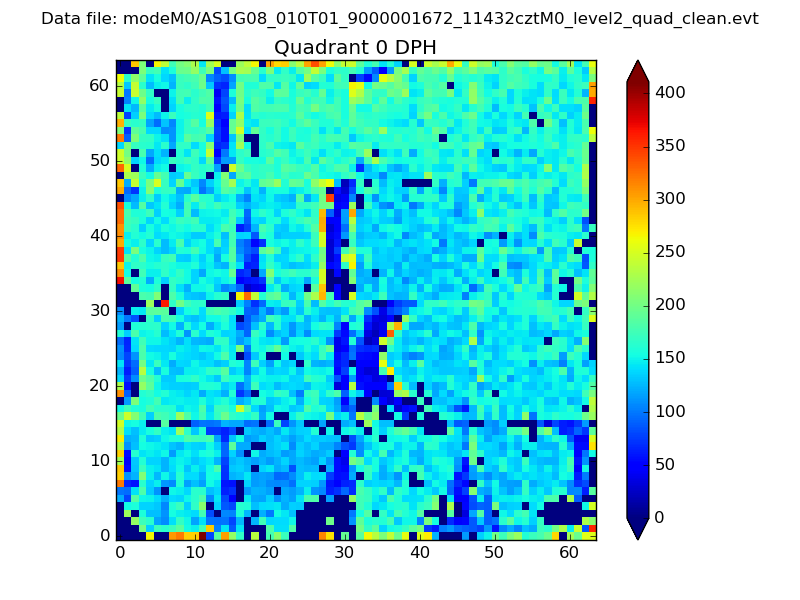 |
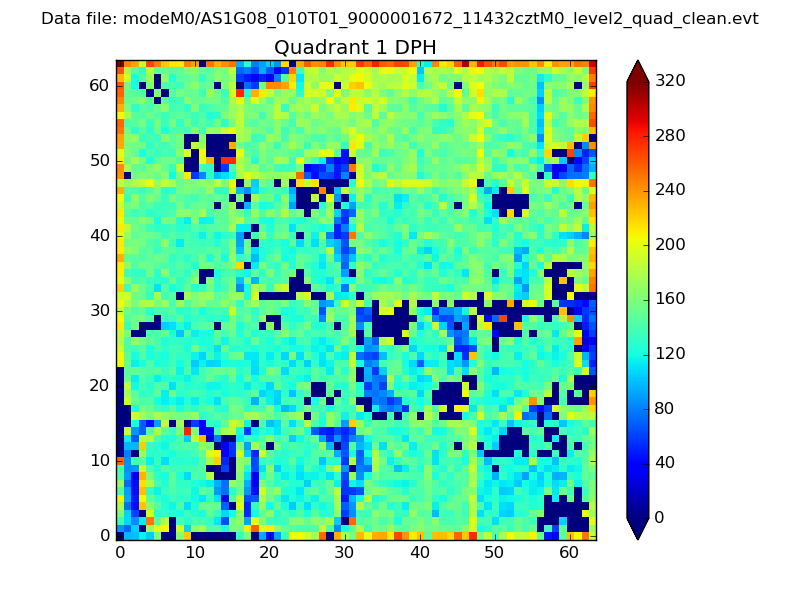 |
Quadrant B |
|---|---|---|---|
| Quadrant D | 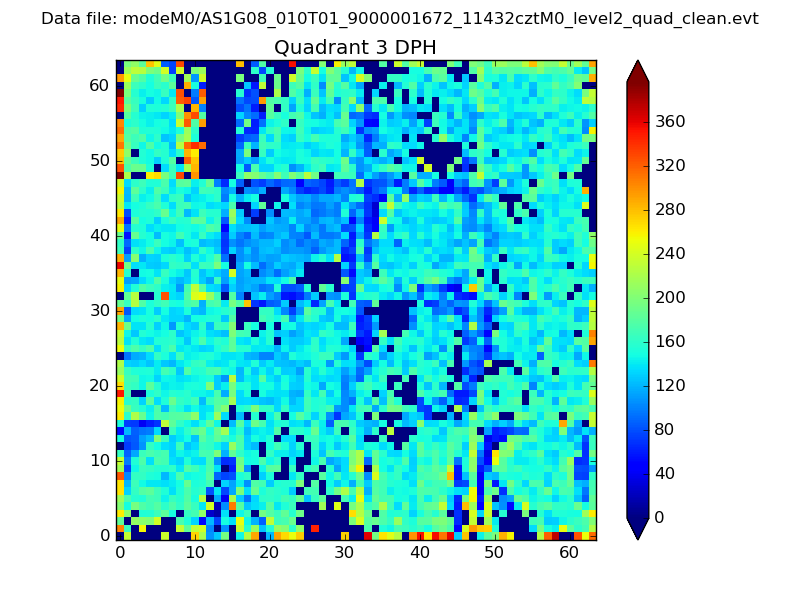 |
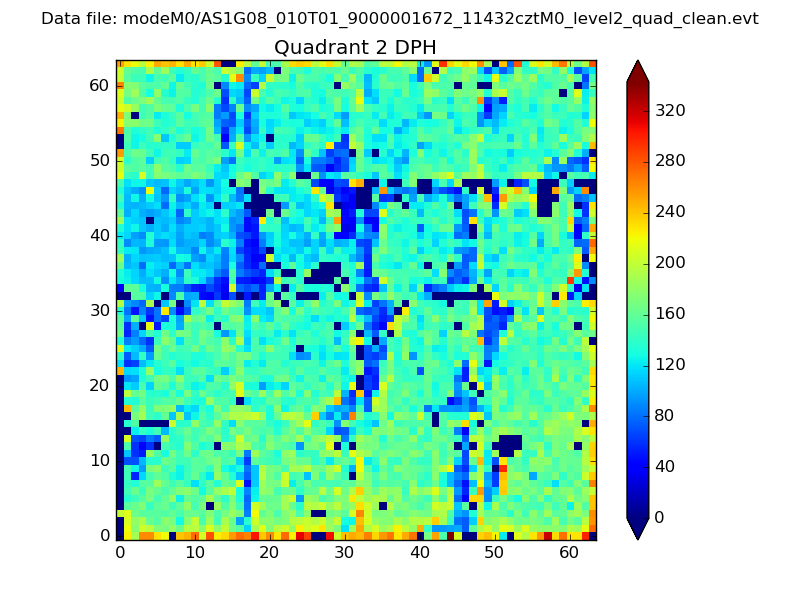 |
Quadrant C |
| Plot type | Count rate plots | Images |
|---|---|---|
| Comparison with Poisson distribution Blue bars denote a histogram of data divided into 1 sec bins. Red curve is a Poisson curve with rate = median count rate of data. |
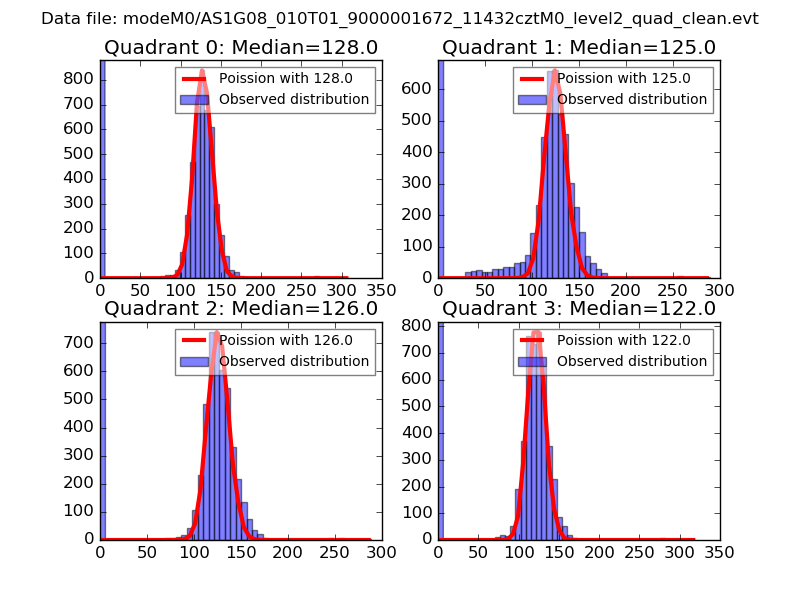 |
 |
| Quadrant-wise count rates Data is divided into 100 sec bins |
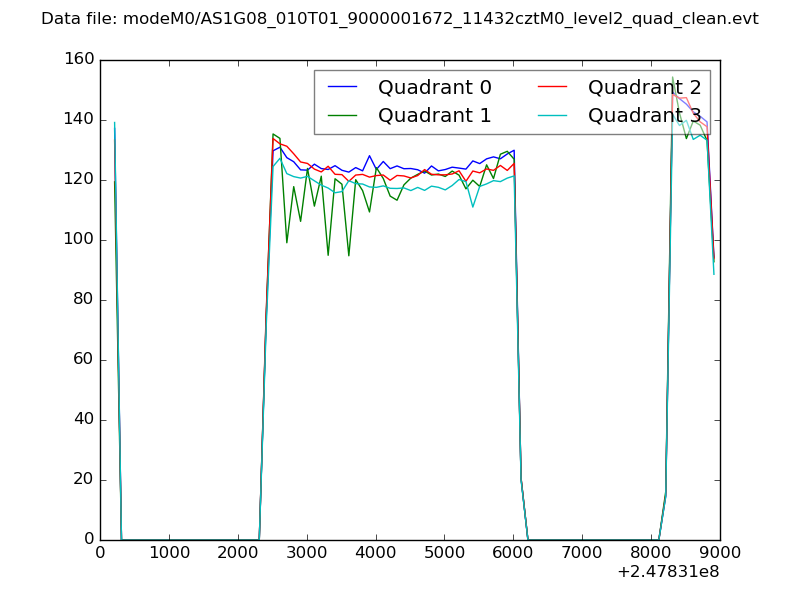 |
|
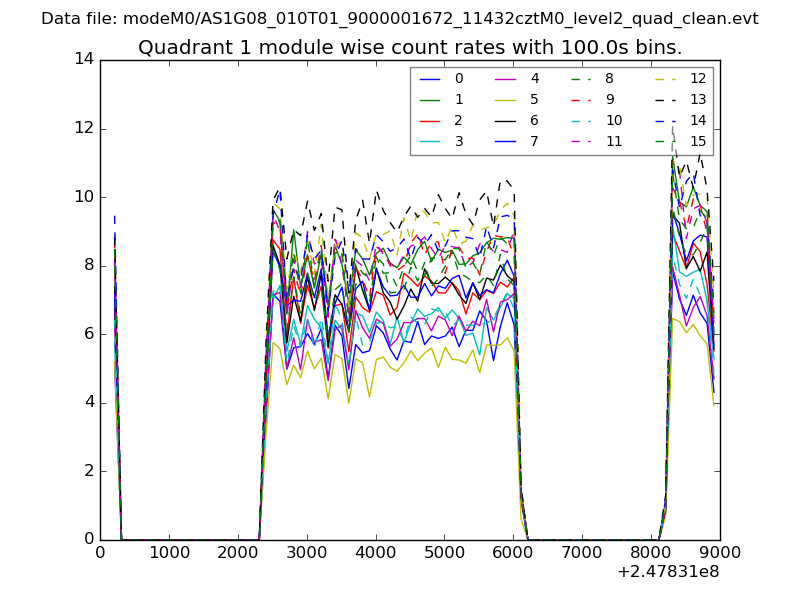
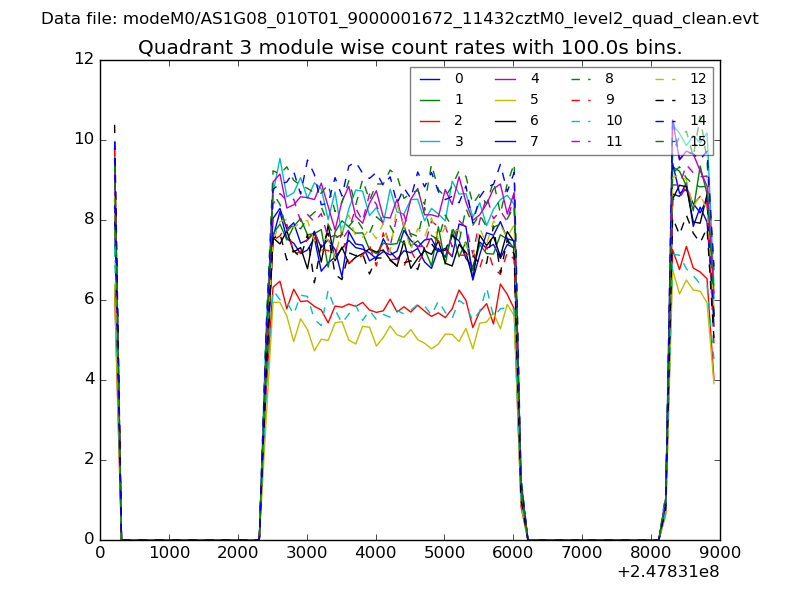
| Module-wise count rates for Quadrant A Data is divided into 100 sec bins |
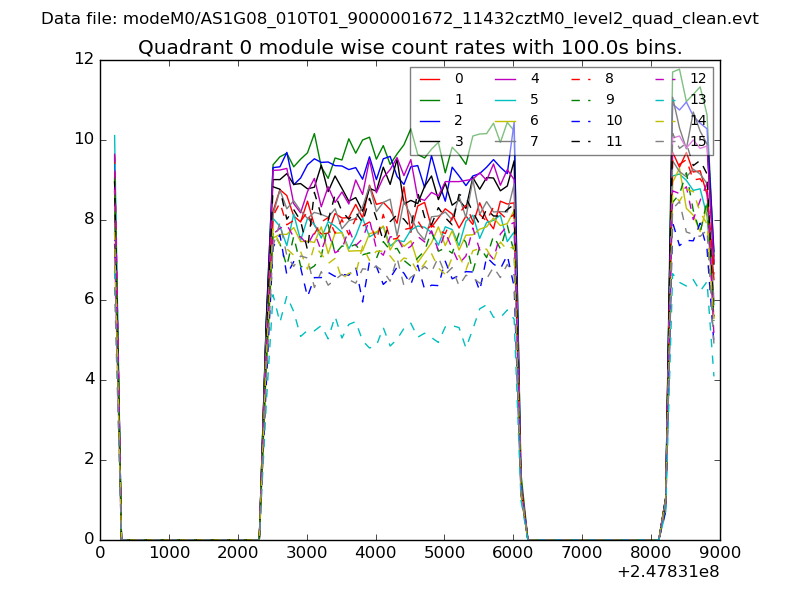 |
 |
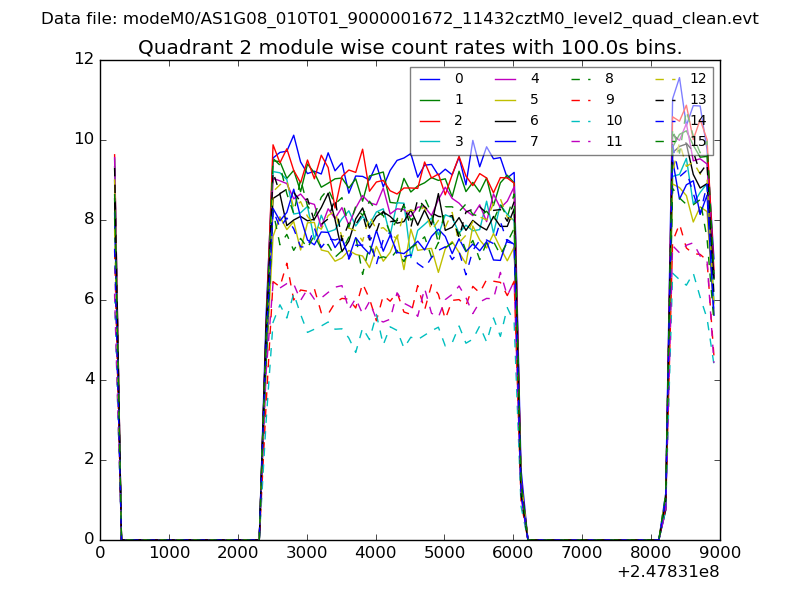
| Module-wise count rates for Quadrant B Data is divided into 100 sec bins |
 |
 |
| Module-wise count rates for Quadrant C Data is divided into 100 sec bins |
 |
 |
| Module-wise count rates for Quadrant D Data is divided into 100 sec bins |
 |
 |
| Parameter | Plot |
|---|---|
| CZT HV Monitor | 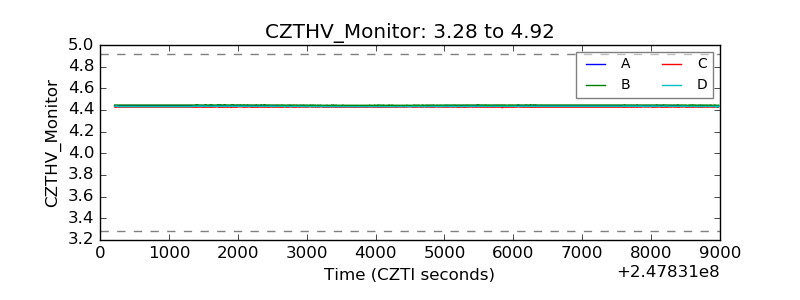 |
| D_VDD | 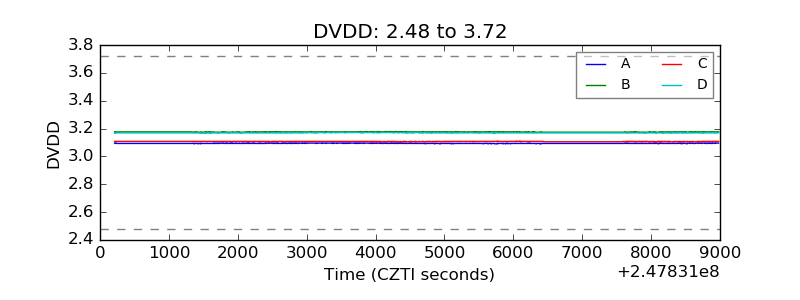 |
| Temperature 1 | 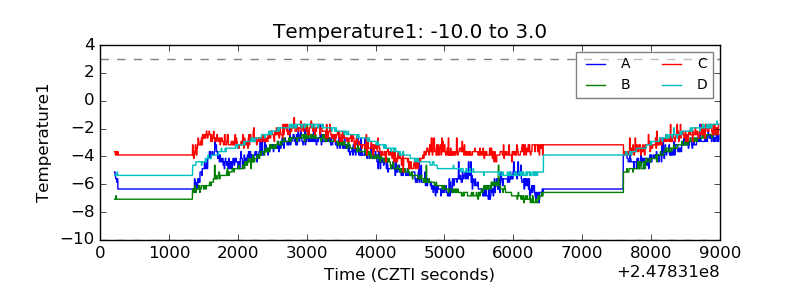 |
| Veto HV Monitor | 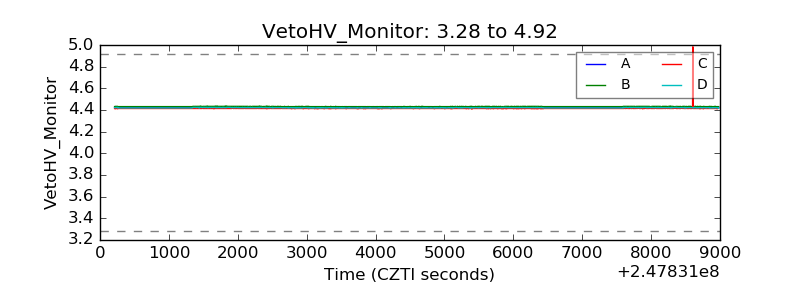 |
| Veto LLD | 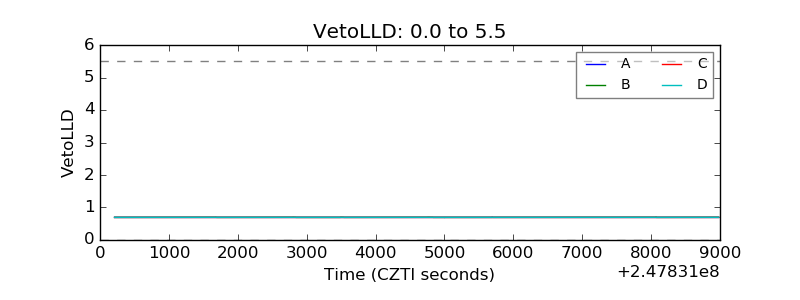 |
| Alpha Counter | 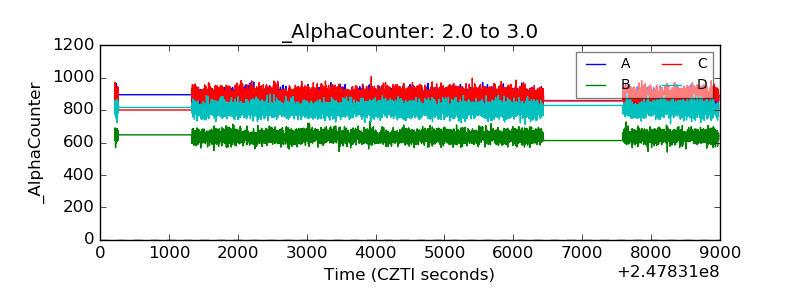 |
| _CPM_Rate | 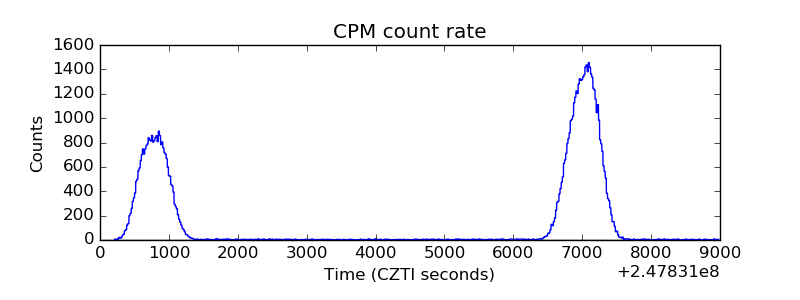 |
| CZT Counter | 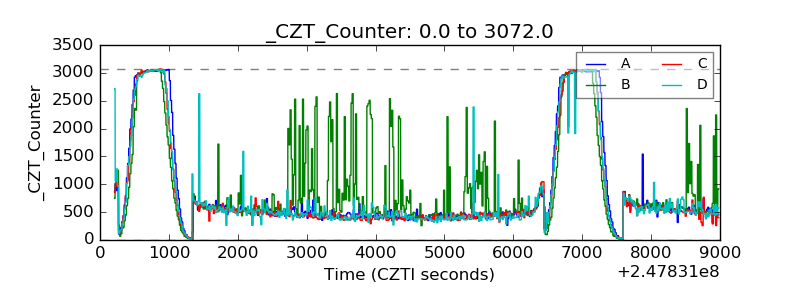 |
| +2.5 Volts monitor | 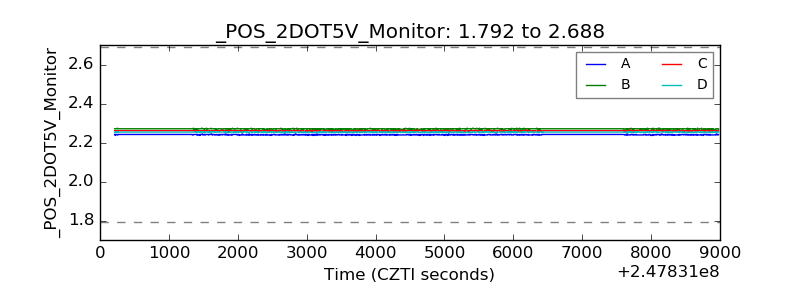 |
| +5 Volts monitor | 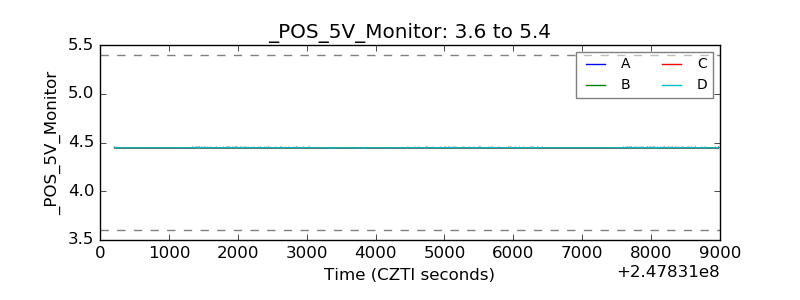 |
| _ROLL_ROT | 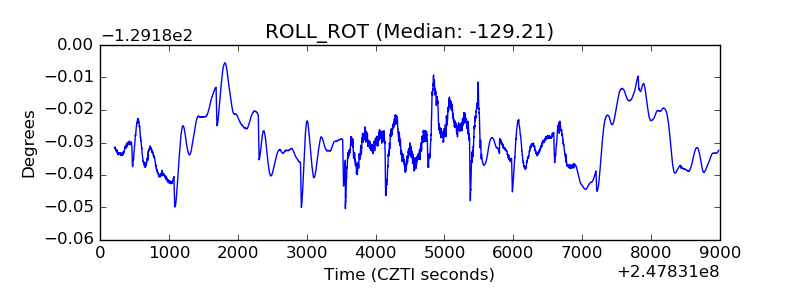 |
| _Roll_DEC | 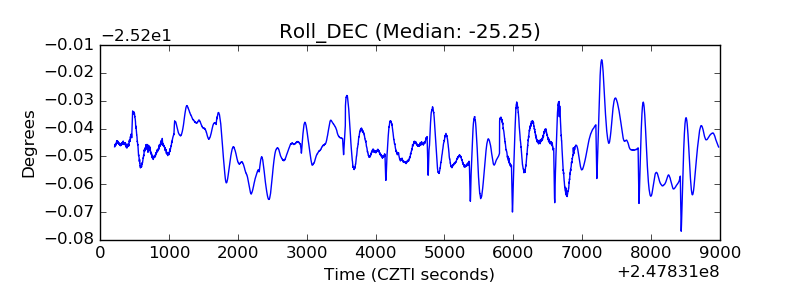 |
| _Roll_RA | 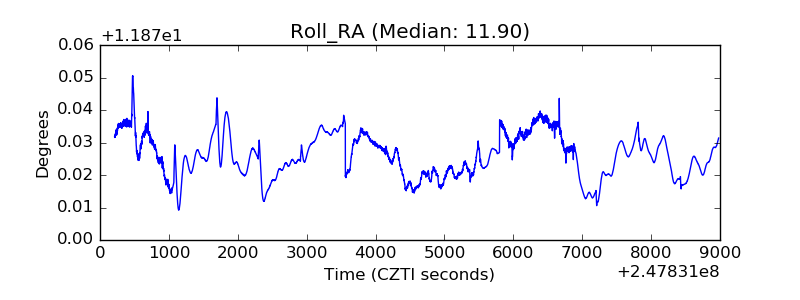 |
| Veto Counter | 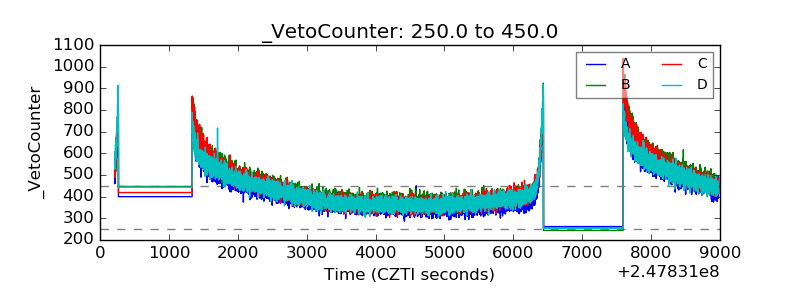 |