| Param | Original file | Final file |
|---|---|---|
| Filename | modeM0/AS1G08_010T01_9000001672_11433cztM0_level2.evt | modeM0/AS1G08_010T01_9000001672_11433cztM0_level2_quad_clean.evt |
| Size (bytes) | 435,628,800 | 94,789,440 |
| Size | 415.4 MB | 90.4 MB |
| Events in quadrant A | 2,912,464 | 636,216 |
| Events in quadrant B | 4,140,761 | 623,196 |
| Events in quadrant C | 2,671,681 | 620,535 |
| Events in quadrant D | 3,083,922 | 595,331 |
| Mode SS | |||
|---|---|---|---|
| Quadrant | BADHDUFLAG | Total packets | Discarded packets |
| A | 0 | 116 | 0 |
| B | 0 | 116 | 0 |
| C | 0 | 116 | 0 |
| D | 0 | 116 | 0 |
| Mode M0 | |||
|---|---|---|---|
| Quadrant | BADHDUFLAG | Total packets | Discarded packets |
| A | 0 | 12260 | 2 |
| B | 0 | 16092 | 1 |
| C | 0 | 11756 | 1 |
| D | 0 | 13067 | 1 |
| Mode M9 | |||
|---|---|---|---|
| Quadrant | BADHDUFLAG | Total packets | Discarded packets |
| A | 0 | 12 | 0 |
| B | 0 | 12 | 0 |
| C | 0 | 12 | 0 |
| D | 0 | 12 | 0 |
| Quadrant | Total seconds | Saturated seconds | Saturation percentage |
|---|---|---|---|
| A | 5650 | 70 | 1.238938% |
| B | 5650 | 401 | 7.097345% |
| C | 5650 | 47 | 0.831858% |
| D | 5650 | 92 | 1.628319% |
Noise dominated data is calculated using 1-second bins in cleaned event files. If a bin has >2000 counts, and if more than 50% of those come from <1% of pixels, then it is considered to be noise-dominated and hence unusable.
| Quadrant | # 1 sec bins | Bins with >0 counts | Bins with >2000 counts | High rate bins dominated by noise | Noise dominated (total time) | Noise dominated (detector-on time) | Marked lightcurve |
|---|---|---|---|---|---|---|---|
| A | 6910 | 5650 | 3 | 3 | 0.04% | 0.05% | 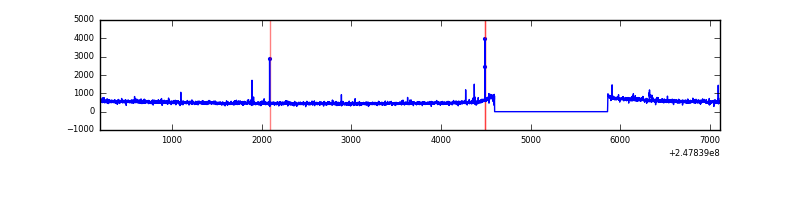 |
| B | 6910 | 5651 | 205 | 205 | 2.97% | 3.63% | 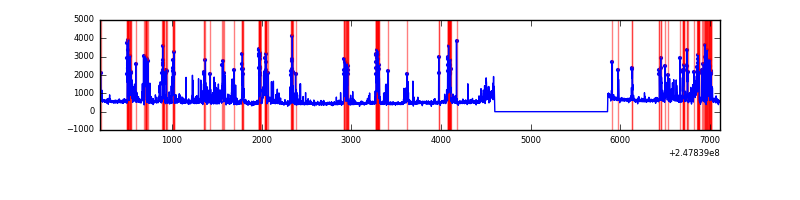 |
| C | 6910 | 5651 | 0 | 0 | 0.00% | 0.00% |  |
| D | 6910 | 5651 | 28 | 28 | 0.41% | 0.50% | 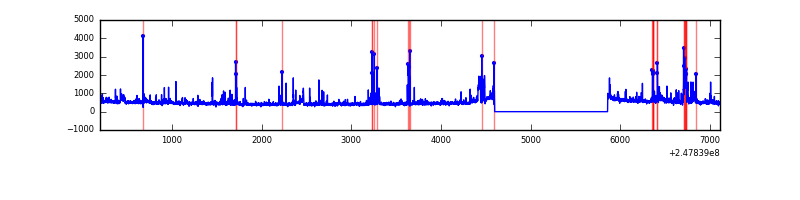 |
Top three noisy pixels from each quadrant. If the there are fewer than three noisy pixels in the level2.evt file, extra rows are filled as -1
| Pixel properties | Quadrant properties | ||||||
|---|---|---|---|---|---|---|---|
| Quadrant | DetID | PixID | Counts | Sigma | Mean | Median | Sigma |
| A | 15 | 174 | 28734 | 189.77 | 723 | 710 | 147.7 |
| A | 1 | 162 | 24993 | 164.44 | 723 | 710 | 147.7 |
| A | 8 | 5 | 22728 | 149.1 | 723 | 710 | 147.7 |
| B | 4 | 239 | 1199435 | 9000.26 | 704 | 690 | 133.2 |
| B | 15 | 204 | 67275 | 499.92 | 704 | 690 | 133.2 |
| B | 3 | 189 | 45402 | 335.7 | 704 | 690 | 133.2 |
| C | 13 | 61 | 4896 | 26.6 | 685 | 689 | 158.2 |
| C | 12 | 4 | 1679 | 6.26 | 685 | 689 | 158.2 |
| C | 3 | 202 | 1660 | 6.14 | 685 | 689 | 158.2 |
| D | 1 | 52 | 194559 | 1184.64 | 686 | 668 | 163.7 |
| D | 2 | 14 | 77284 | 468.11 | 686 | 668 | 163.7 |
| D | 2 | 120 | 72939 | 441.56 | 686 | 668 | 163.7 |
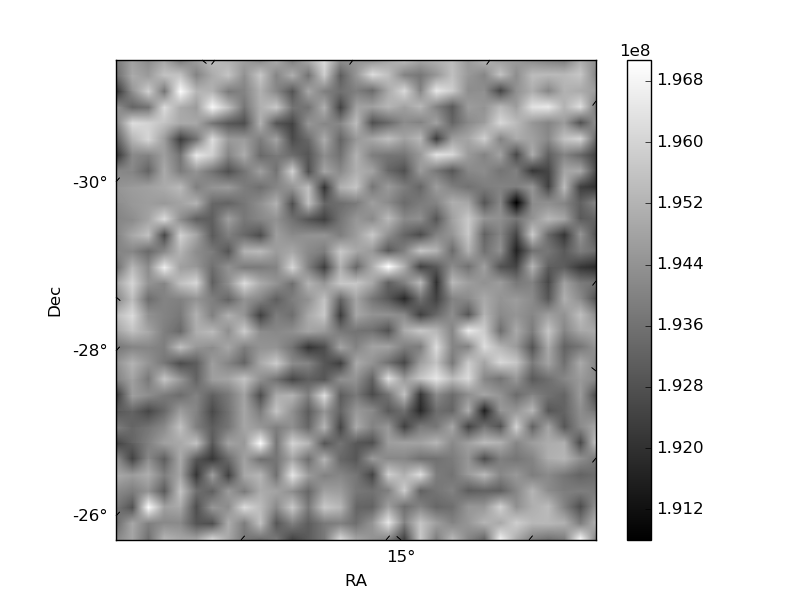
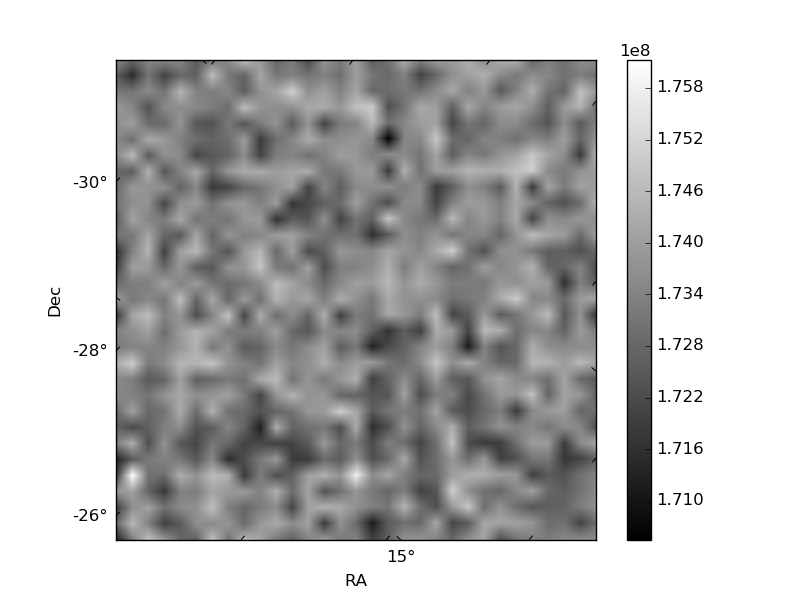
Histogram calculated using DETX and DETY for each event in the final _common_clean file
| Quadrant A | 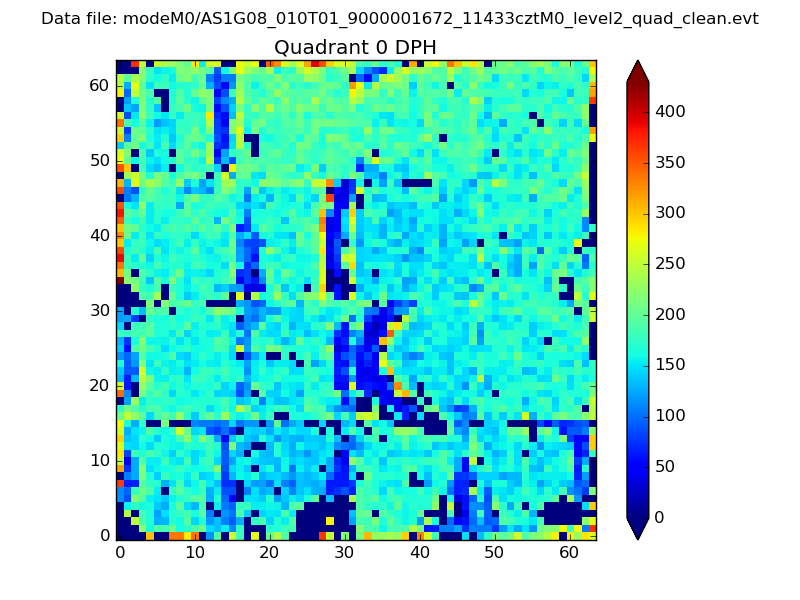 |
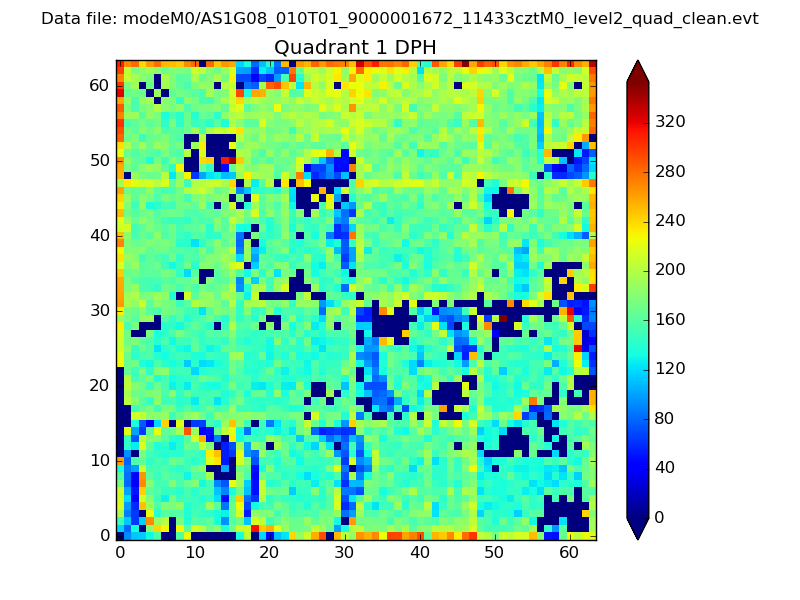 |
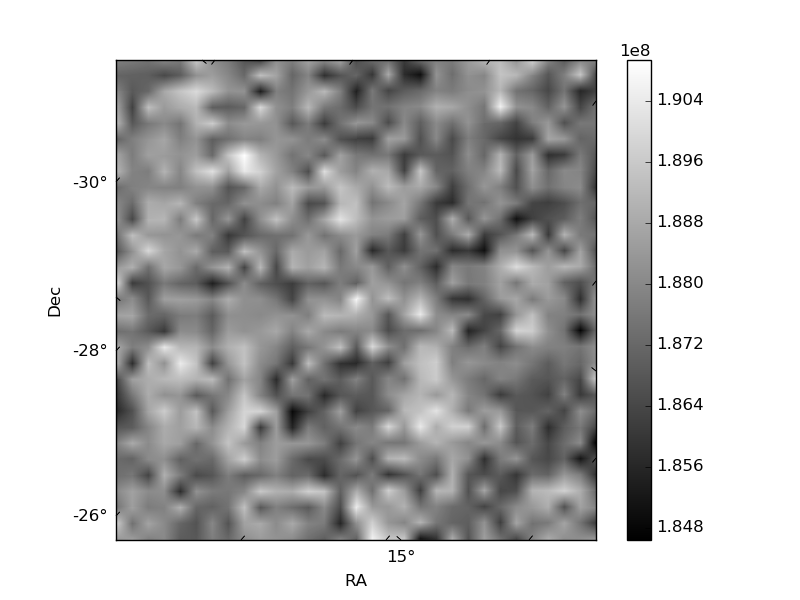
Quadrant B |
|---|---|---|---|
| Quadrant D |  |
 |
Quadrant C |
| Plot type | Count rate plots | Images |
|---|---|---|
| Comparison with Poisson distribution Blue bars denote a histogram of data divided into 1 sec bins. Red curve is a Poisson curve with rate = median count rate of data. |
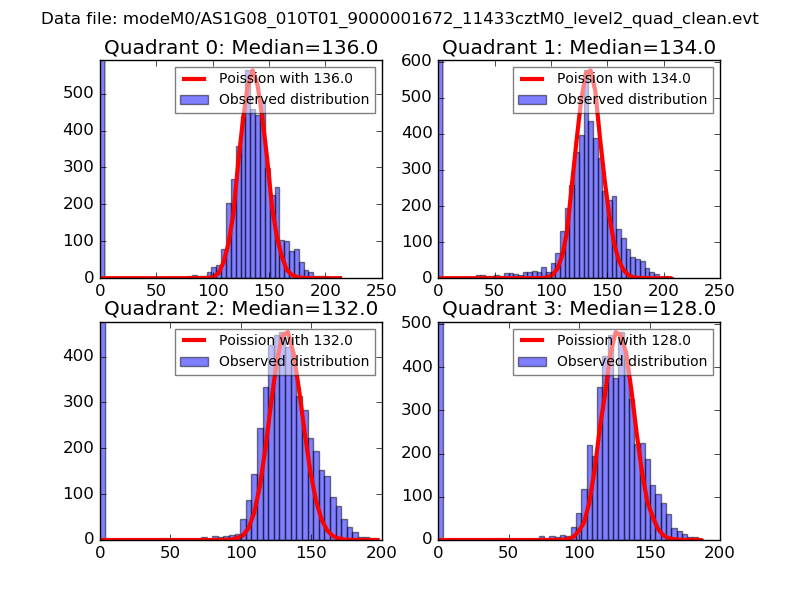 |
 |
| Quadrant-wise count rates Data is divided into 100 sec bins |
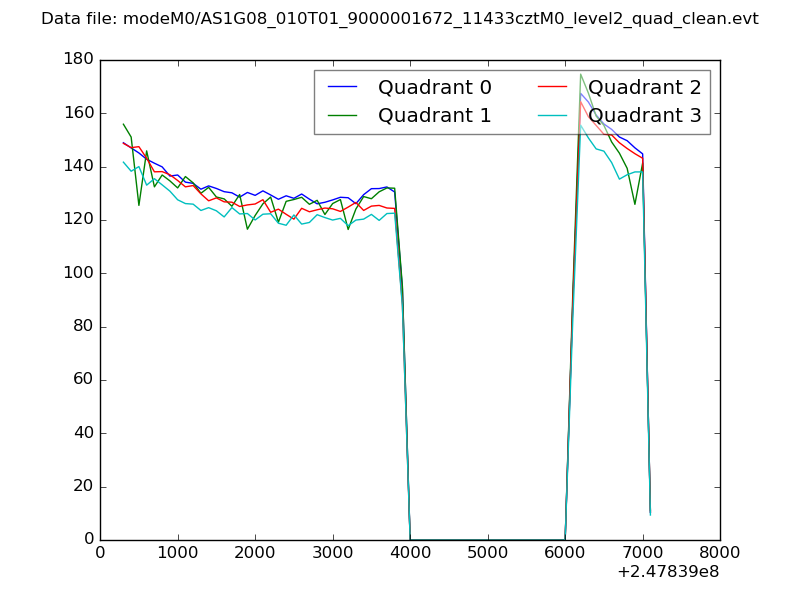 |
|
| Module-wise count rates for Quadrant A Data is divided into 100 sec bins |
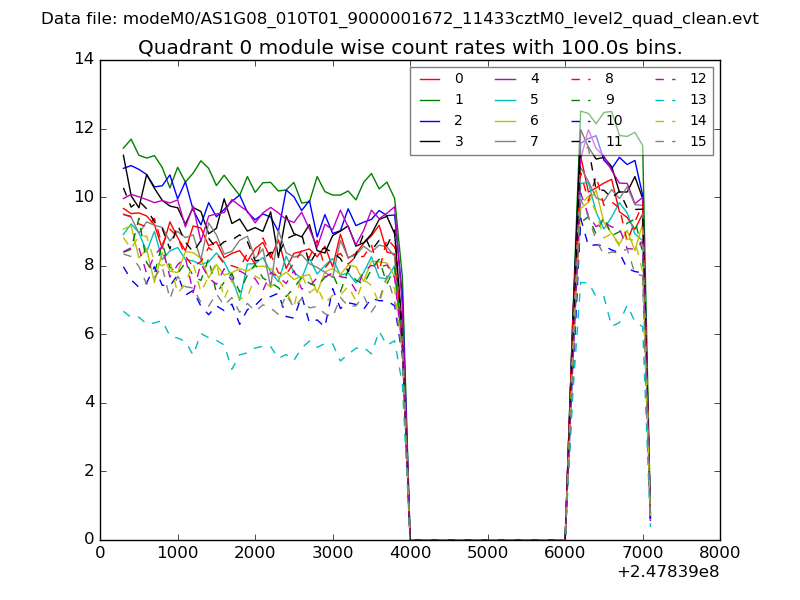 |
 |
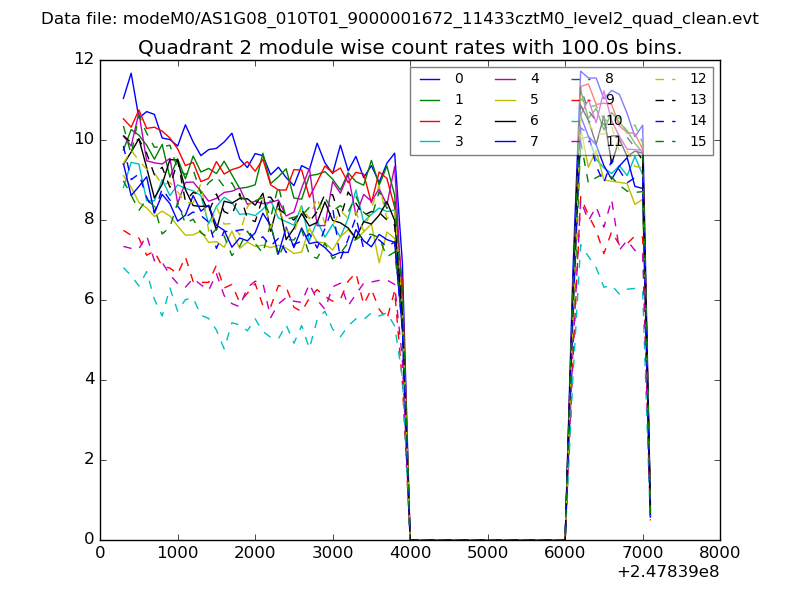
| Module-wise count rates for Quadrant B Data is divided into 100 sec bins |
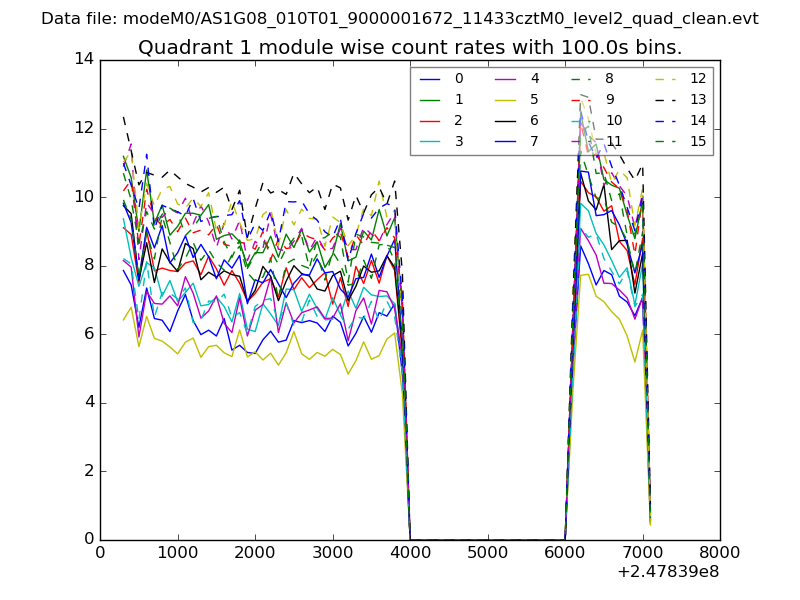 |
 |
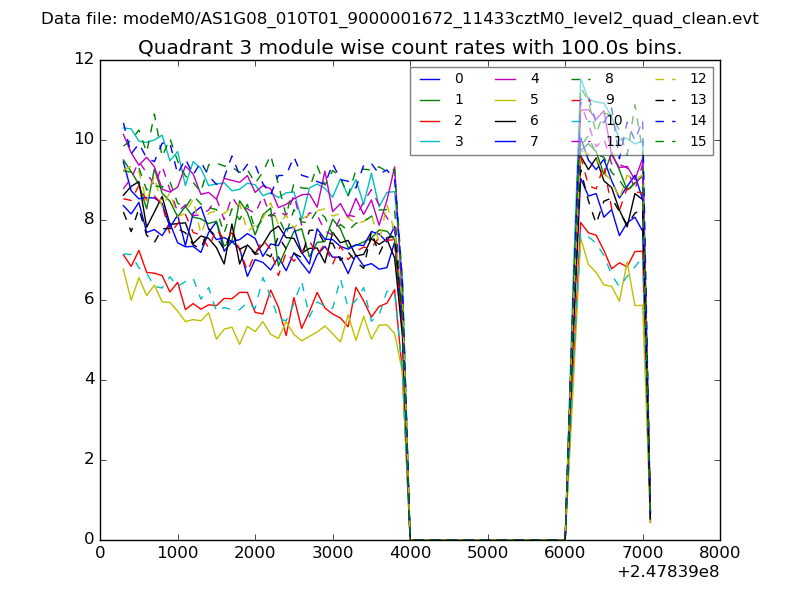
| Module-wise count rates for Quadrant C Data is divided into 100 sec bins |
 |
 |
| Module-wise count rates for Quadrant D Data is divided into 100 sec bins |
 |
 |
| Parameter | Plot |
|---|---|
| CZT HV Monitor | 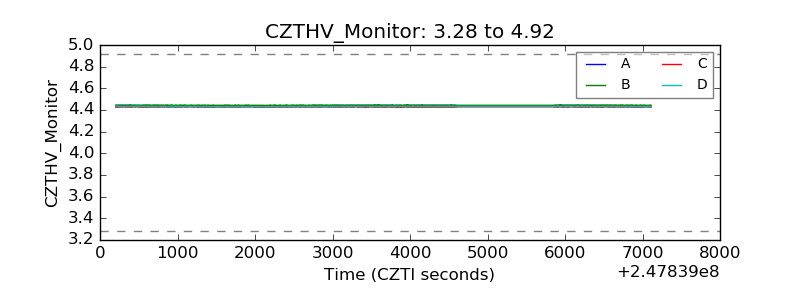 |
| D_VDD | 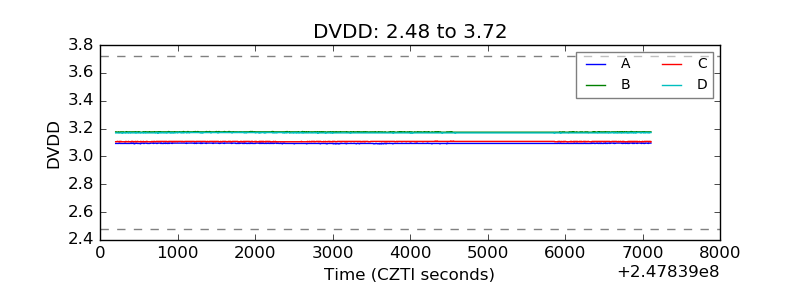 |
| Temperature 1 | 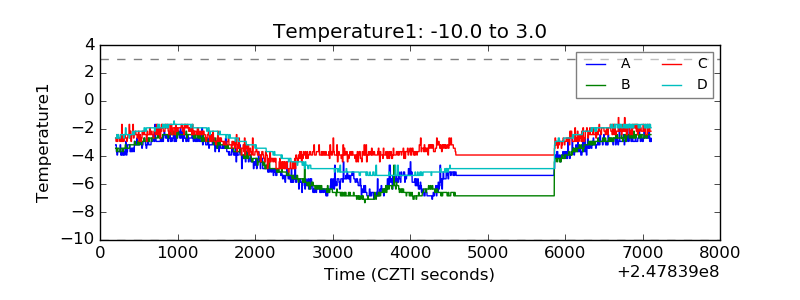 |
| Veto HV Monitor | 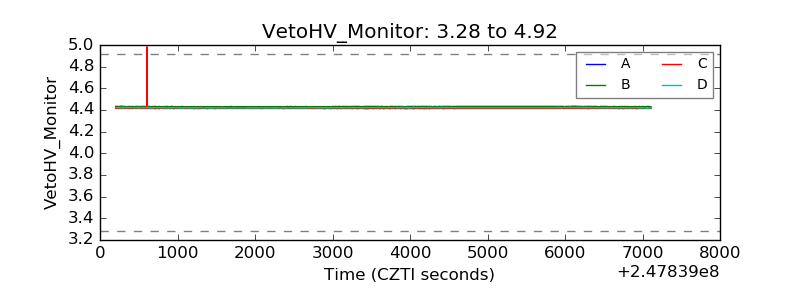 |
| Veto LLD | 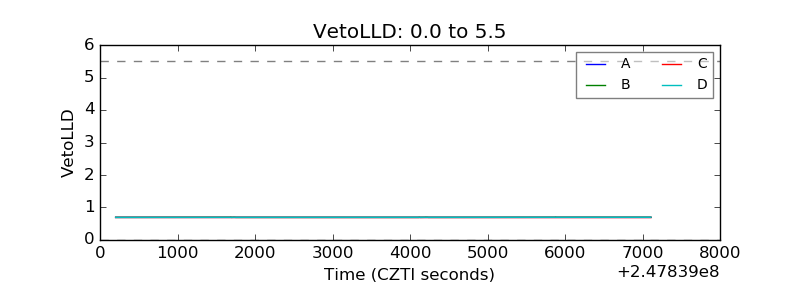 |
| Alpha Counter |  |
| _CPM_Rate | 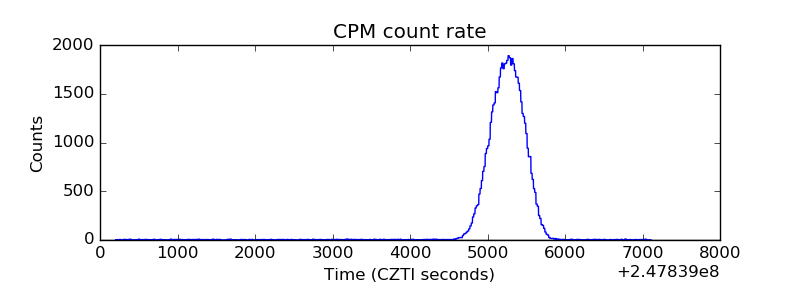 |
| CZT Counter | 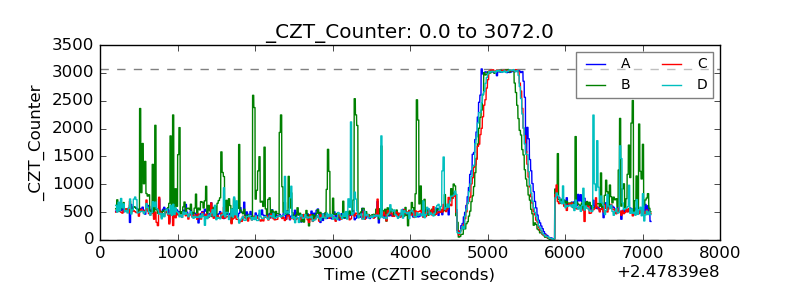 |
| +2.5 Volts monitor | 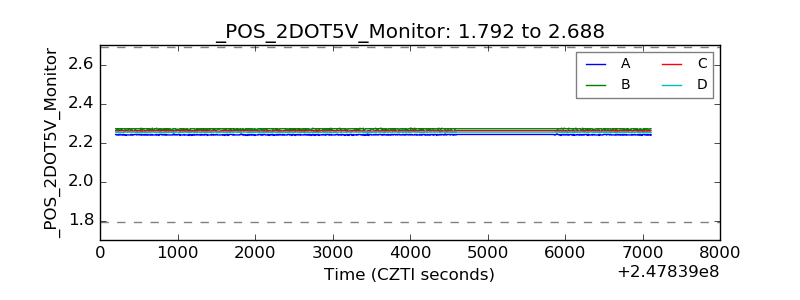 |
| +5 Volts monitor |  |
| _ROLL_ROT | 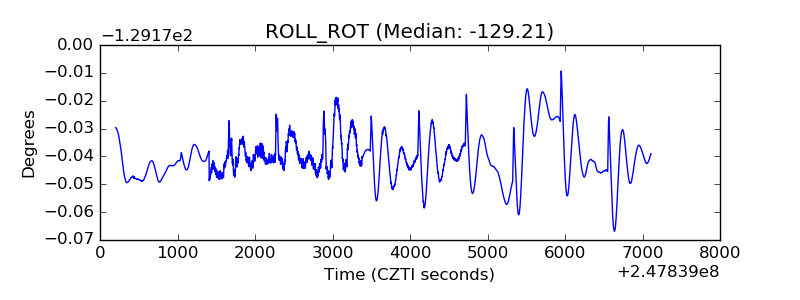 |
| _Roll_DEC | 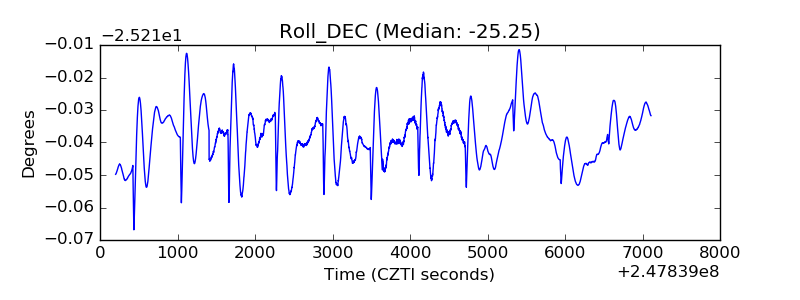 |
| _Roll_RA | 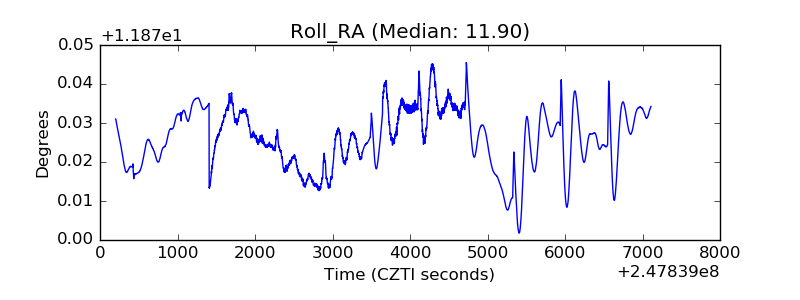 |
| Veto Counter | 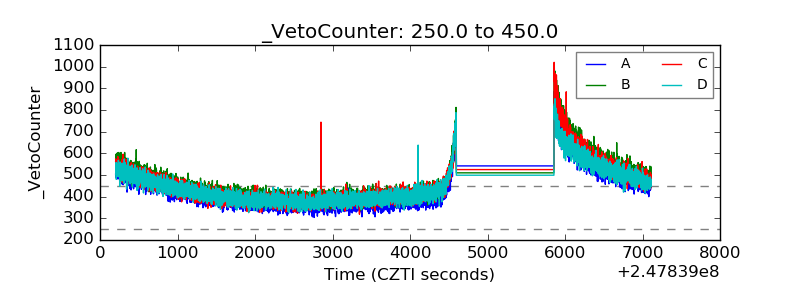 |