| Param | Original file | Final file |
|---|---|---|
| Filename | modeM0/AS1G08_010T01_9000001672_11434cztM0_level2.evt | modeM0/AS1G08_010T01_9000001672_11434cztM0_level2_quad_clean.evt |
| Size (bytes) | 483,563,520 | 112,213,440 |
| Size | 461.2 MB | 107.0 MB |
| Events in quadrant A | 3,421,274 | 758,358 |
| Events in quadrant B | 4,429,227 | 755,765 |
| Events in quadrant C | 2,980,308 | 735,903 |
| Events in quadrant D | 3,383,689 | 706,369 |
| Mode SS | |||
|---|---|---|---|
| Quadrant | BADHDUFLAG | Total packets | Discarded packets |
| A | 0 | 130 | 0 |
| B | 0 | 130 | 0 |
| C | 0 | 130 | 0 |
| D | 0 | 130 | 0 |
| Mode M0 | |||
|---|---|---|---|
| Quadrant | BADHDUFLAG | Total packets | Discarded packets |
| A | 0 | 14192 | 2 |
| B | 0 | 17460 | 1 |
| C | 0 | 13056 | 1 |
| D | 0 | 14369 | 1 |
| Mode M9 | |||
|---|---|---|---|
| Quadrant | BADHDUFLAG | Total packets | Discarded packets |
| A | 0 | 13 | 0 |
| B | 0 | 13 | 0 |
| C | 0 | 13 | 0 |
| D | 0 | 13 | 0 |
| Quadrant | Total seconds | Saturated seconds | Saturation percentage |
|---|---|---|---|
| A | 6332 | 98 | 1.547694% |
| B | 6332 | 323 | 5.101074% |
| C | 6332 | 54 | 0.852811% |
| D | 6332 | 104 | 1.642451% |
Noise dominated data is calculated using 1-second bins in cleaned event files. If a bin has >2000 counts, and if more than 50% of those come from <1% of pixels, then it is considered to be noise-dominated and hence unusable.
| Quadrant | # 1 sec bins | Bins with >0 counts | Bins with >2000 counts | High rate bins dominated by noise | Noise dominated (total time) | Noise dominated (detector-on time) | Marked lightcurve |
|---|---|---|---|---|---|---|---|
| A | 7637 | 6333 | 6 | 6 | 0.08% | 0.09% | 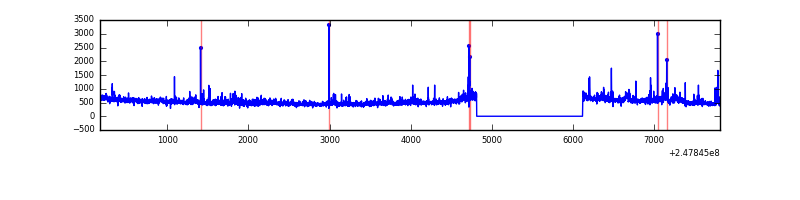 |
| B | 7637 | 6333 | 148 | 148 | 1.94% | 2.34% | 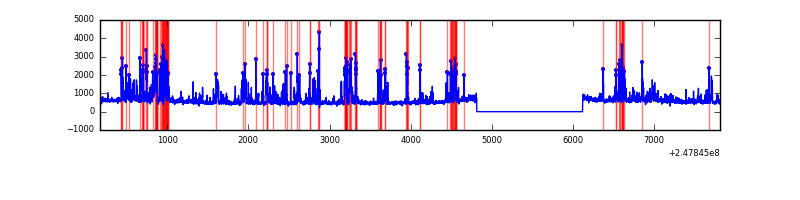 |
| C | 7637 | 6333 | 0 | 0 | 0.00% | 0.00% | 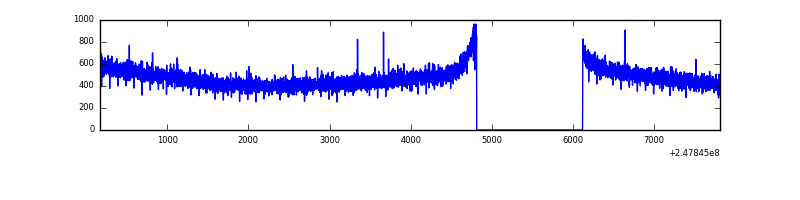 |
| D | 7637 | 6333 | 35 | 35 | 0.46% | 0.55% | 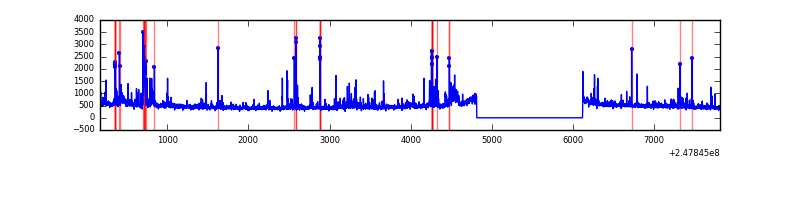 |
Top three noisy pixels from each quadrant. If the there are fewer than three noisy pixels in the level2.evt file, extra rows are filled as -1
| Pixel properties | Quadrant properties | ||||||
|---|---|---|---|---|---|---|---|
| Quadrant | DetID | PixID | Counts | Sigma | Mean | Median | Sigma |
| A | 15 | 174 | 77774 | 475.08 | 809 | 797 | 162.0 |
| A | 8 | 5 | 70529 | 430.37 | 809 | 797 | 162.0 |
| A | 8 | 15 | 51600 | 313.54 | 809 | 797 | 162.0 |
| B | 4 | 239 | 1015629 | 6732.17 | 798 | 782 | 150.7 |
| B | 11 | 51 | 89082 | 585.75 | 798 | 782 | 150.7 |
| B | 15 | 204 | 82496 | 542.06 | 798 | 782 | 150.7 |
| C | 13 | 61 | 5568 | 27.28 | 764 | 770 | 175.9 |
| C | 3 | 202 | 1852 | 6.15 | 764 | 770 | 175.9 |
| C | 3 | 203 | 1658 | 5.05 | 764 | 770 | 175.9 |
| D | 1 | 52 | 287672 | 1561.11 | 767 | 747 | 183.8 |
| D | 9 | 85 | 48234 | 258.37 | 767 | 747 | 183.8 |
| D | 2 | 120 | 33644 | 178.99 | 767 | 747 | 183.8 |
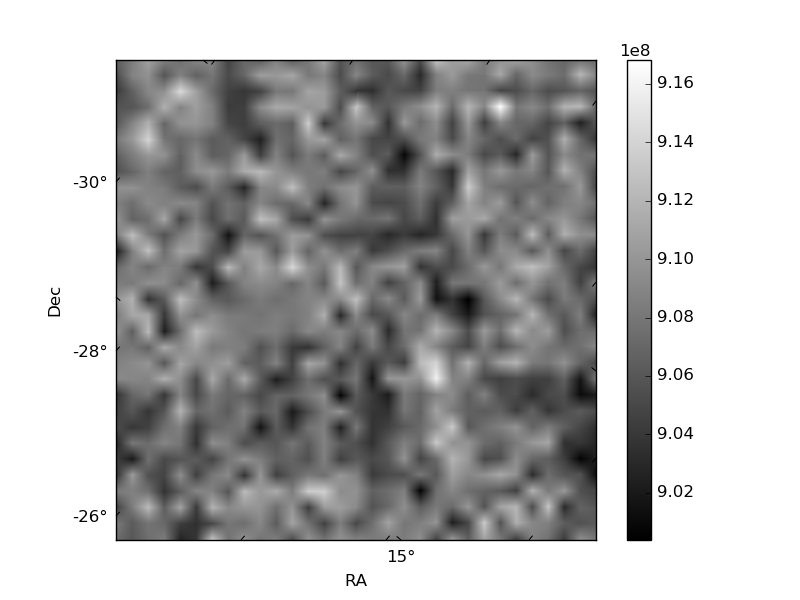
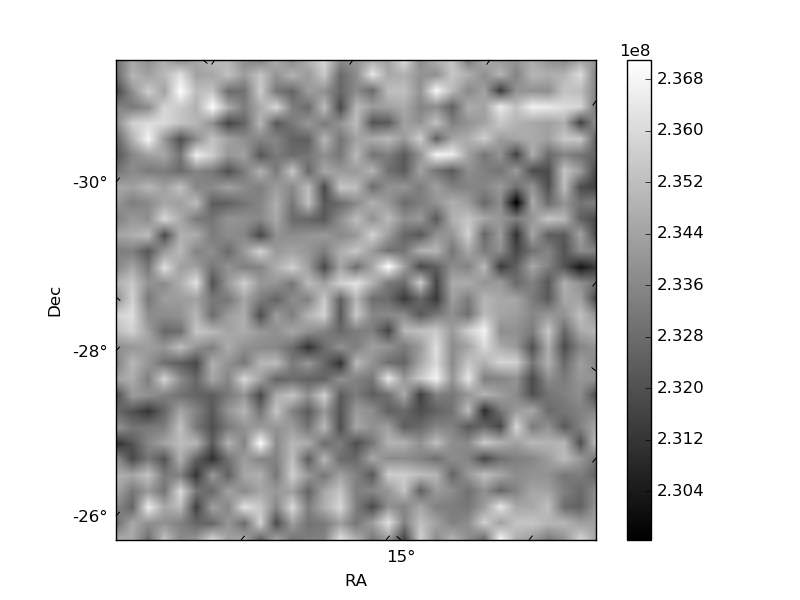
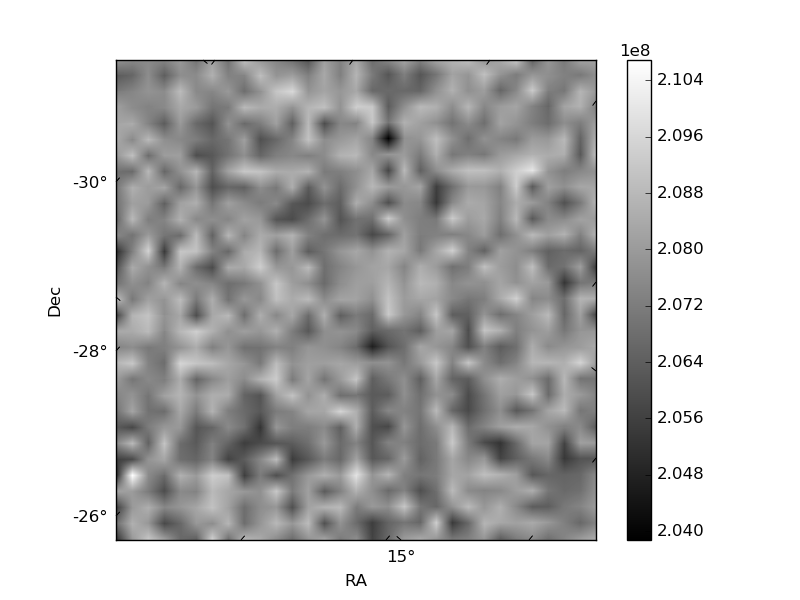
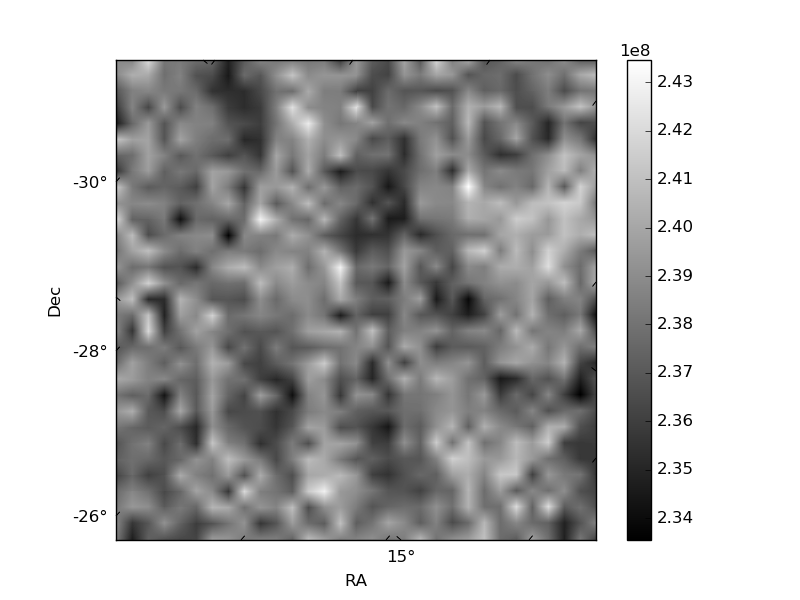
Histogram calculated using DETX and DETY for each event in the final _common_clean file
| Quadrant A | 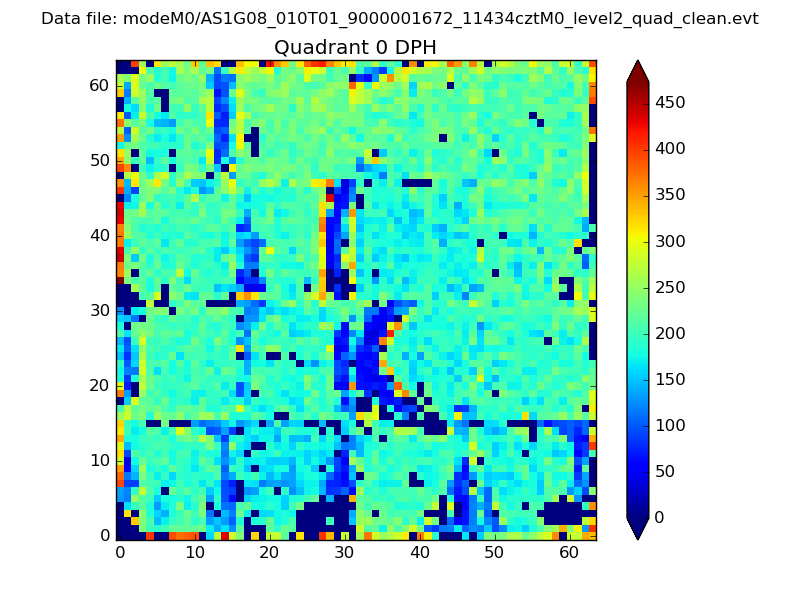 |
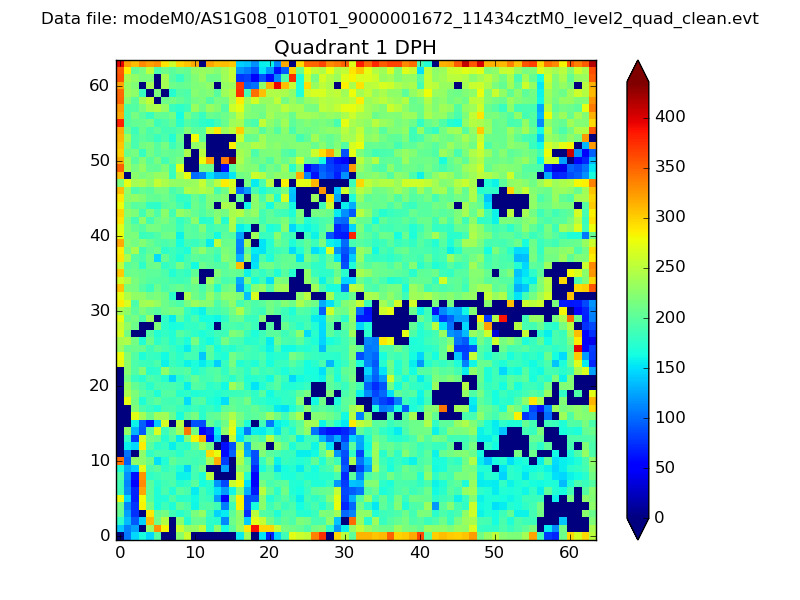 |
Quadrant B |
|---|---|---|---|
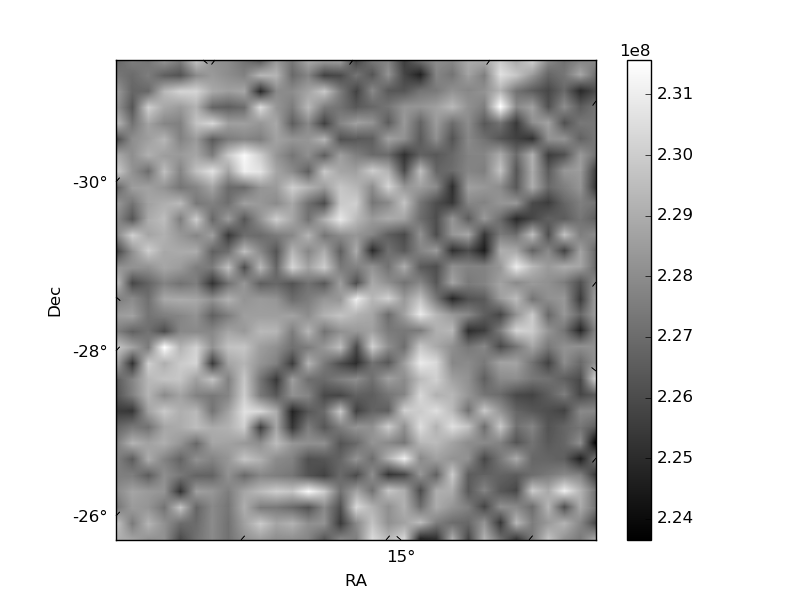
| Quadrant D | 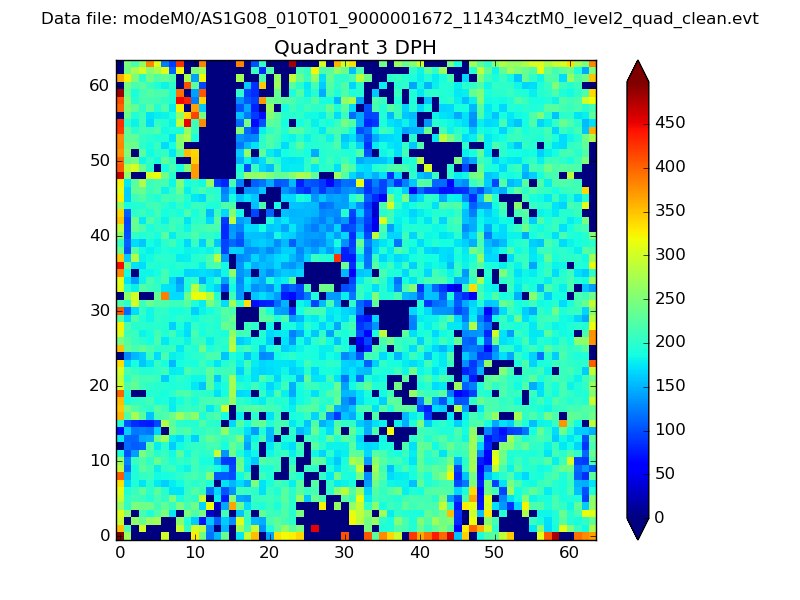 |
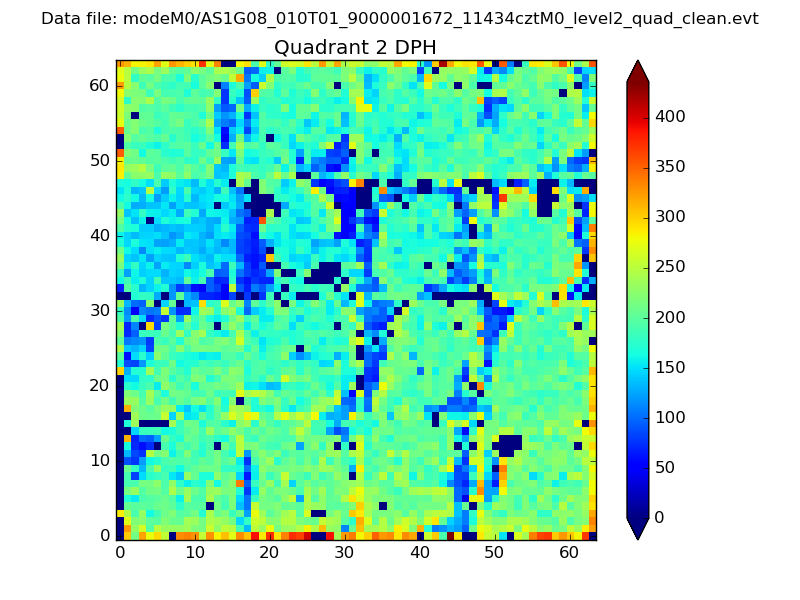 |
Quadrant C |
| Plot type | Count rate plots | Images |
|---|---|---|
| Comparison with Poisson distribution Blue bars denote a histogram of data divided into 1 sec bins. Red curve is a Poisson curve with rate = median count rate of data. |
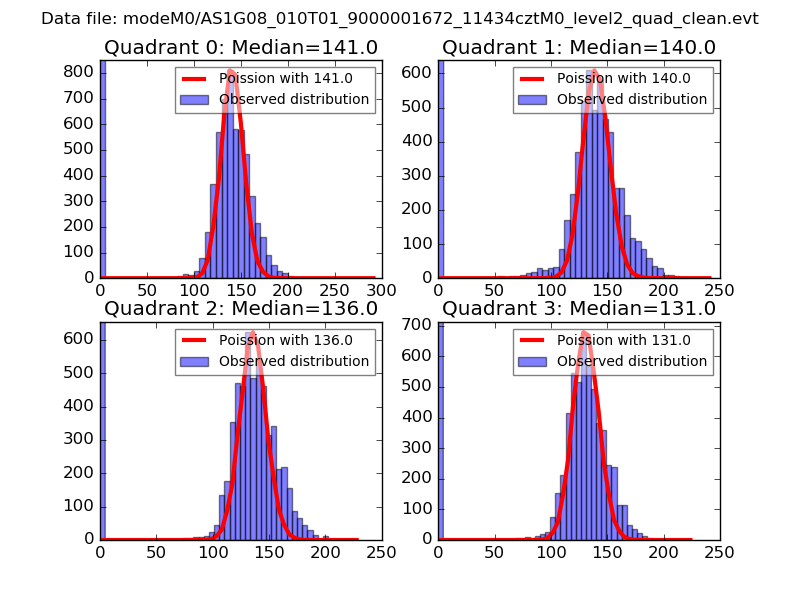 |
 |
| Quadrant-wise count rates Data is divided into 100 sec bins |
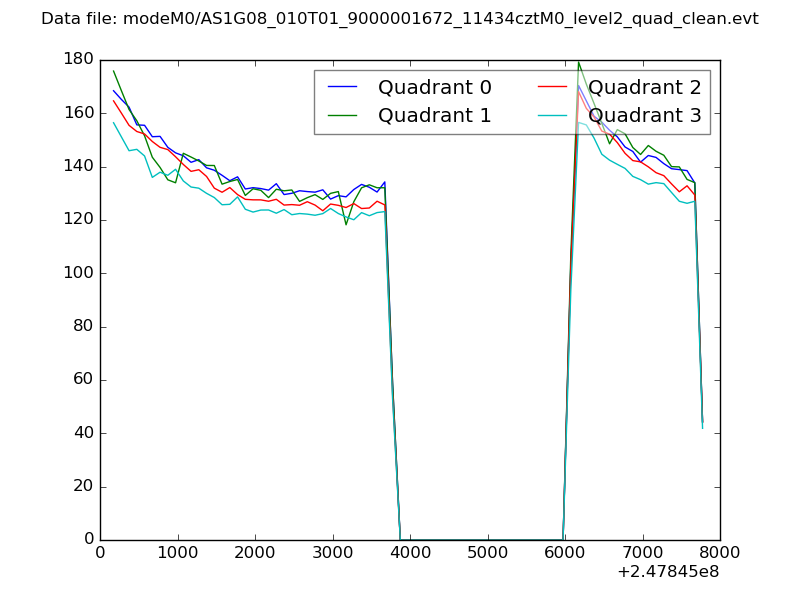 |
|
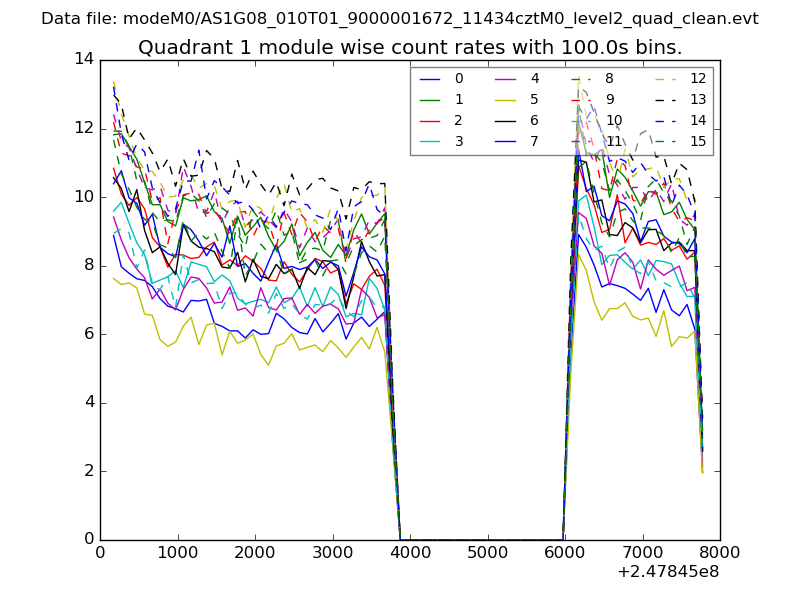
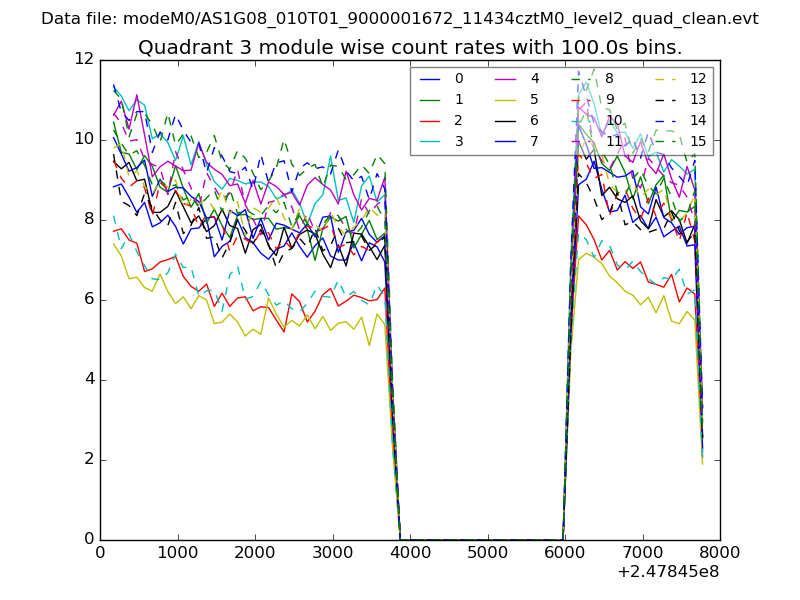
| Module-wise count rates for Quadrant A Data is divided into 100 sec bins |
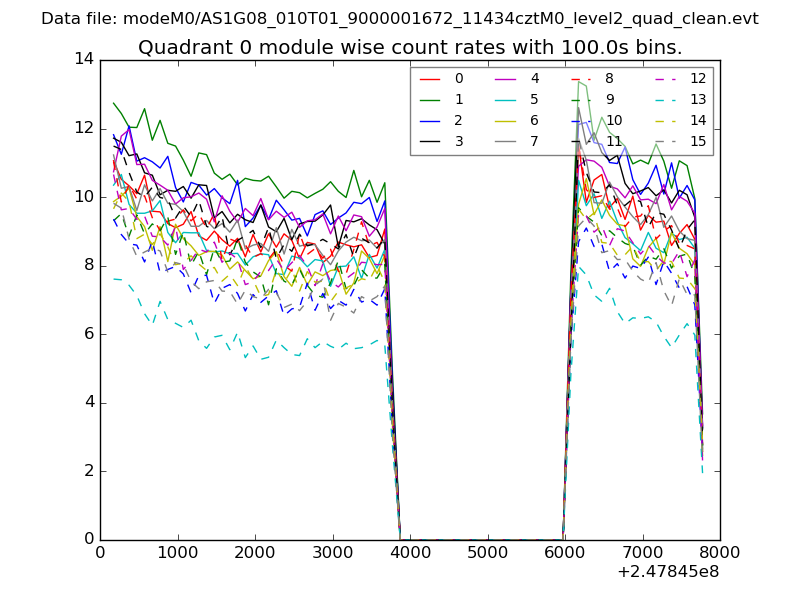 |
 |
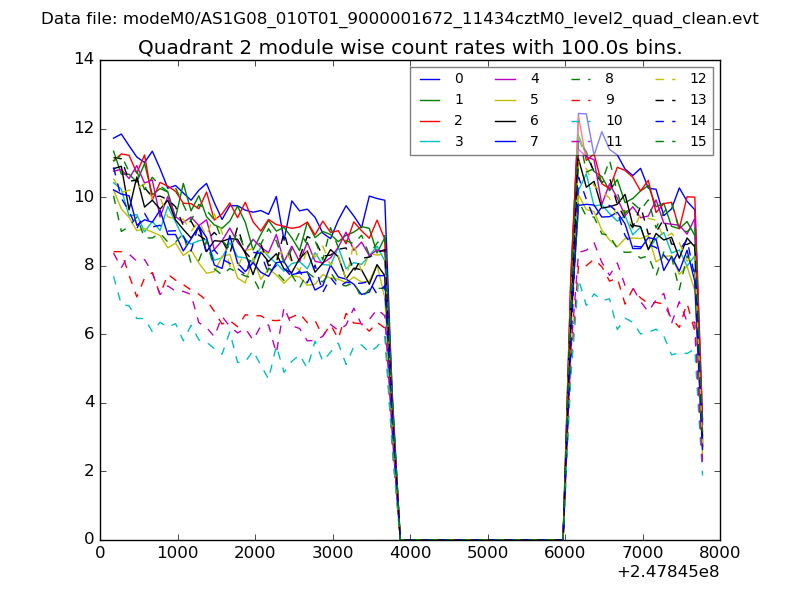
| Module-wise count rates for Quadrant B Data is divided into 100 sec bins |
 |
 |
| Module-wise count rates for Quadrant C Data is divided into 100 sec bins |
 |
 |
| Module-wise count rates for Quadrant D Data is divided into 100 sec bins |
 |
 |
| Parameter | Plot |
|---|---|
| CZT HV Monitor | 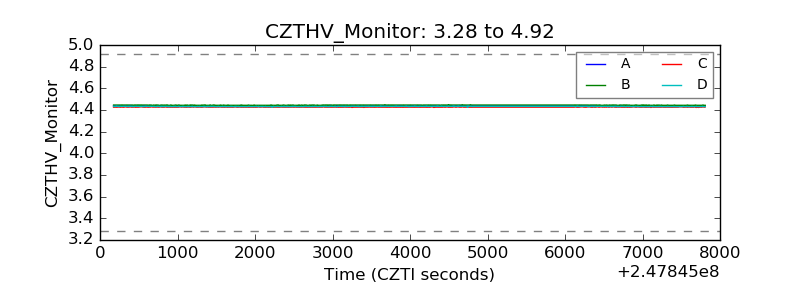 |
| D_VDD | 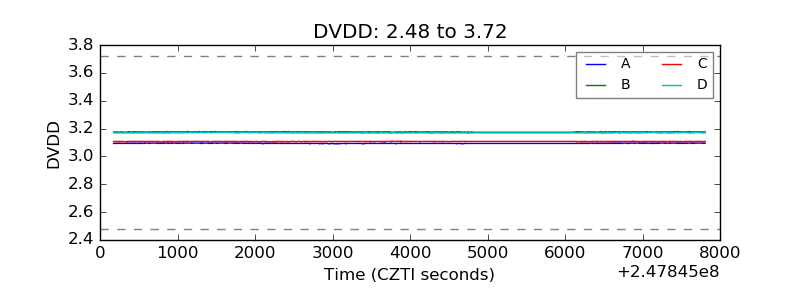 |
| Temperature 1 | 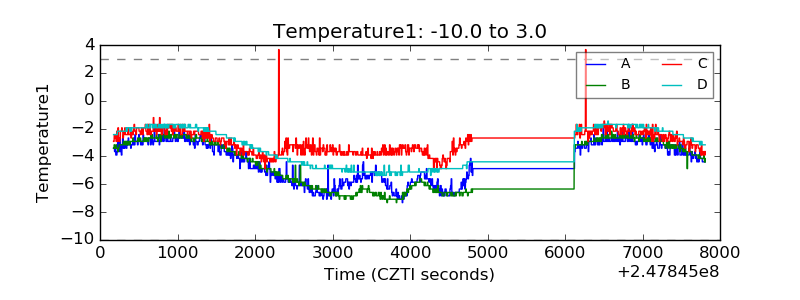 |
| Veto HV Monitor | 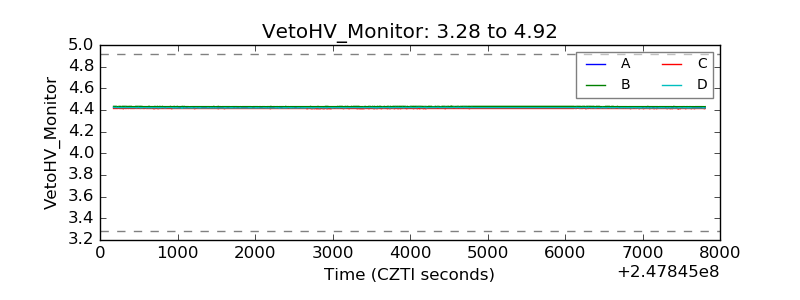 |
| Veto LLD | 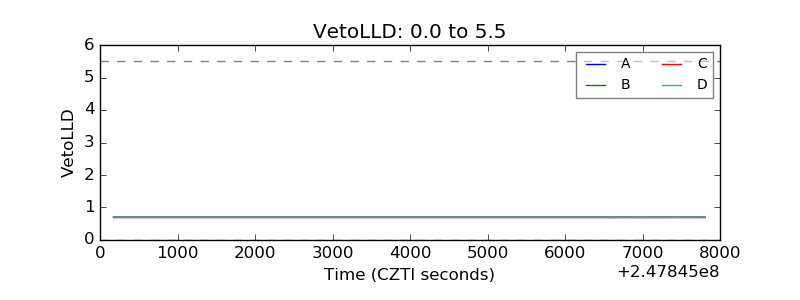 |
| Alpha Counter | 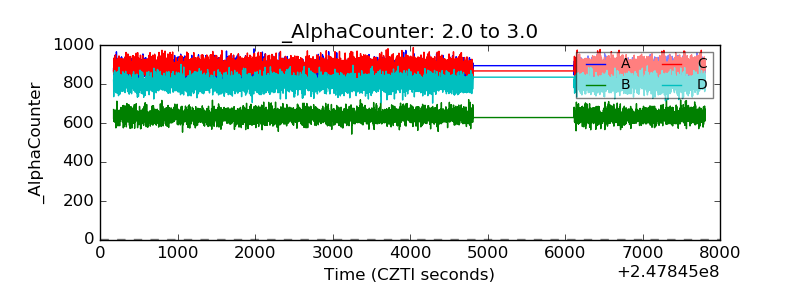 |
| _CPM_Rate | 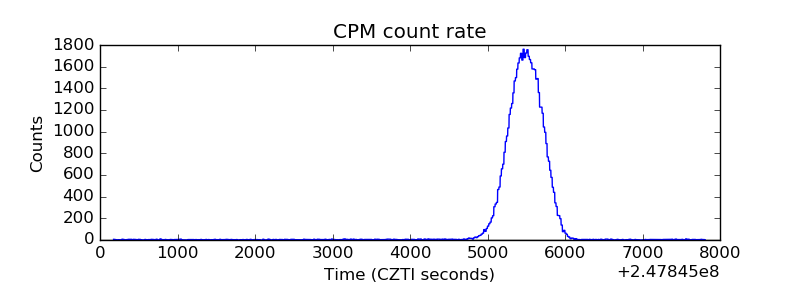 |
| CZT Counter | 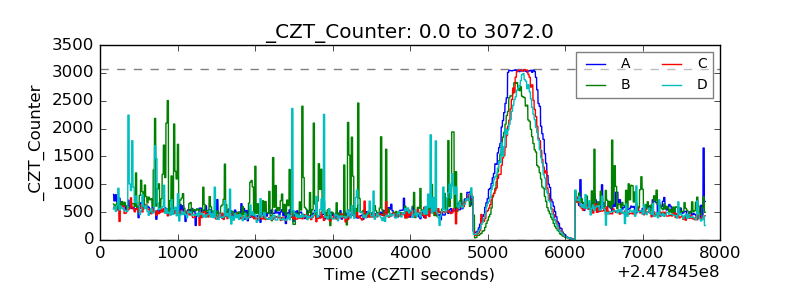 |
| +2.5 Volts monitor |  |
| +5 Volts monitor |  |
| _ROLL_ROT | 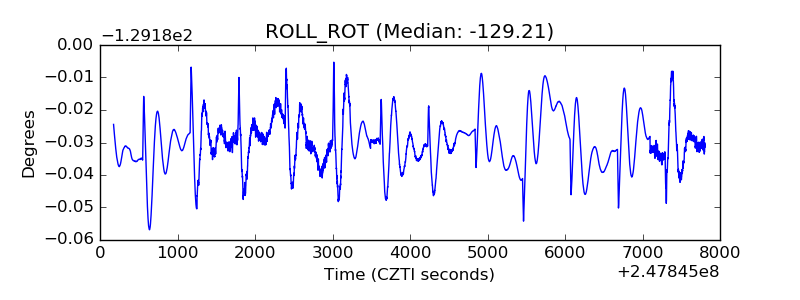 |
| _Roll_DEC | 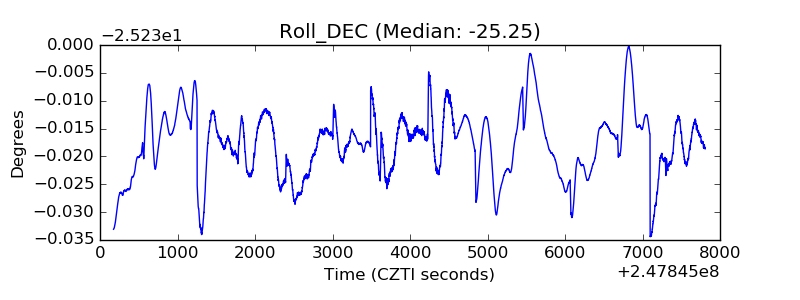 |
| _Roll_RA | 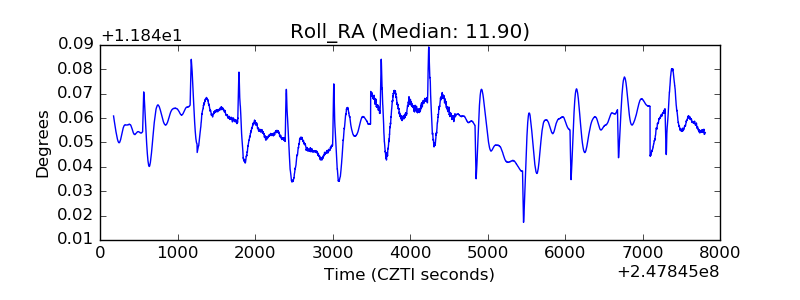 |
| Veto Counter | 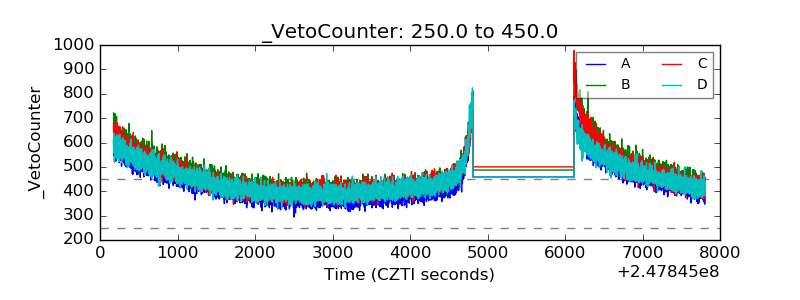 |