| Param | Original file | Final file |
|---|---|---|
| Filename | modeM0/AS1G08_010T01_9000001672_11436cztM0_level2.evt | modeM0/AS1G08_010T01_9000001672_11436cztM0_level2_quad_clean.evt |
| Size (bytes) | 202,288,320 | 50,912,640 |
| Size | 192.9 MB | 48.6 MB |
| Events in quadrant A | 1,392,371 | 349,082 |
| Events in quadrant B | 1,838,588 | 344,223 |
| Events in quadrant C | 1,151,990 | 338,877 |
| Events in quadrant D | 1,563,639 | 321,993 |
| Mode SS | |||
|---|---|---|---|
| Quadrant | BADHDUFLAG | Total packets | Discarded packets |
| A | 0 | 52 | 0 |
| B | 0 | 52 | 0 |
| C | 0 | 52 | 0 |
| D | 0 | 52 | 0 |
| Mode M0 | |||
|---|---|---|---|
| Quadrant | BADHDUFLAG | Total packets | Discarded packets |
| A | 0 | 6047 | 1 |
| B | 0 | 7219 | 1 |
| C | 0 | 5359 | 1 |
| D | 0 | 6437 | 1 |
| Mode M9 | |||
|---|---|---|---|
| Quadrant | BADHDUFLAG | Total packets | Discarded packets |
| A | 0 | 4 | 0 |
| B | 0 | 4 | 0 |
| C | 0 | 4 | 0 |
| D | 0 | 5 | 0 |
| Quadrant | Total seconds | Saturated seconds | Saturation percentage |
|---|---|---|---|
| A | 2617 | 10 | 0.382117% |
| B | 2617 | 147 | 5.617119% |
| C | 2617 | 4 | 0.152847% |
| D | 2617 | 79 | 3.018724% |
Noise dominated data is calculated using 1-second bins in cleaned event files. If a bin has >2000 counts, and if more than 50% of those come from <1% of pixels, then it is considered to be noise-dominated and hence unusable.
| Quadrant | # 1 sec bins | Bins with >0 counts | Bins with >2000 counts | High rate bins dominated by noise | Noise dominated (total time) | Noise dominated (detector-on time) | Marked lightcurve |
|---|---|---|---|---|---|---|---|
| A | 2617 | 2617 | 0 | 0 | 0.00% | 0.00% | 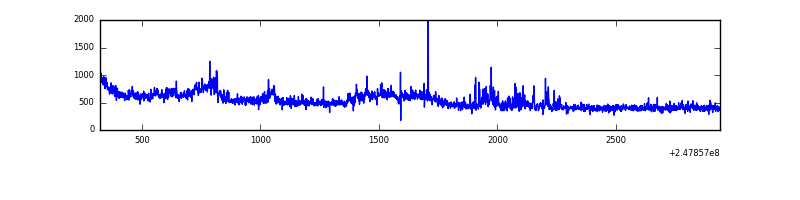 |
| B | 2617 | 2617 | 83 | 83 | 3.17% | 3.17% | 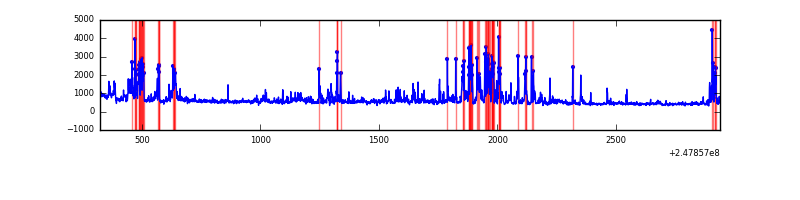 |
| C | 2617 | 2617 | 0 | 0 | 0.00% | 0.00% |  |
| D | 2617 | 2617 | 65 | 65 | 2.48% | 2.48% | 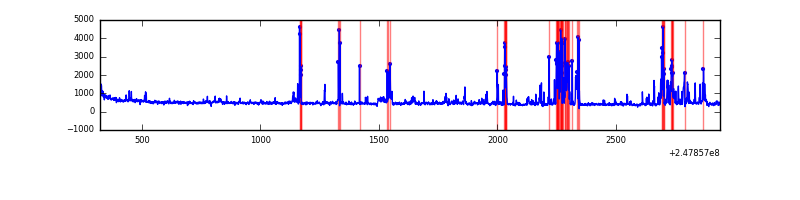 |
Top three noisy pixels from each quadrant. If the there are fewer than three noisy pixels in the level2.evt file, extra rows are filled as -1
| Pixel properties | Quadrant properties | ||||||
|---|---|---|---|---|---|---|---|
| Quadrant | DetID | PixID | Counts | Sigma | Mean | Median | Sigma |
| A | 15 | 174 | 114357 | 1739.98 | 314 | 309 | 65.5 |
| A | 1 | 162 | 24652 | 371.39 | 314 | 309 | 65.5 |
| A | 1 | 178 | 14547 | 217.22 | 314 | 309 | 65.5 |
| B | 4 | 239 | 461685 | 7599.71 | 308 | 302 | 60.7 |
| B | 11 | 51 | 65586 | 1075.33 | 308 | 302 | 60.7 |
| B | 15 | 204 | 58831 | 964.07 | 308 | 302 | 60.7 |
| C | 13 | 61 | 2156 | 26.62 | 295 | 297 | 69.8 |
| C | 3 | 202 | 732 | 6.23 | 295 | 297 | 69.8 |
| C | -1 | -1 | -1 | -1.0 | 295 | 297 | 69.8 |
| D | 1 | 52 | 188486 | 2632.02 | 292 | 285 | 71.5 |
| D | 13 | 104 | 108475 | 1513.06 | 292 | 285 | 71.5 |
| D | 14 | 34 | 68249 | 950.49 | 292 | 285 | 71.5 |
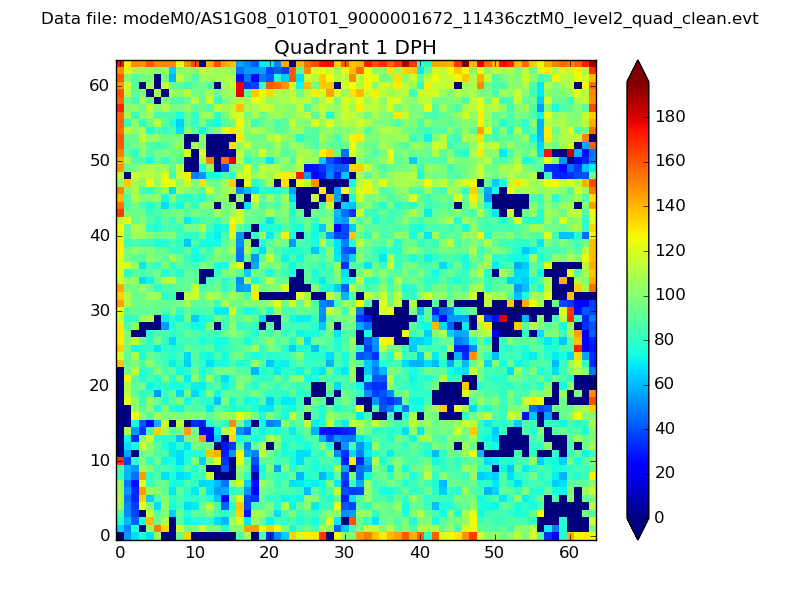
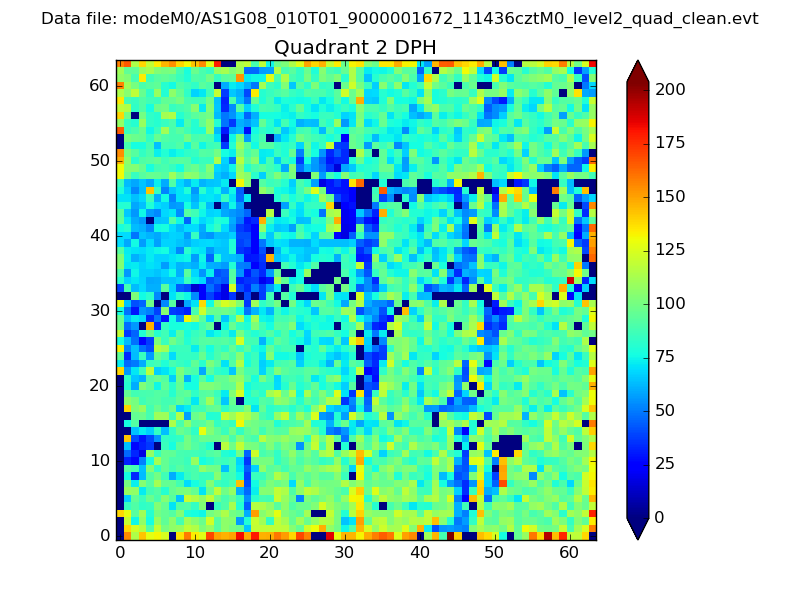
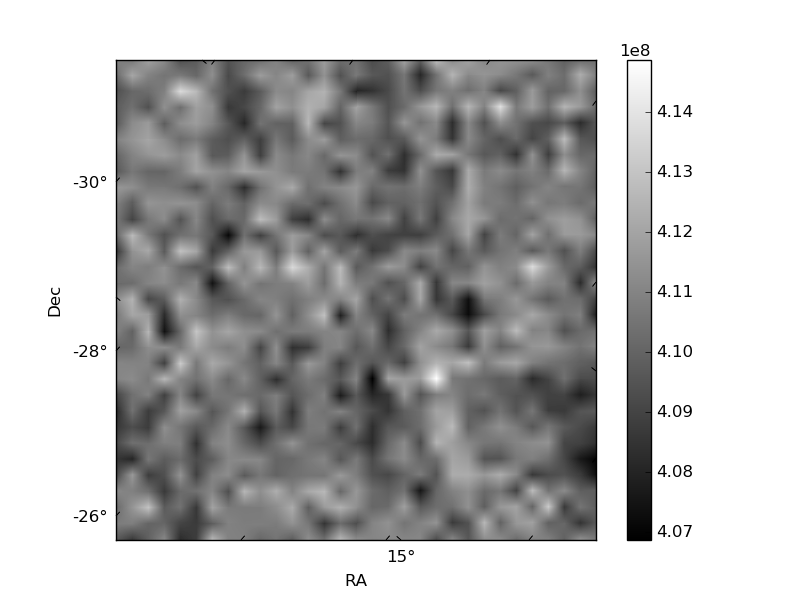
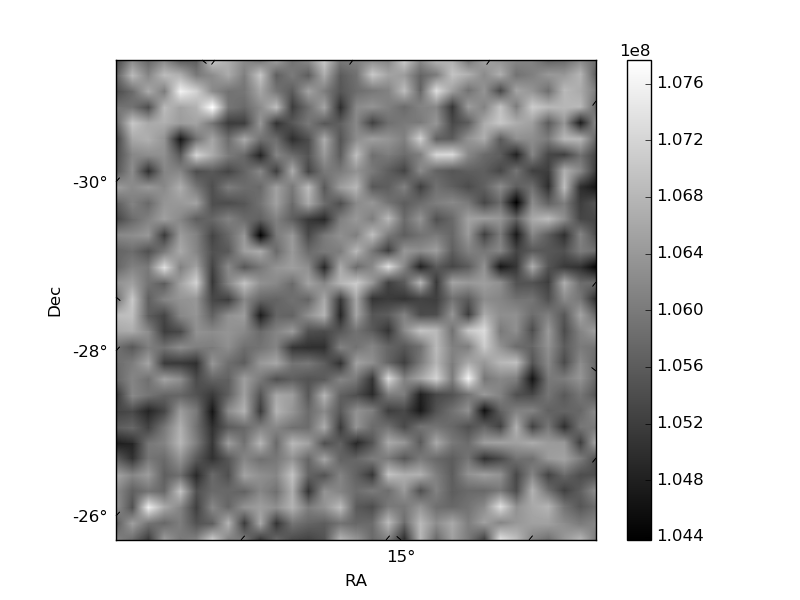
Histogram calculated using DETX and DETY for each event in the final _common_clean file
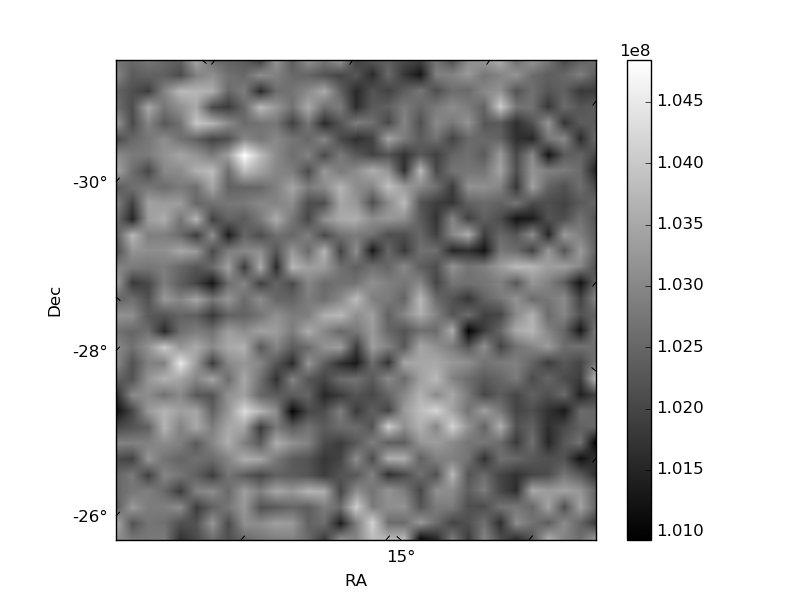
| Quadrant A | 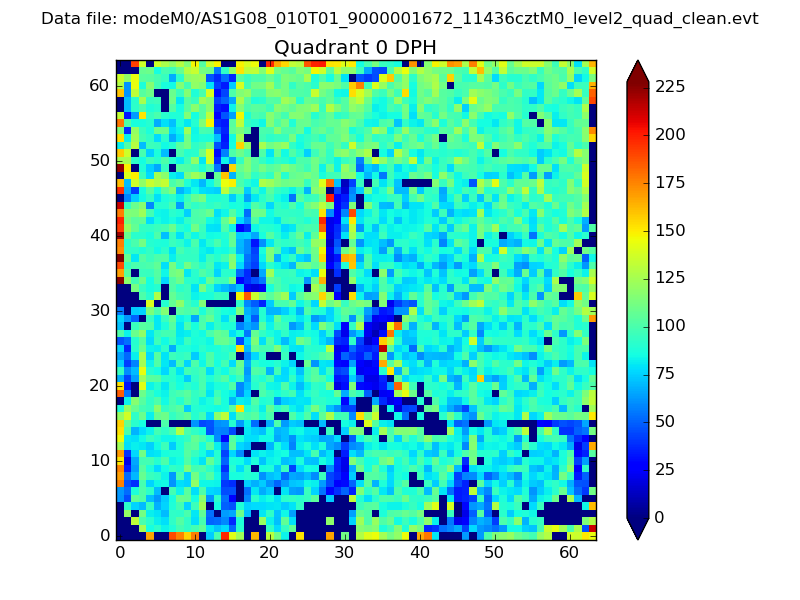 |
 |
Quadrant B |
|---|---|---|---|
| Quadrant D | 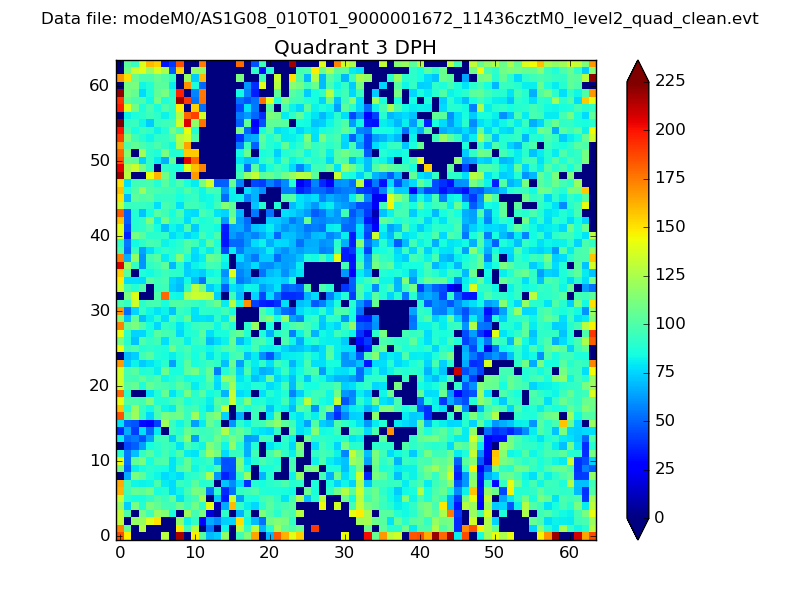 |
 |
Quadrant C |
| Plot type | Count rate plots | Images |
|---|---|---|
| Comparison with Poisson distribution Blue bars denote a histogram of data divided into 1 sec bins. Red curve is a Poisson curve with rate = median count rate of data. |
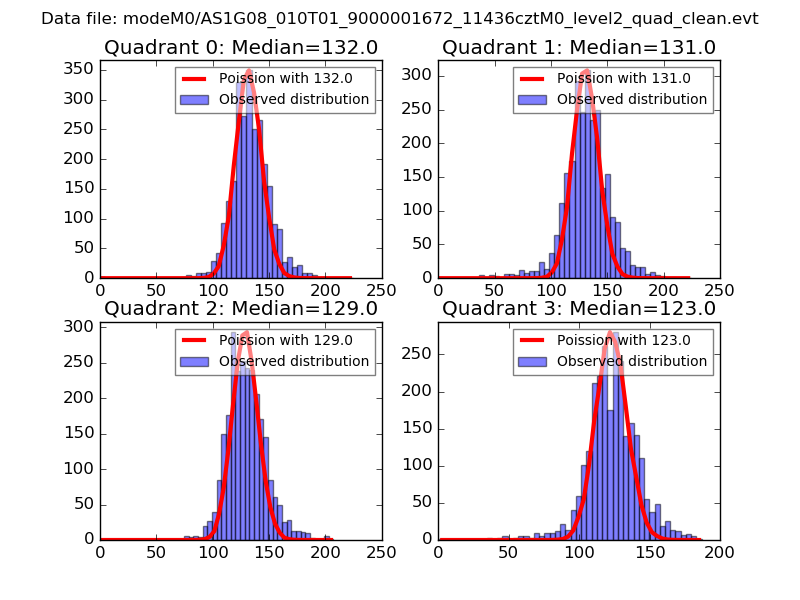 |
 |
| Quadrant-wise count rates Data is divided into 100 sec bins |
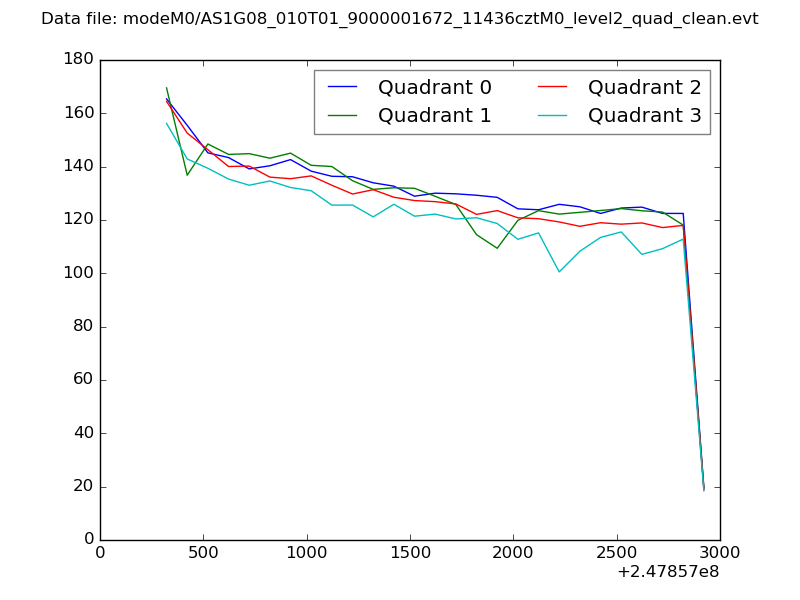 |
|
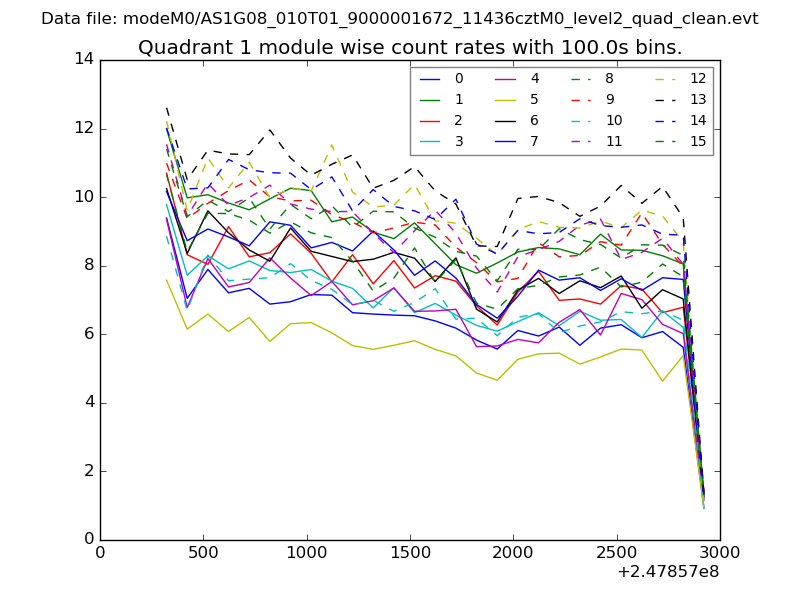
| Module-wise count rates for Quadrant A Data is divided into 100 sec bins |
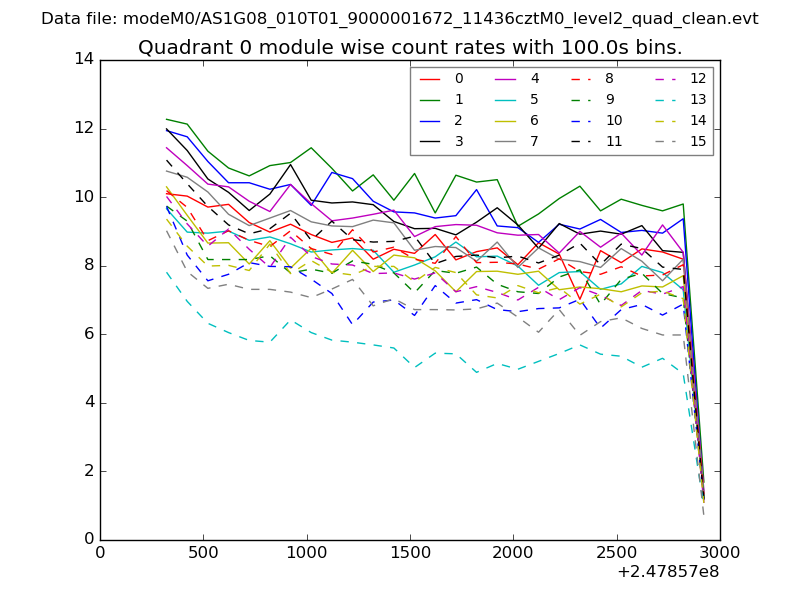 |
 |
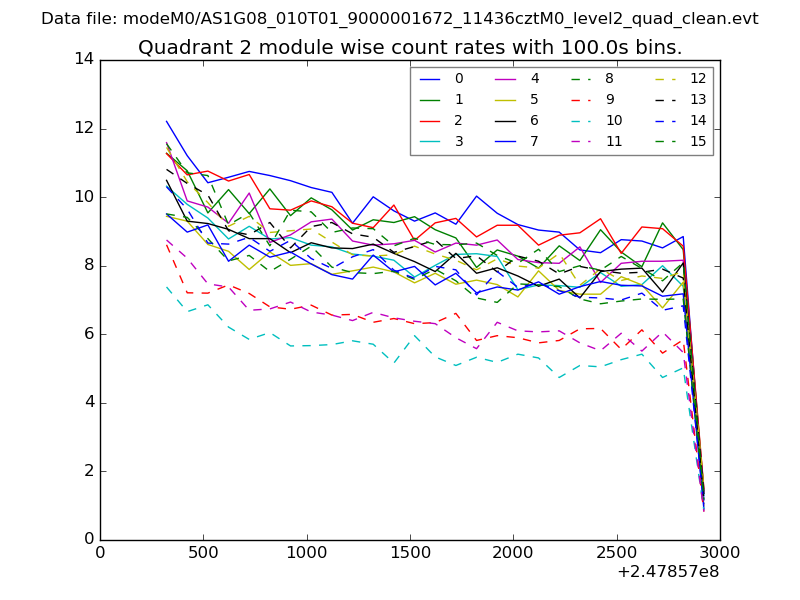
| Module-wise count rates for Quadrant B Data is divided into 100 sec bins |
 |
 |
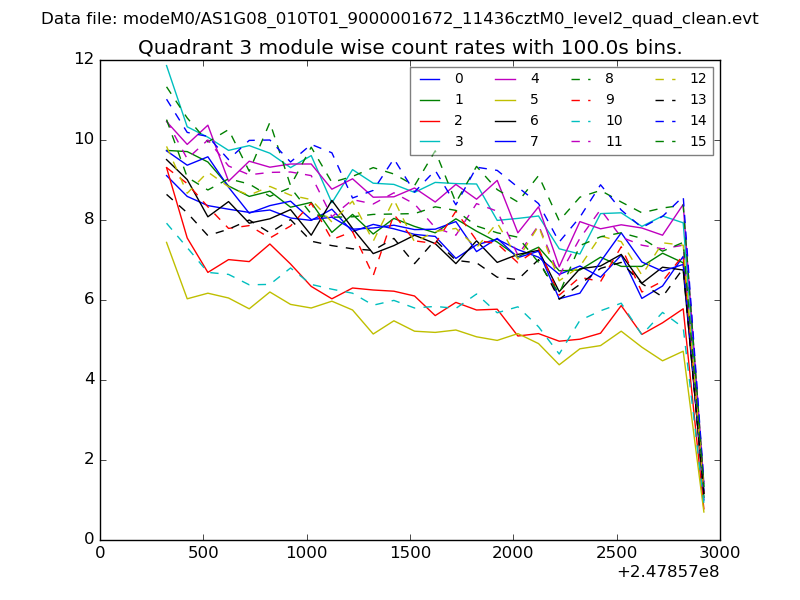
| Module-wise count rates for Quadrant C Data is divided into 100 sec bins |
 |
 |
| Module-wise count rates for Quadrant D Data is divided into 100 sec bins |
 |
 |
| Parameter | Plot |
|---|---|
| CZT HV Monitor | 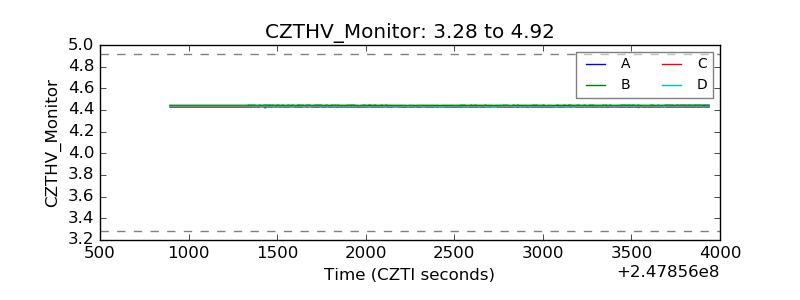 |
| D_VDD | 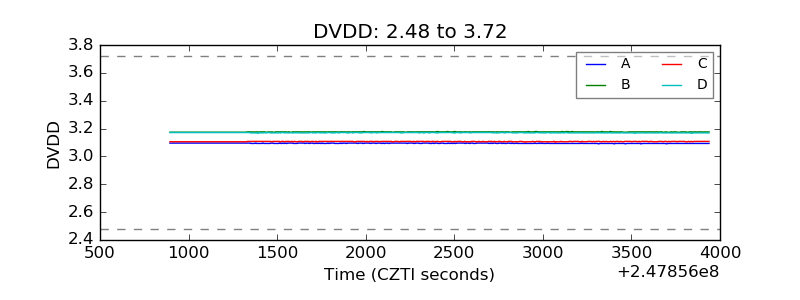 |
| Temperature 1 | 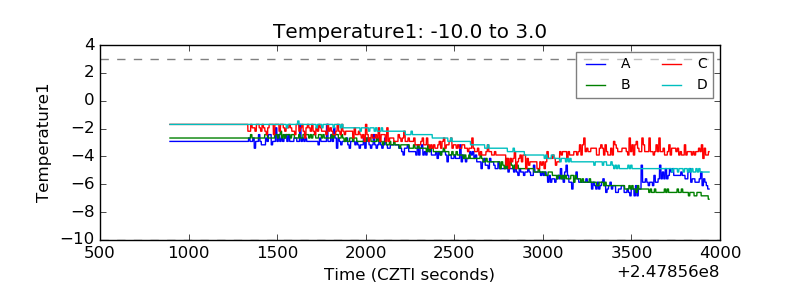 |
| Veto HV Monitor | 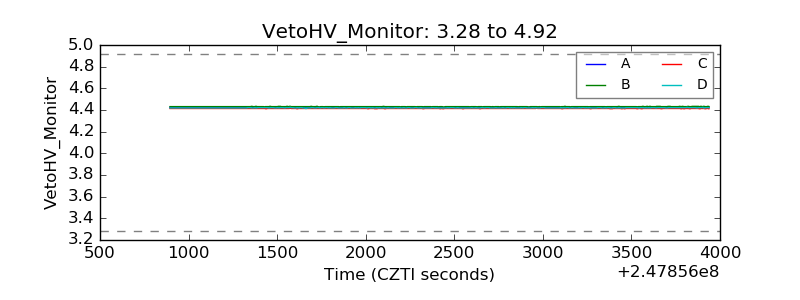 |
| Veto LLD | 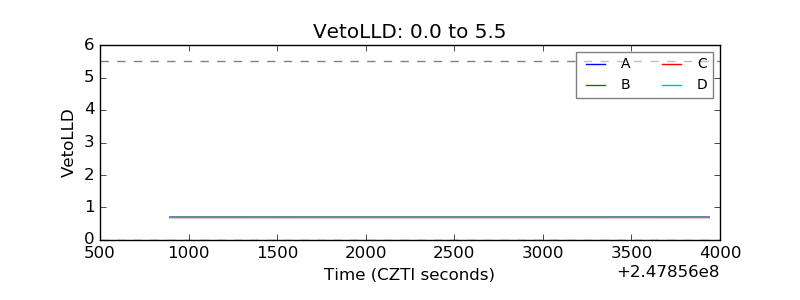 |
| Alpha Counter | 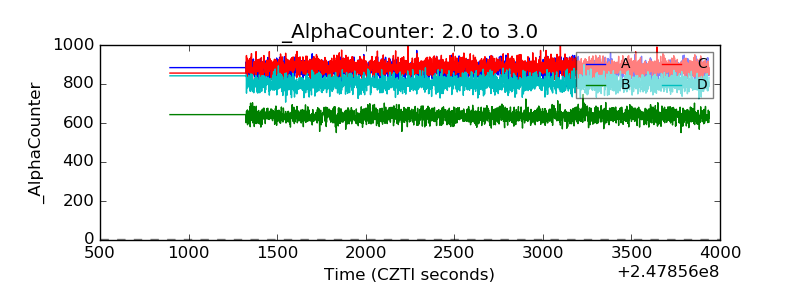 |
| _CPM_Rate | 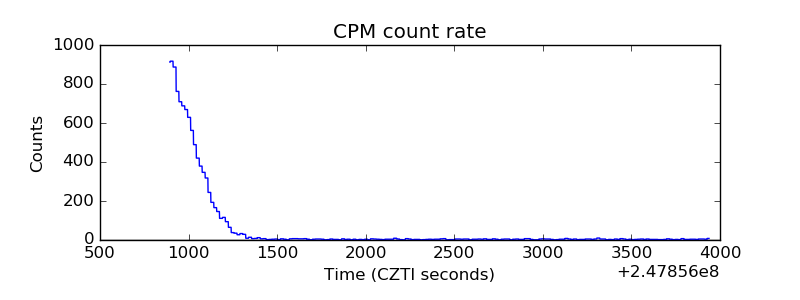 |
| CZT Counter | 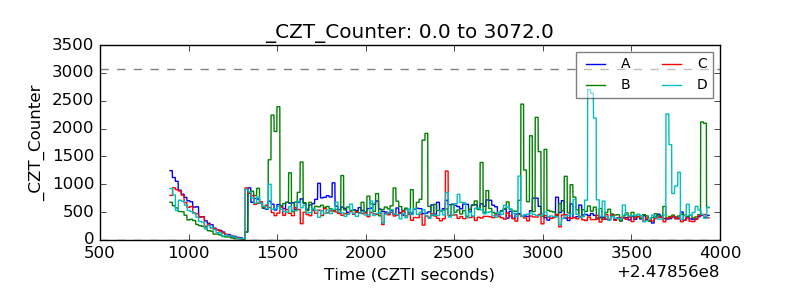 |
| +2.5 Volts monitor |  |
| +5 Volts monitor | 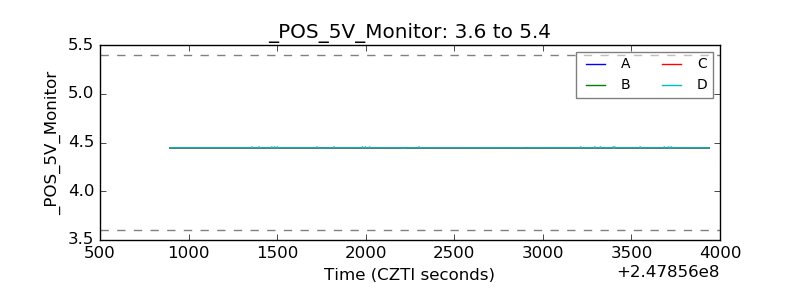 |
| _ROLL_ROT | 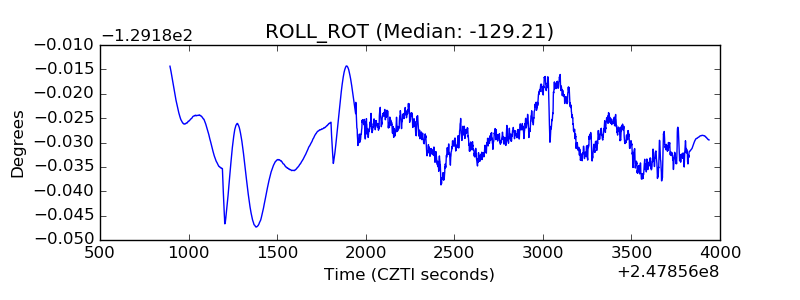 |
| _Roll_DEC | 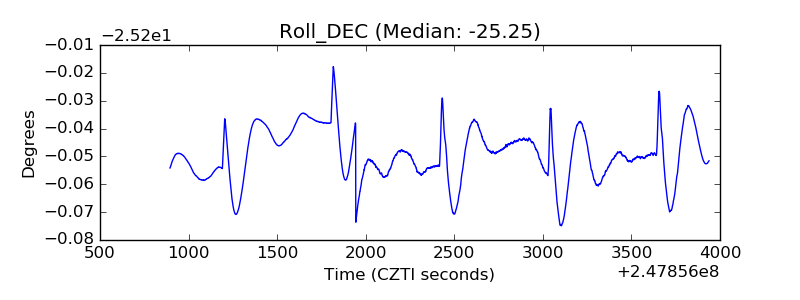 |
| _Roll_RA | 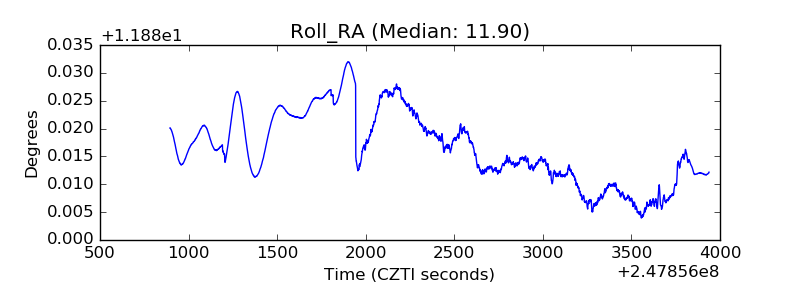 |
| Veto Counter | 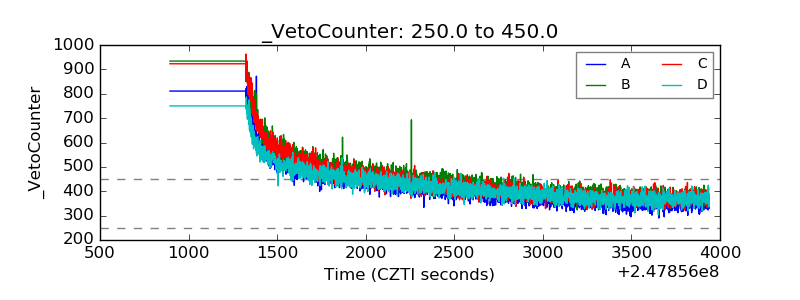 |