| Param | Original file | Final file |
|---|---|---|
| Filename | modeM0/AS1A04_021T03_9000001678cztM0_level2.fits | modeM0/AS1A04_021T03_9000001678cztM0_level2_quad_clean.evt |
| Size (bytes) | 602,496,000 | 609,494,400 |
| Size | 574.6 MB | 581.3 MB |
| Events in quadrant A | 3,684,154 | 3,633,723 |
| Events in quadrant B | 3,434,086 | 3,415,429 |
| Events in quadrant C | 3,663,668 | 3,780,372 |
| Events in quadrant D | 2,996,056 | 3,164,407 |
| Mode M0 | |||
|---|---|---|---|
| Quadrant | BADHDUFLAG | Total packets | Discarded packets |
| A | 0 | 138230 | 0 |
| B | 0 | 183046 | 0 |
| C | 0 | 133512 | 0 |
| D | 0 | 193872 | 0 |
| Mode M9 | |||
|---|---|---|---|
| Quadrant | BADHDUFLAG | Total packets | Discarded packets |
| A | 0 | 93 | 0 |
| B | 0 | 93 | 0 |
| C | 0 | 93 | 0 |
| D | 0 | 93 | 0 |
| Mode SS | |||
|---|---|---|---|
| Quadrant | BADHDUFLAG | Total packets | Discarded packets |
| A | 0 | 1322 | 0 |
| B | 0 | 1322 | 0 |
| C | 0 | 1322 | 0 |
| D | 0 | 1322 | 0 |
| Quadrant | Total seconds | Saturated seconds | Saturation percentage |
|---|---|---|---|
| A | 65107 | 718 | 1.102800% |
| B | 65107 | 4423 | 6.793432% |
| C | 65107 | 396 | 0.608230% |
| D | 65107 | 6272 | 9.633373% |
Noise dominated data is calculated using 1-second bins in cleaned event files. If a bin has >2000 counts, and if more than 50% of those come from <1% of pixels, then it is considered to be noise-dominated and hence unusable.
| Quadrant | # 1 sec bins | Bins with >0 counts | Bins with >2000 counts | High rate bins dominated by noise | Noise dominated (total time) | Noise dominated (detector-on time) | Marked lightcurve |
|---|---|---|---|---|---|---|---|
| A | 74272 | 65107 | 0 | 0 | 0.00% | 0.00% |  |
| B | 74272 | 65093 | 0 | 0 | 0.00% | 0.00% |  |
| C | 74272 | 65108 | 0 | 0 | 0.00% | 0.00% |  |
| D | 74272 | 64586 | 0 | 0 | 0.00% | 0.00% |  |
Top three noisy pixels from each quadrant. If the there are fewer than three noisy pixels in the level2.evt file, extra rows are filled as -1
| Pixel properties | Quadrant properties | ||||||
|---|---|---|---|---|---|---|---|
| Quadrant | DetID | PixID | Counts | Sigma | Mean | Median | Sigma |
| A | 0 | 29 | 3555 | 11.11 | 959 | 894 | 239.5 |
| A | 7 | 110 | 2985 | 8.73 | 959 | 894 | 239.5 |
| A | 0 | 30 | 2720 | 7.62 | 959 | 894 | 239.5 |
| B | 2 | 9 | 3063 | 12.25 | 905 | 861 | 179.7 |
| B | 2 | 8 | 2314 | 8.08 | 905 | 861 | 179.7 |
| B | 3 | 17 | 2299 | 8.0 | 905 | 861 | 179.7 |
| C | 12 | 250 | 2731 | 7.27 | 965 | 895 | 252.5 |
| C | 1 | 80 | 2666 | 7.01 | 965 | 895 | 252.5 |
| C | 1 | 81 | 2572 | 6.64 | 965 | 895 | 252.5 |
| D | 6 | 231 | 2213 | 6.28 | 854 | 779 | 228.4 |
| D | 3 | 14 | 2178 | 6.12 | 854 | 779 | 228.4 |
| D | 6 | 83 | 2122 | 5.88 | 854 | 779 | 228.4 |
Histogram calculated using DETX and DETY for each event in the final _common_clean file
| Quadrant A | 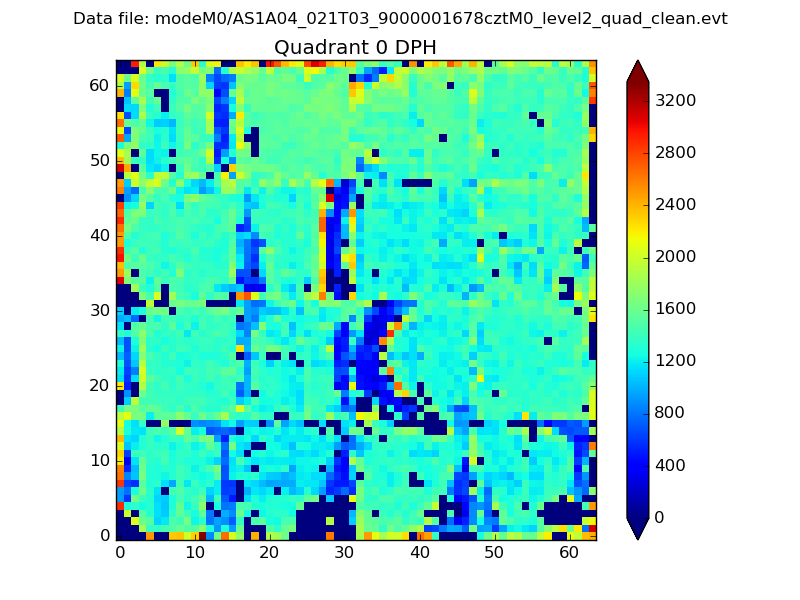 |
 |
Quadrant B |
|---|---|---|---|
| Quadrant D |  |
 |
Quadrant C |
| Plot type | Count rate plots | Images |
|---|---|---|
| Comparison with Poisson distribution Blue bars denote a histogram of data divided into 1 sec bins. Red curve is a Poisson curve with rate = median count rate of data. |
 |
 |
| Quadrant-wise count rates Data is divided into 100 sec bins |
 |
|
| Module-wise count rates for Quadrant A Data is divided into 100 sec bins |
 |
 |
| Module-wise count rates for Quadrant B Data is divided into 100 sec bins |
 |
 |
| Module-wise count rates for Quadrant C Data is divided into 100 sec bins |
 |
 |
| Module-wise count rates for Quadrant D Data is divided into 100 sec bins |
 |
 |
| Parameter | Plot |
|---|---|
| CZT HV Monitor |  |
| D_VDD |  |
| Temperature 1 | 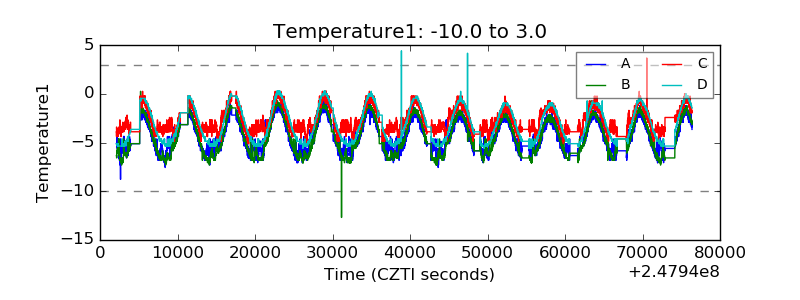 |
| Veto HV Monitor |  |
| Veto LLD |  |
| Alpha Counter |  |
| _CPM_Rate |  |
| CZT Counter |  |
| +2.5 Volts monitor |  |
| +5 Volts monitor |  |
| _ROLL_ROT |  |
| _Roll_DEC |  |
| _Roll_RA |  |
| Veto Counter | 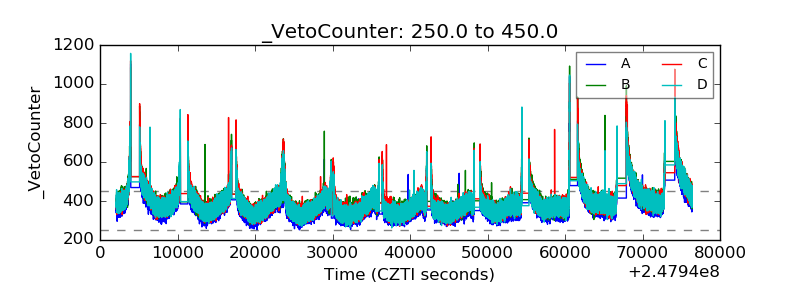 |