| Param | Original file | Final file |
|---|---|---|
| Filename | modeM0/AS1A04_021T03_9000001678_11450cztM0_level2.evt | modeM0/AS1A04_021T03_9000001678_11450cztM0_level2_quad_clean.evt |
| Size (bytes) | 257,797,440 | 36,414,720 |
| Size | 245.9 MB | 34.7 MB |
| Events in quadrant A | 1,693,250 | 218,482 |
| Events in quadrant B | 2,572,260 | 208,745 |
| Events in quadrant C | 1,580,503 | 233,085 |
| Events in quadrant D | 1,745,616 | 217,496 |
| Mode M0 | |||
|---|---|---|---|
| Quadrant | BADHDUFLAG | Total packets | Discarded packets |
| A | 0 | 7034 | 2 |
| B | 0 | 9679 | 1 |
| C | 0 | 6659 | 1 |
| D | 0 | 7238 | 1 |
| Mode M9 | |||
|---|---|---|---|
| Quadrant | BADHDUFLAG | Total packets | Discarded packets |
| A | 0 | 12 | 0 |
| B | 0 | 12 | 0 |
| C | 0 | 12 | 0 |
| D | 0 | 12 | 0 |
| Mode SS | |||
|---|---|---|---|
| Quadrant | BADHDUFLAG | Total packets | Discarded packets |
| A | 0 | 64 | 0 |
| B | 0 | 64 | 0 |
| C | 0 | 64 | 0 |
| D | 0 | 64 | 0 |
| Quadrant | Total seconds | Saturated seconds | Saturation percentage |
|---|---|---|---|
| A | 3157 | 115 | 3.642699% |
| B | 3157 | 353 | 11.181501% |
| C | 3157 | 79 | 2.502376% |
| D | 3157 | 97 | 3.072537% |
Noise dominated data is calculated using 1-second bins in cleaned event files. If a bin has >2000 counts, and if more than 50% of those come from <1% of pixels, then it is considered to be noise-dominated and hence unusable.
| Quadrant | # 1 sec bins | Bins with >0 counts | Bins with >2000 counts | High rate bins dominated by noise | Noise dominated (total time) | Noise dominated (detector-on time) | Marked lightcurve |
|---|---|---|---|---|---|---|---|
| A | 4363 | 3160 | 3 | 3 | 0.07% | 0.09% | 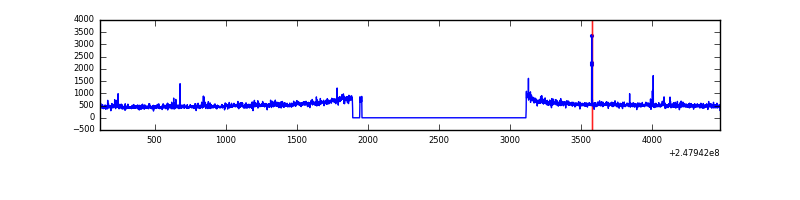 |
| B | 4363 | 3160 | 142 | 142 | 3.25% | 4.49% | 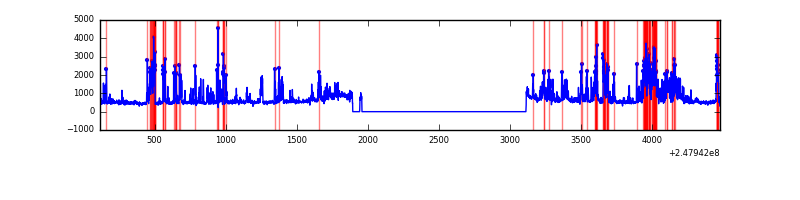 |
| C | 4363 | 3160 | 0 | 0 | 0.00% | 0.00% | 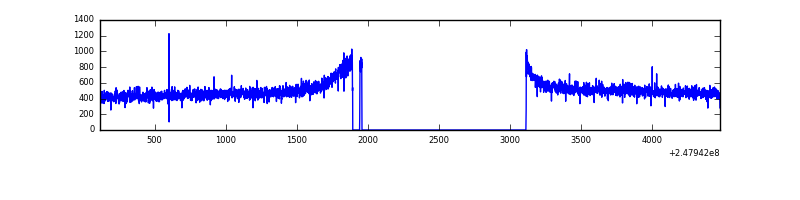 |
| D | 4363 | 3160 | 12 | 12 | 0.28% | 0.38% | 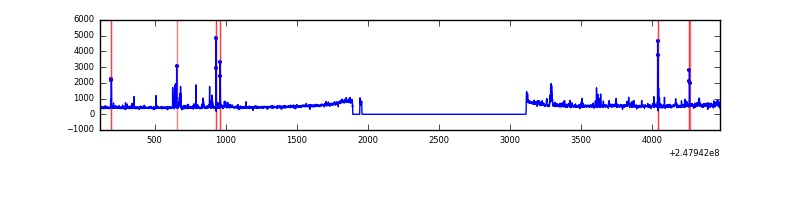 |
Top three noisy pixels from each quadrant. If the there are fewer than three noisy pixels in the level2.evt file, extra rows are filled as -1
| Pixel properties | Quadrant properties | ||||||
|---|---|---|---|---|---|---|---|
| Quadrant | DetID | PixID | Counts | Sigma | Mean | Median | Sigma |
| A | 1 | 162 | 30876 | 361.32 | 408 | 399 | 84.3 |
| A | 8 | 5 | 21572 | 251.02 | 408 | 399 | 84.3 |
| A | 1 | 178 | 18259 | 211.74 | 408 | 399 | 84.3 |
| B | 4 | 239 | 920747 | 12031.22 | 396 | 386 | 76.5 |
| B | 11 | 51 | 44855 | 581.31 | 396 | 386 | 76.5 |
| B | 15 | 204 | 24478 | 314.94 | 396 | 386 | 76.5 |
| C | 13 | 61 | 3008 | 27.43 | 405 | 406 | 94.8 |
| C | 3 | 202 | 966 | 5.9 | 405 | 406 | 94.8 |
| C | -1 | -1 | -1 | -1.0 | 405 | 406 | 94.8 |
| D | 13 | 104 | 41943 | 434.03 | 400 | 388 | 95.7 |
| D | 5 | 222 | 39508 | 408.6 | 400 | 388 | 95.7 |
| D | 13 | 249 | 37171 | 384.19 | 400 | 388 | 95.7 |
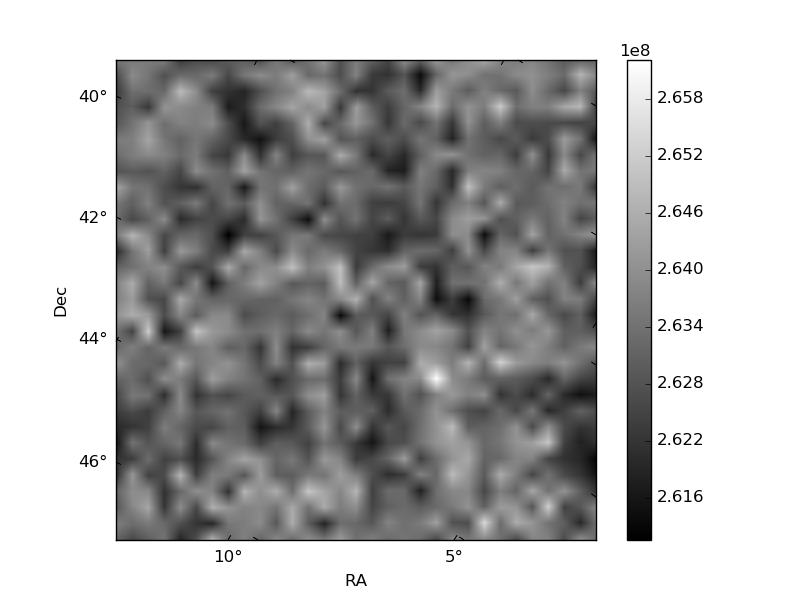
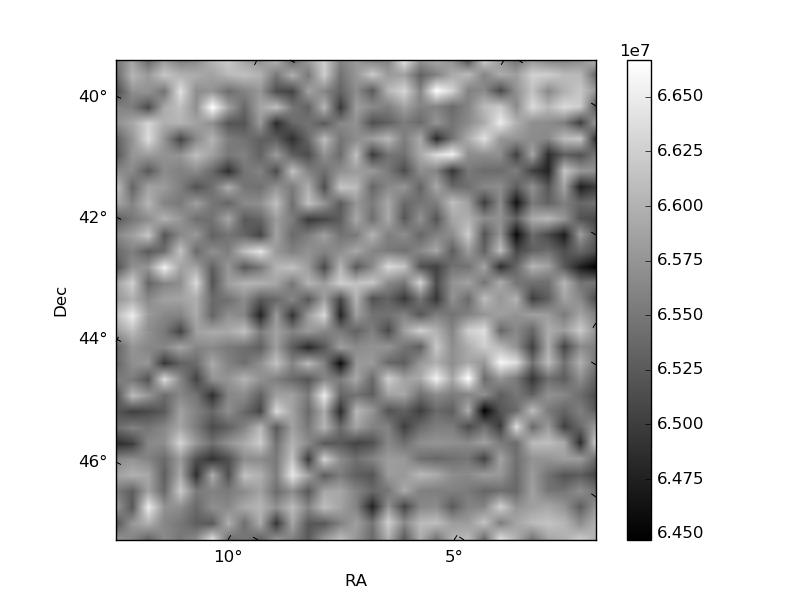
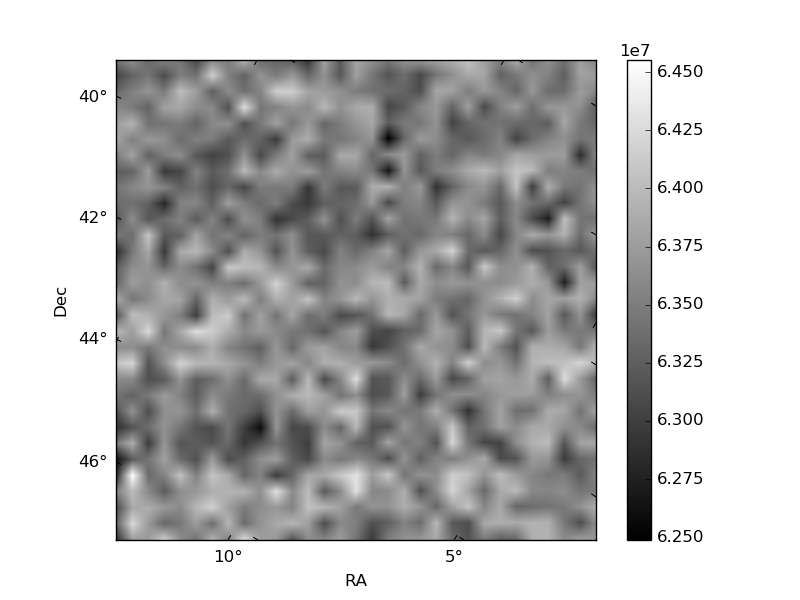
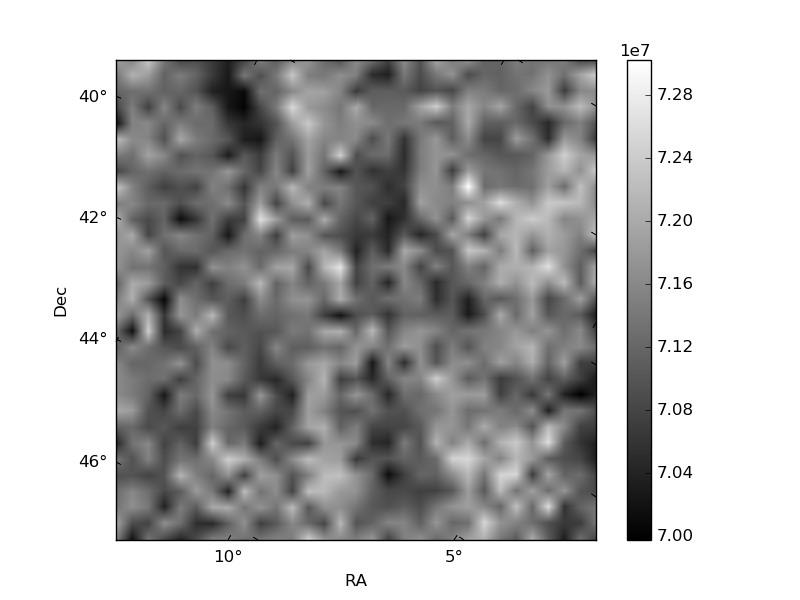
Histogram calculated using DETX and DETY for each event in the final _common_clean file
| Quadrant A | 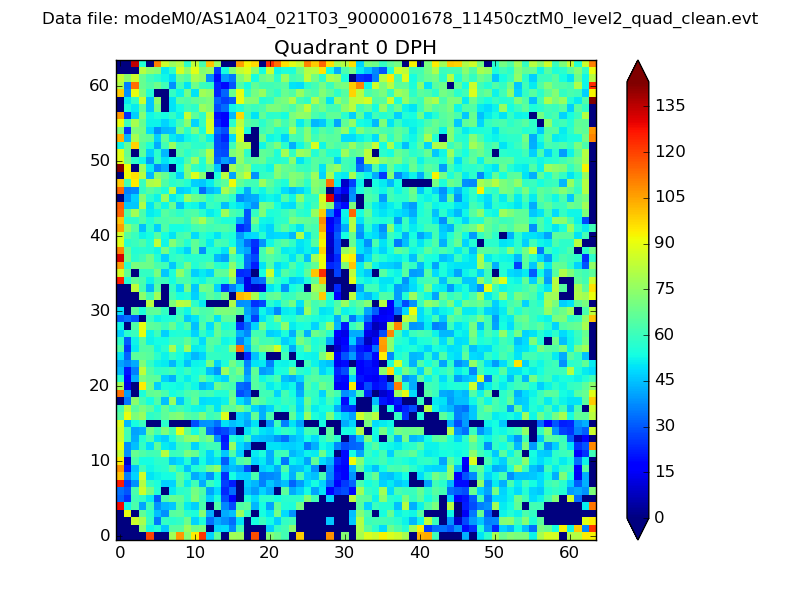 |
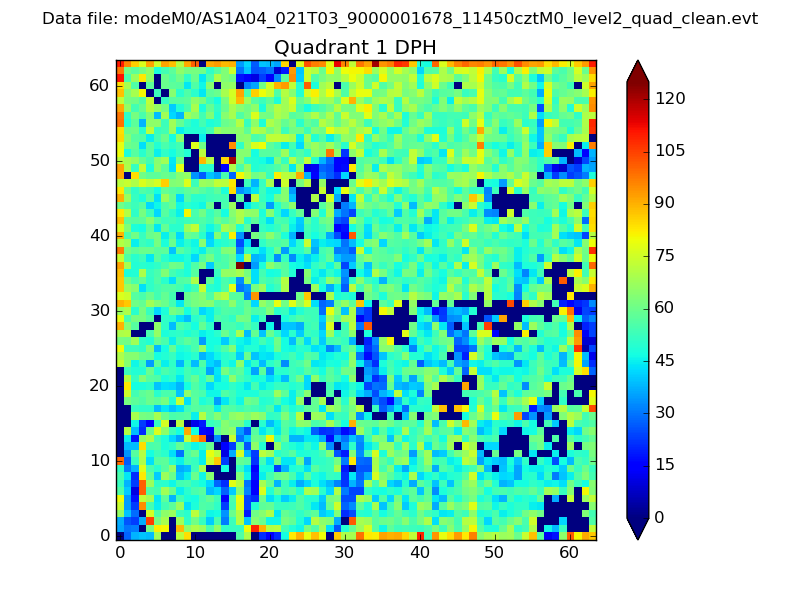 |
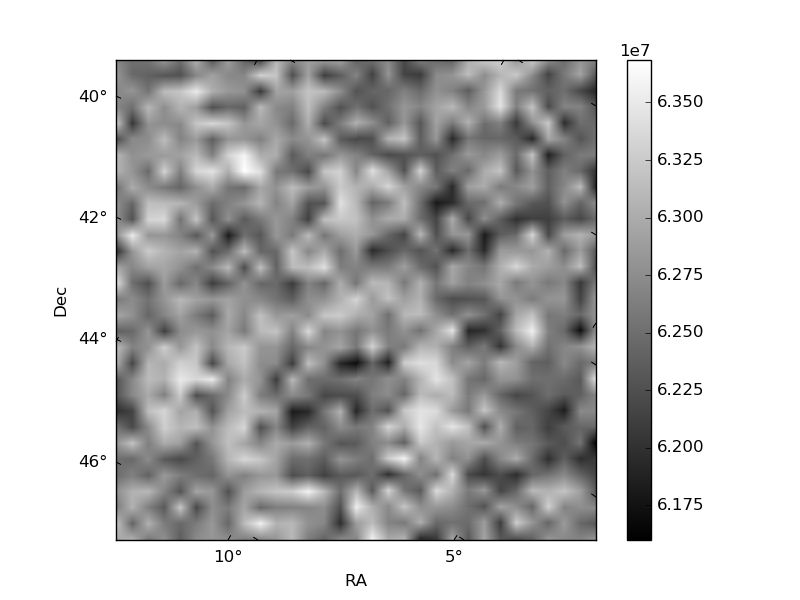
Quadrant B |
|---|---|---|---|
| Quadrant D | 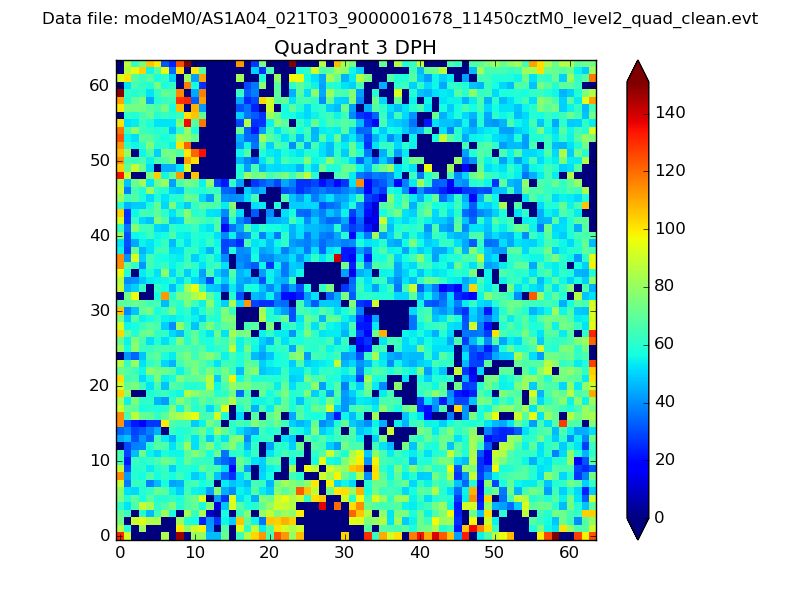 |
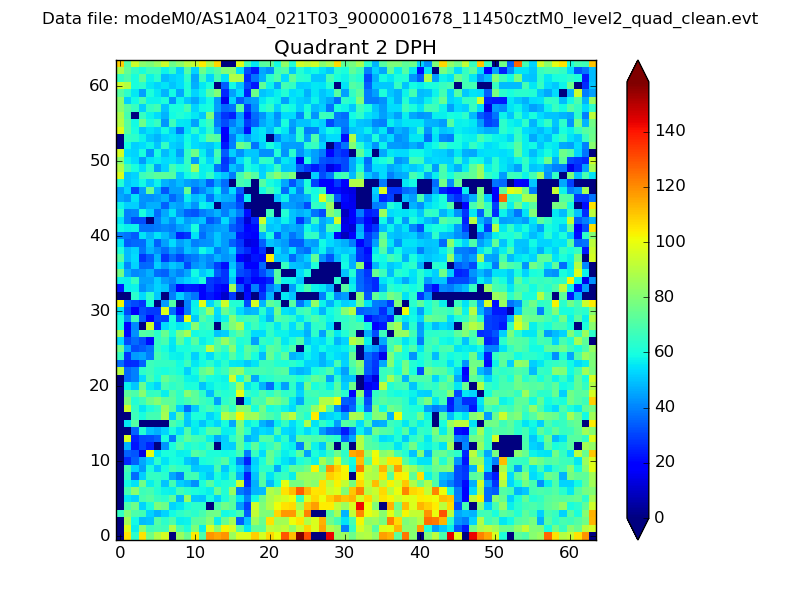 |
Quadrant C |
| Plot type | Count rate plots | Images |
|---|---|---|
| Comparison with Poisson distribution Blue bars denote a histogram of data divided into 1 sec bins. Red curve is a Poisson curve with rate = median count rate of data. |
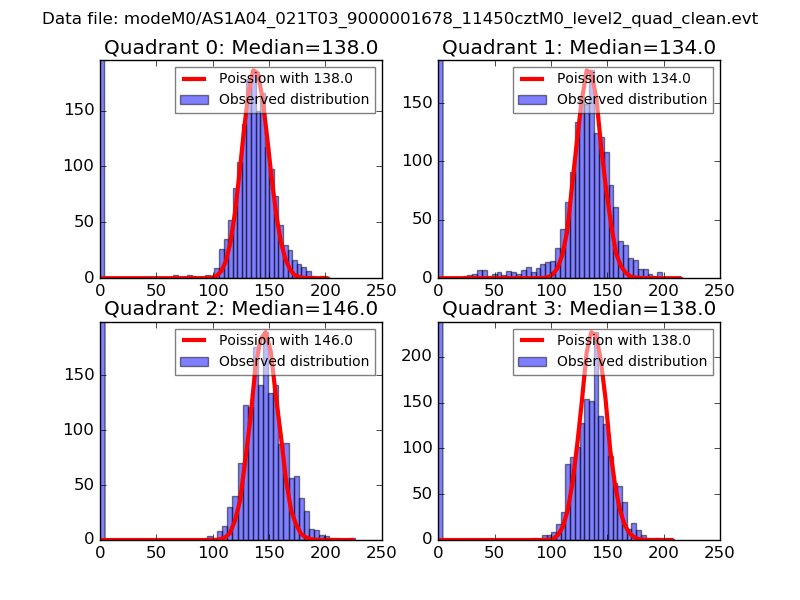 |
 |
| Quadrant-wise count rates Data is divided into 100 sec bins |
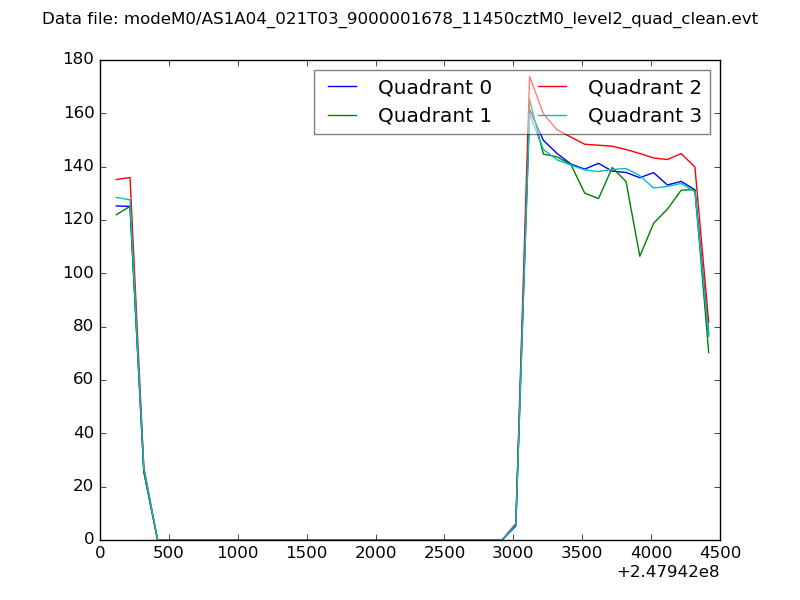 |
|
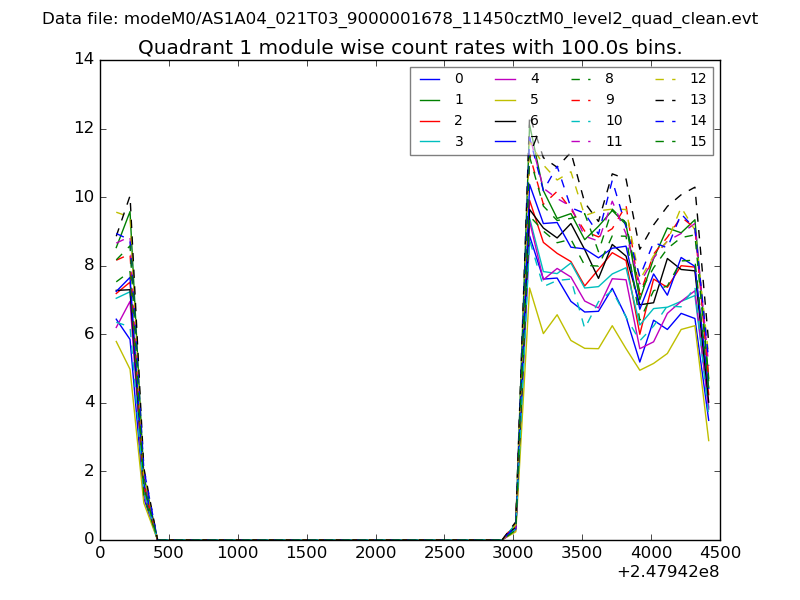
| Module-wise count rates for Quadrant A Data is divided into 100 sec bins |
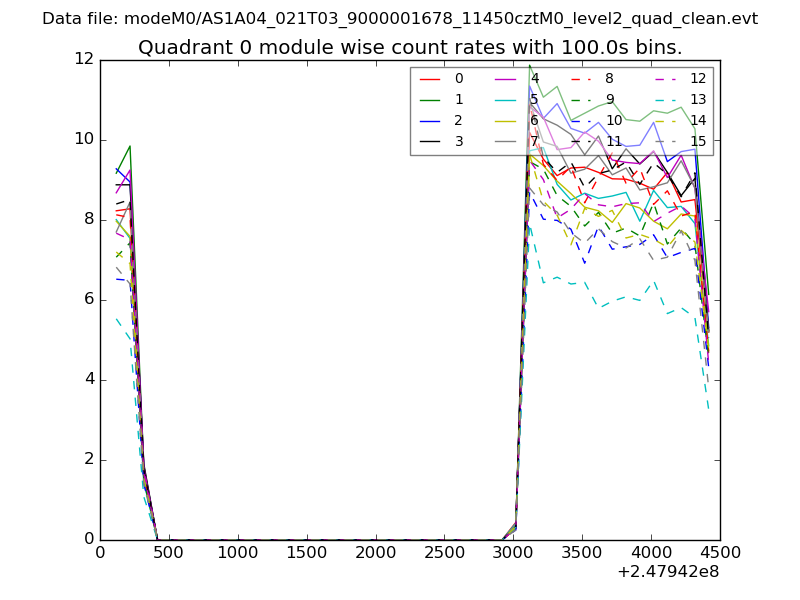 |
 |
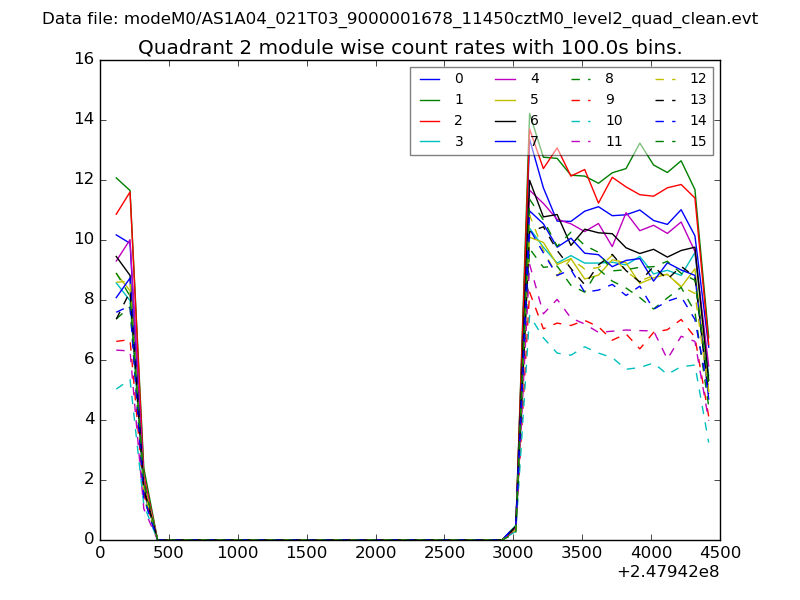
| Module-wise count rates for Quadrant B Data is divided into 100 sec bins |
 |
 |
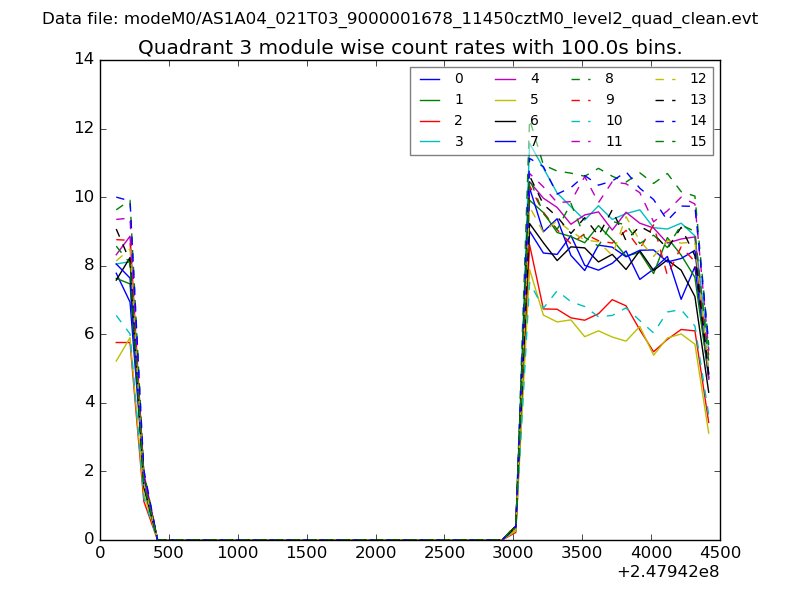
| Module-wise count rates for Quadrant C Data is divided into 100 sec bins |
 |
 |
| Module-wise count rates for Quadrant D Data is divided into 100 sec bins |
 |
 |
| Parameter | Plot |
|---|---|
| CZT HV Monitor | 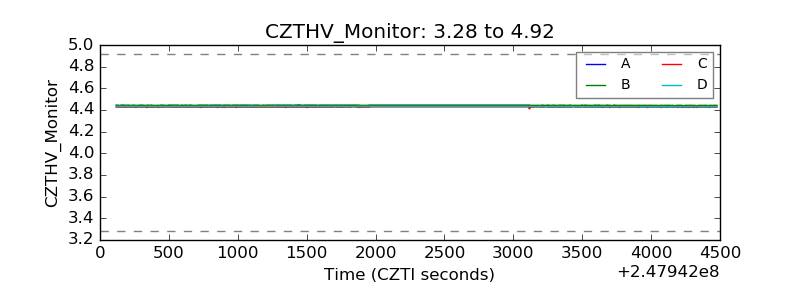 |
| D_VDD | 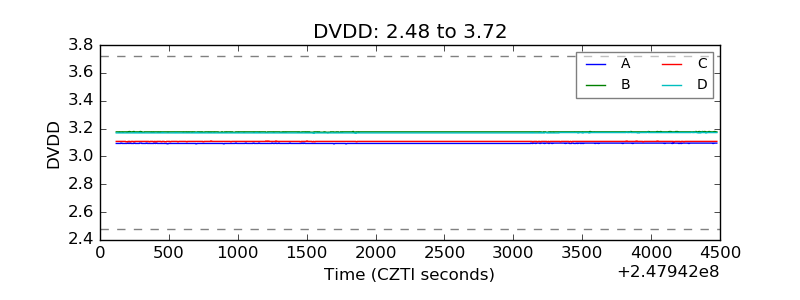 |
| Temperature 1 | 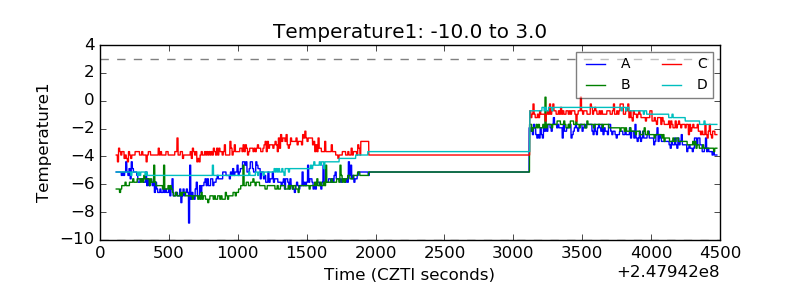 |
| Veto HV Monitor | 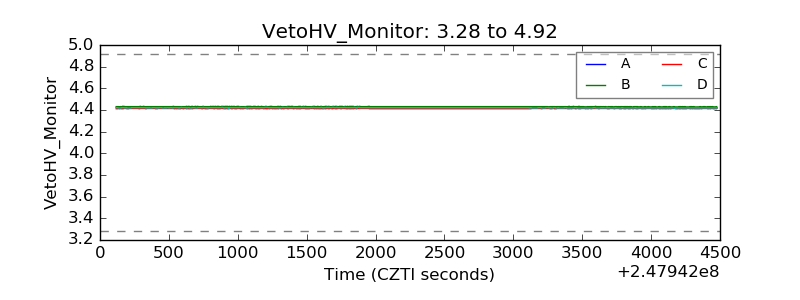 |
| Veto LLD | 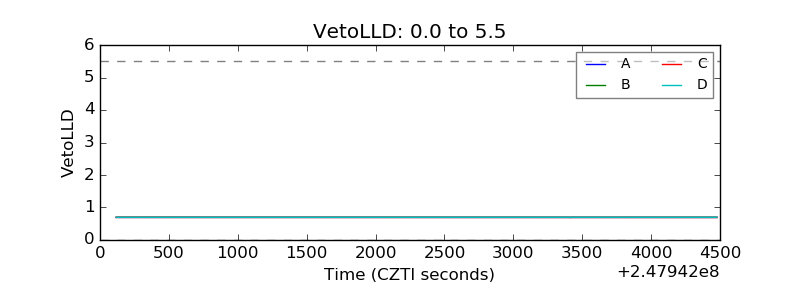 |
| Alpha Counter | 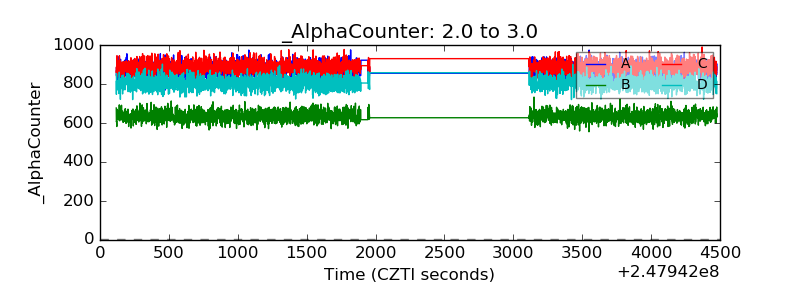 |
| _CPM_Rate | 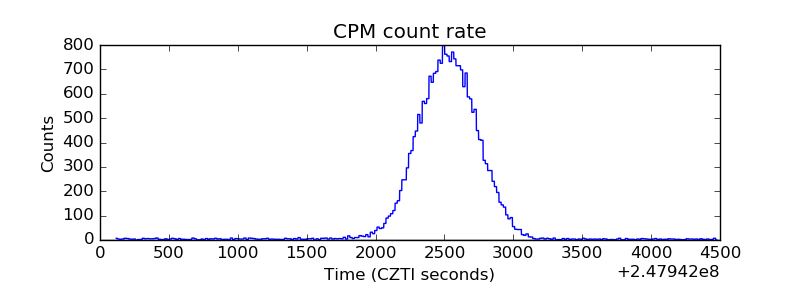 |
| CZT Counter | 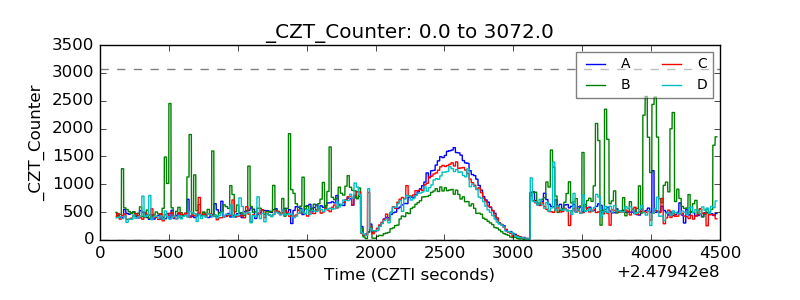 |
| +2.5 Volts monitor |  |
| +5 Volts monitor | 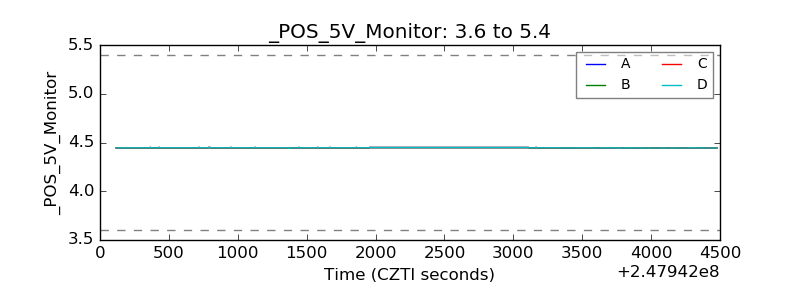 |
| _ROLL_ROT | 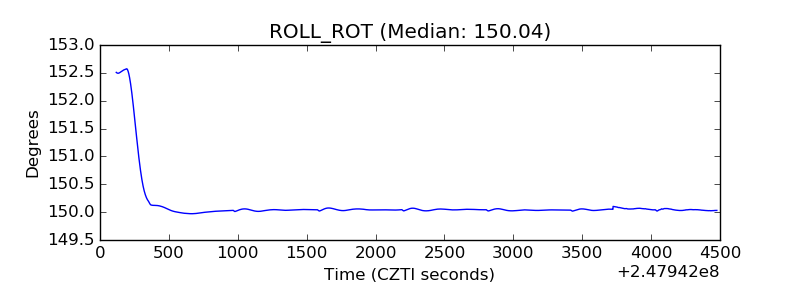 |
| _Roll_DEC | 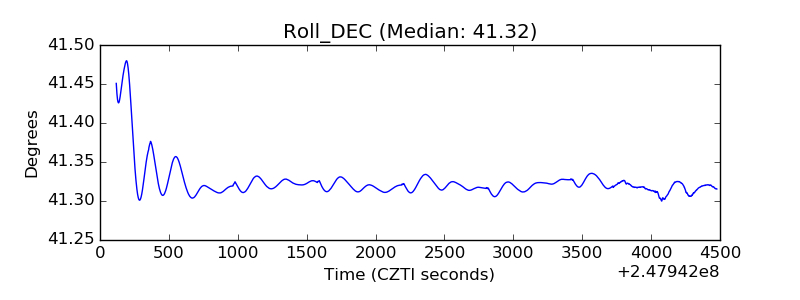 |
| _Roll_RA |  |
| Veto Counter | 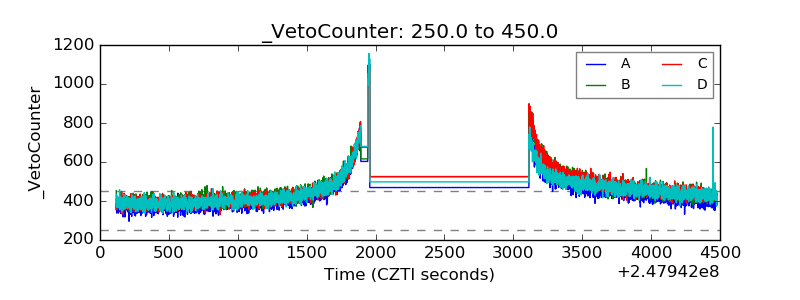 |