| Param | Original file | Final file |
|---|---|---|
| Filename | modeM0/AS1A04_021T03_9000001678_11452cztM0_level2.evt | modeM0/AS1A04_021T03_9000001678_11452cztM0_level2_quad_clean.evt |
| Size (bytes) | 591,171,840 | 103,199,040 |
| Size | 563.8 MB | 98.4 MB |
| Events in quadrant A | 3,657,800 | 648,652 |
| Events in quadrant B | 5,296,699 | 629,879 |
| Events in quadrant C | 3,381,467 | 694,410 |
| Events in quadrant D | 5,075,612 | 646,885 |
| Mode M0 | |||
|---|---|---|---|
| Quadrant | BADHDUFLAG | Total packets | Discarded packets |
| A | 0 | 15824 | 3 |
| B | 0 | 20539 | 2 |
| C | 0 | 15094 | 2 |
| D | 0 | 19971 | 2 |
| Mode M9 | |||
|---|---|---|---|
| Quadrant | BADHDUFLAG | Total packets | Discarded packets |
| A | 0 | 16 | 0 |
| B | 0 | 16 | 0 |
| C | 0 | 16 | 0 |
| D | 0 | 16 | 0 |
| Mode SS | |||
|---|---|---|---|
| Quadrant | BADHDUFLAG | Total packets | Discarded packets |
| A | 0 | 146 | 0 |
| B | 0 | 146 | 0 |
| C | 0 | 146 | 0 |
| D | 0 | 146 | 0 |
| Quadrant | Total seconds | Saturated seconds | Saturation percentage |
|---|---|---|---|
| A | 7269 | 95 | 1.306920% |
| B | 7269 | 544 | 7.483835% |
| C | 7269 | 51 | 0.701610% |
| D | 7269 | 595 | 8.185445% |
Noise dominated data is calculated using 1-second bins in cleaned event files. If a bin has >2000 counts, and if more than 50% of those come from <1% of pixels, then it is considered to be noise-dominated and hence unusable.
| Quadrant | # 1 sec bins | Bins with >0 counts | Bins with >2000 counts | High rate bins dominated by noise | Noise dominated (total time) | Noise dominated (detector-on time) | Marked lightcurve |
|---|---|---|---|---|---|---|---|
| A | 8790 | 7272 | 5 | 5 | 0.06% | 0.07% | 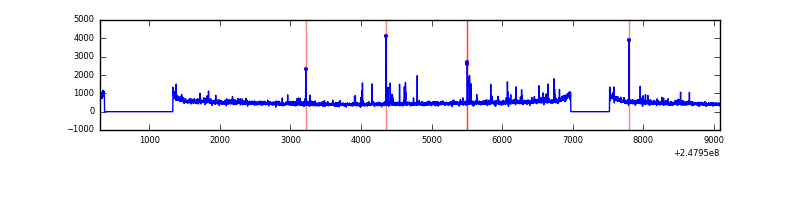 |
| B | 8790 | 7272 | 250 | 250 | 2.84% | 3.44% | 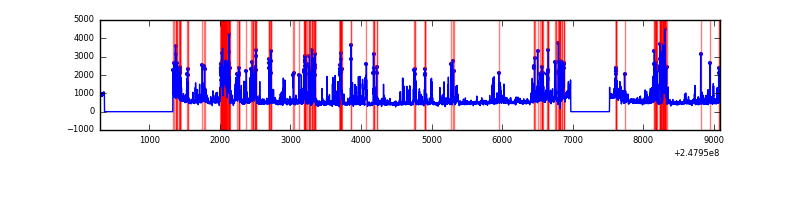 |
| C | 8790 | 7272 | 0 | 0 | 0.00% | 0.00% | 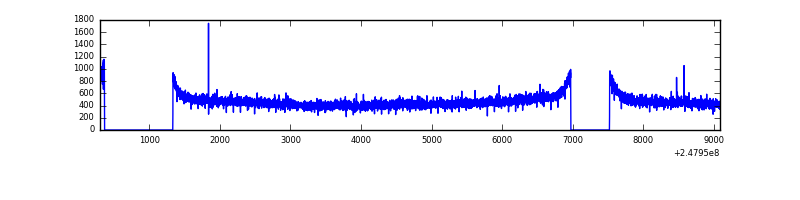 |
| D | 8790 | 7272 | 404 | 404 | 4.60% | 5.56% | 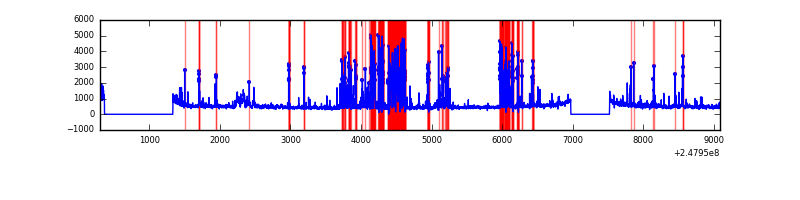 |
Top three noisy pixels from each quadrant. If the there are fewer than three noisy pixels in the level2.evt file, extra rows are filled as -1
| Pixel properties | Quadrant properties | ||||||
|---|---|---|---|---|---|---|---|
| Quadrant | DetID | PixID | Counts | Sigma | Mean | Median | Sigma |
| A | 8 | 5 | 99583 | 553.77 | 869 | 846 | 178.3 |
| A | 1 | 162 | 70036 | 388.06 | 869 | 846 | 178.3 |
| A | 1 | 178 | 41323 | 227.02 | 869 | 846 | 178.3 |
| B | 4 | 239 | 1511972 | 9255.18 | 852 | 831 | 163.3 |
| B | 11 | 51 | 188581 | 1149.9 | 852 | 831 | 163.3 |
| B | 15 | 85 | 100881 | 612.77 | 852 | 831 | 163.3 |
| C | 13 | 61 | 6228 | 26.28 | 866 | 870 | 203.9 |
| C | 14 | 234 | 3134 | 11.1 | 866 | 870 | 203.9 |
| C | 3 | 202 | 2113 | 6.1 | 866 | 870 | 203.9 |
| D | 10 | 253 | 1148340 | 5791.34 | 821 | 799 | 198.1 |
| D | 1 | 52 | 289980 | 1459.42 | 821 | 799 | 198.1 |
| D | 13 | 104 | 113754 | 570.05 | 821 | 799 | 198.1 |
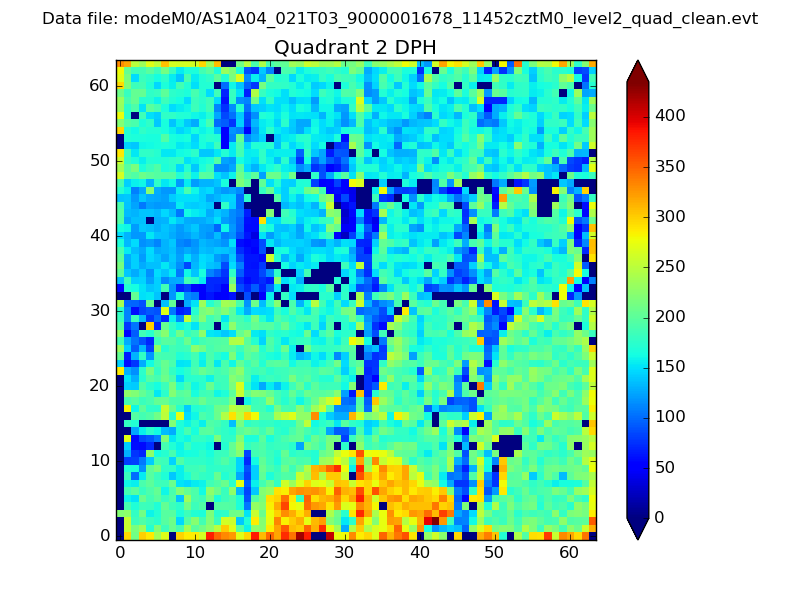
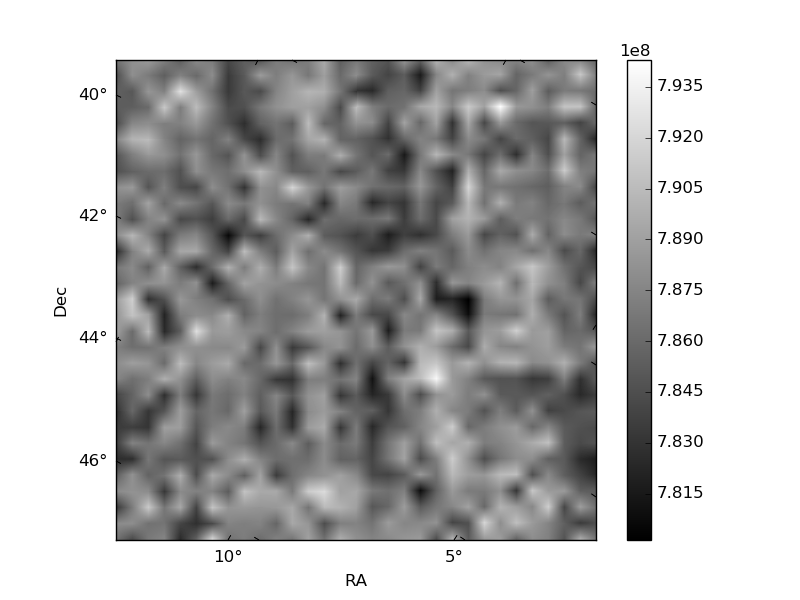
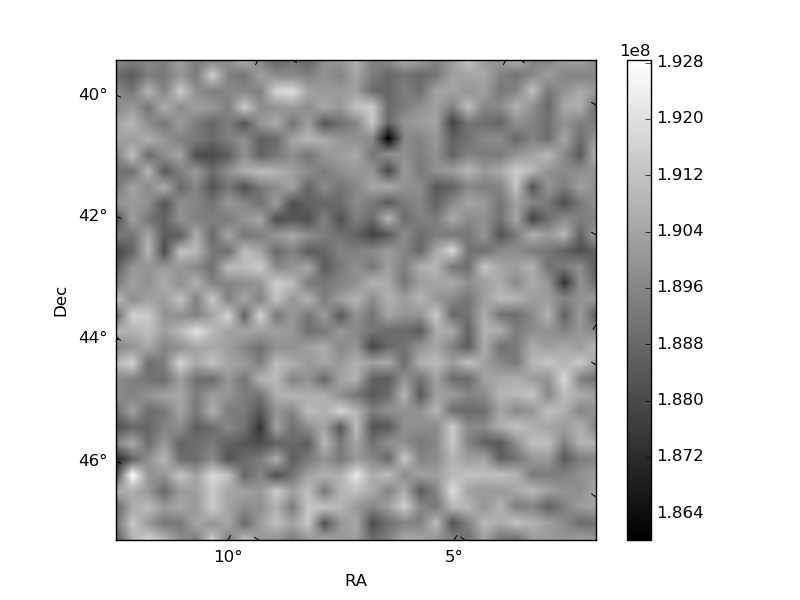
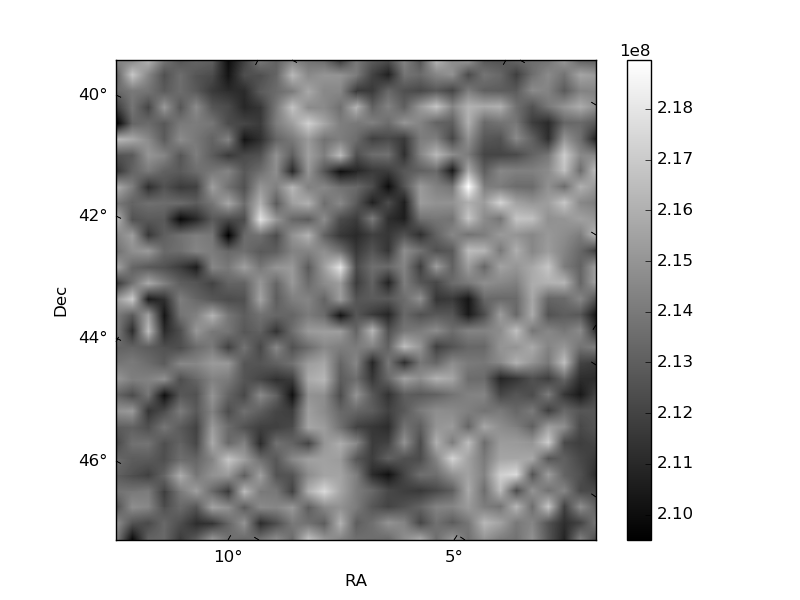
Histogram calculated using DETX and DETY for each event in the final _common_clean file
| Quadrant A | 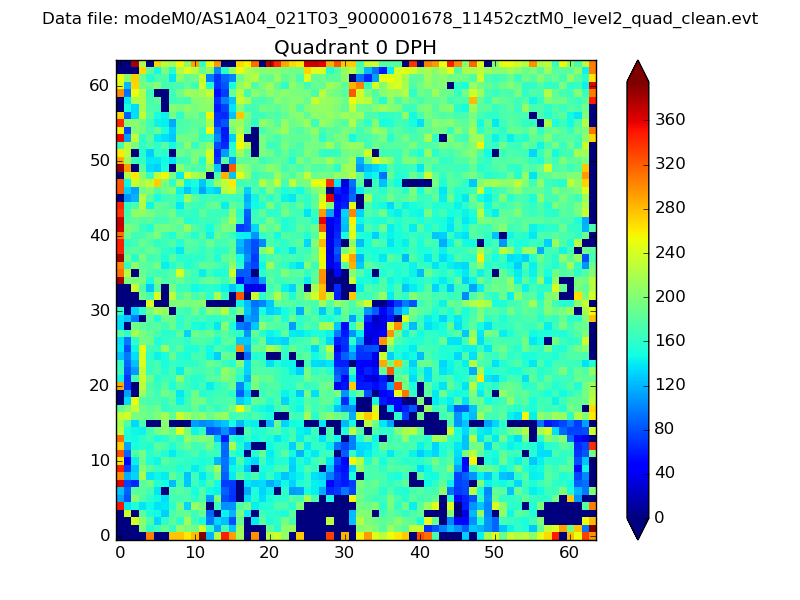 |
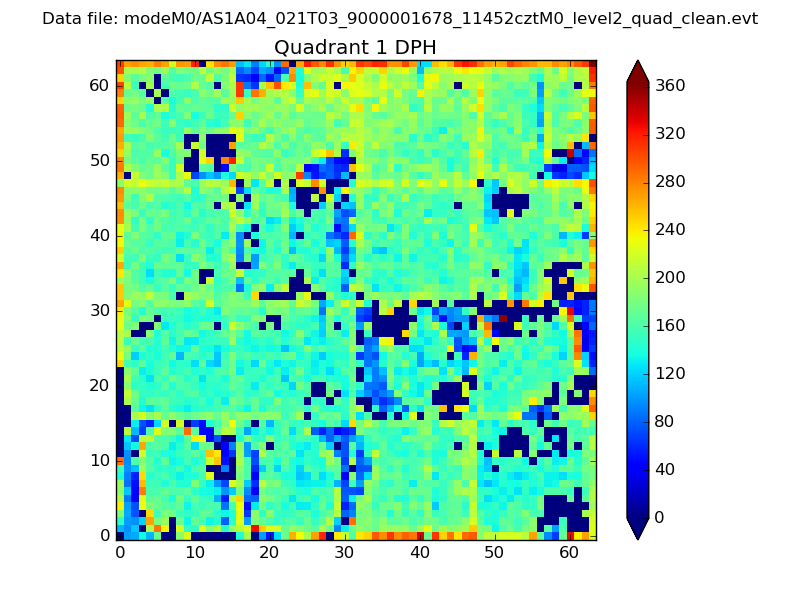 |
Quadrant B |
|---|---|---|---|
| Quadrant D | 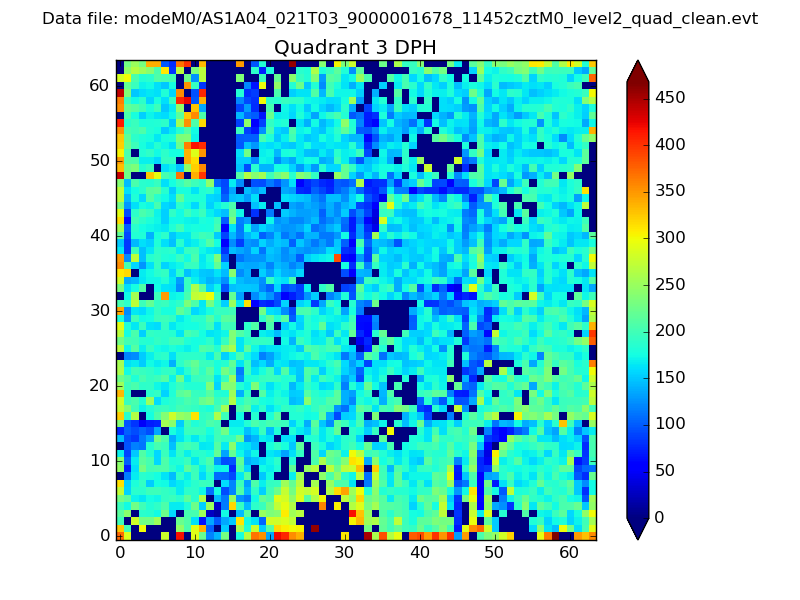 |
 |
Quadrant C |
| Plot type | Count rate plots | Images |
|---|---|---|
| Comparison with Poisson distribution Blue bars denote a histogram of data divided into 1 sec bins. Red curve is a Poisson curve with rate = median count rate of data. |
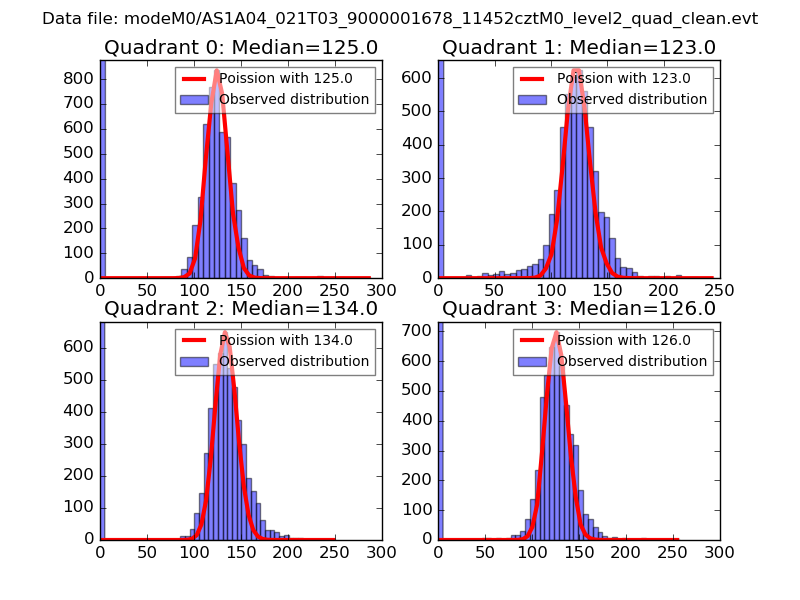 |
 |
| Quadrant-wise count rates Data is divided into 100 sec bins |
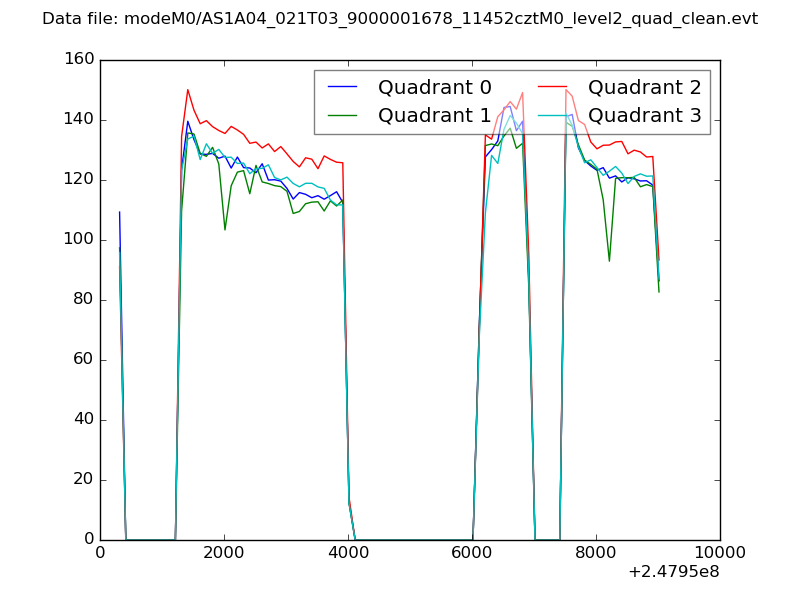 |
|
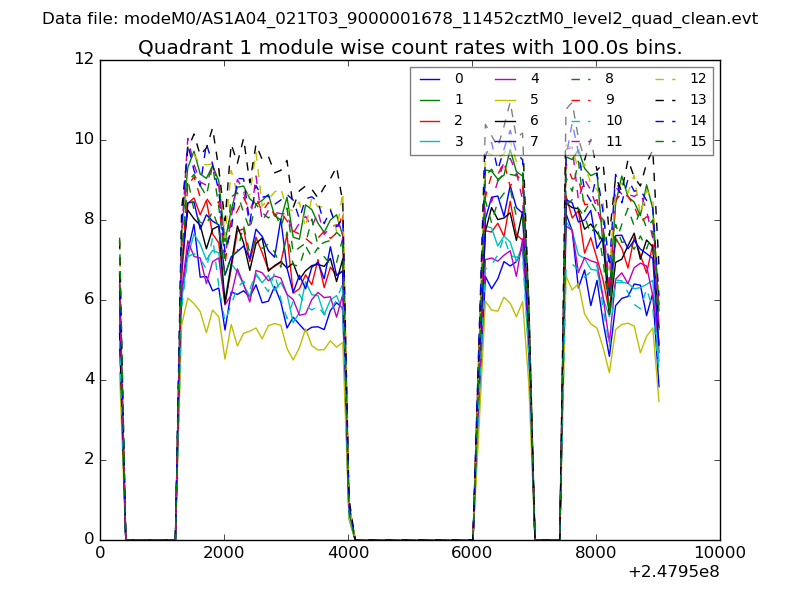
| Module-wise count rates for Quadrant A Data is divided into 100 sec bins |
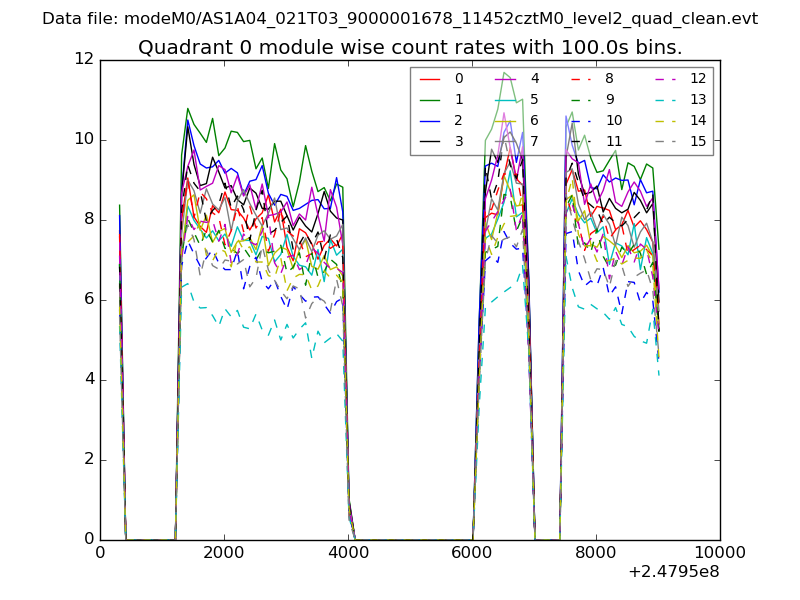 |
 |
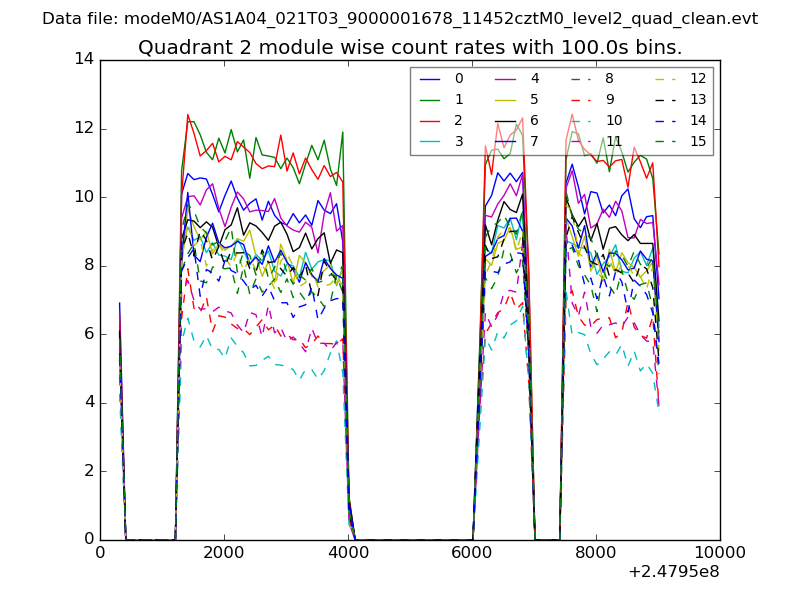
| Module-wise count rates for Quadrant B Data is divided into 100 sec bins |
 |
 |
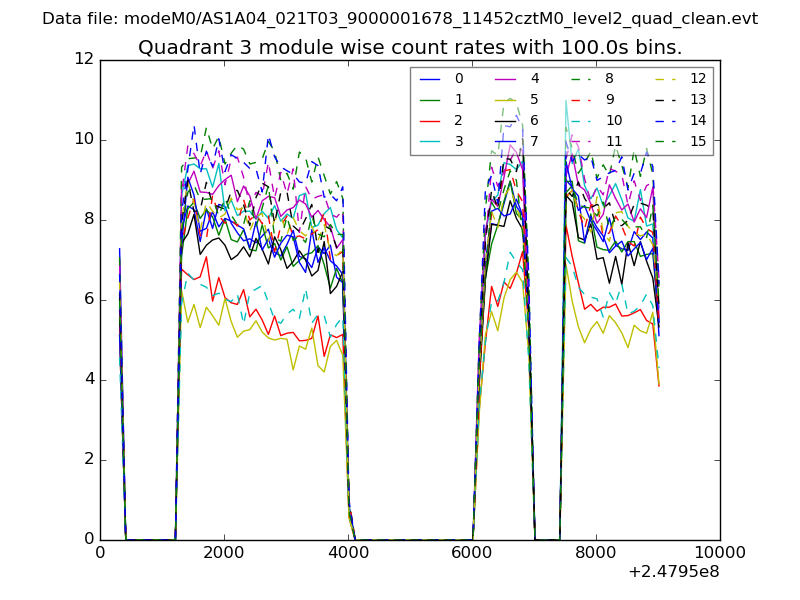
| Module-wise count rates for Quadrant C Data is divided into 100 sec bins |
 |
 |
| Module-wise count rates for Quadrant D Data is divided into 100 sec bins |
 |
 |
| Parameter | Plot |
|---|---|
| CZT HV Monitor | 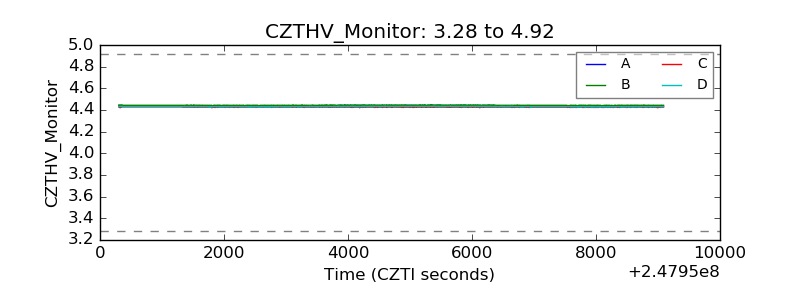 |
| D_VDD | 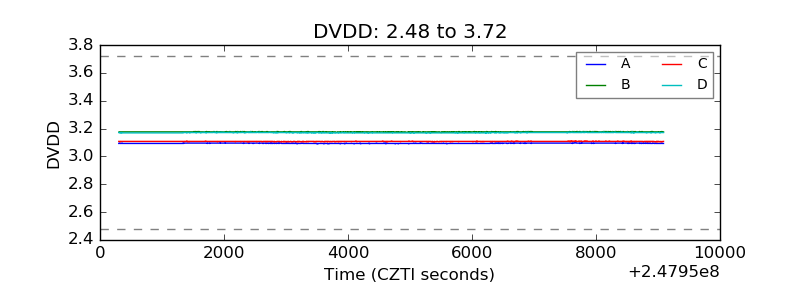 |
| Temperature 1 | 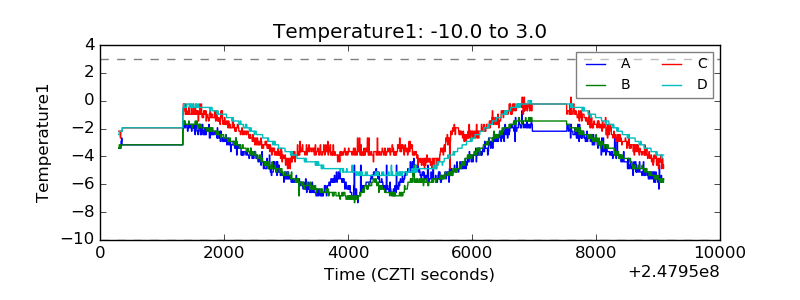 |
| Veto HV Monitor | 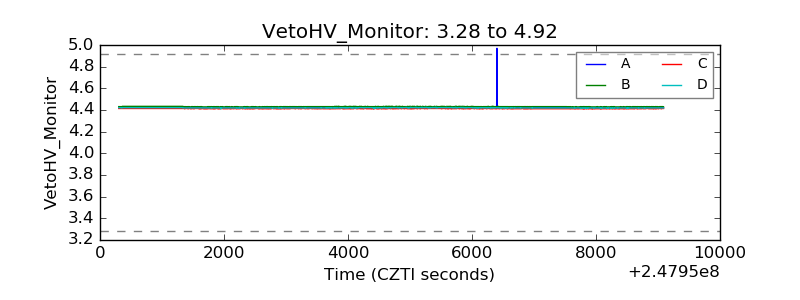 |
| Veto LLD | 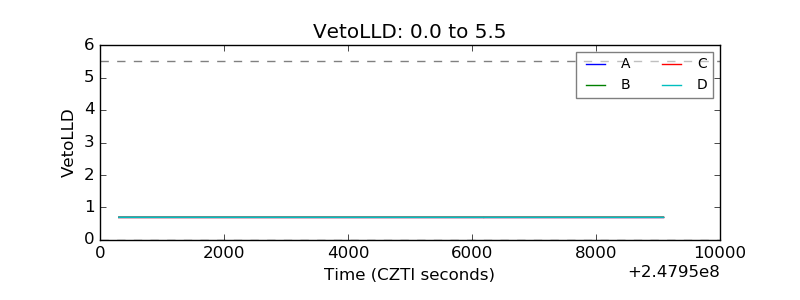 |
| Alpha Counter | 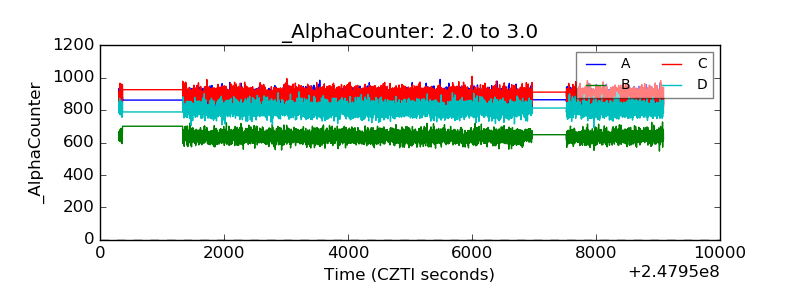 |
| _CPM_Rate | 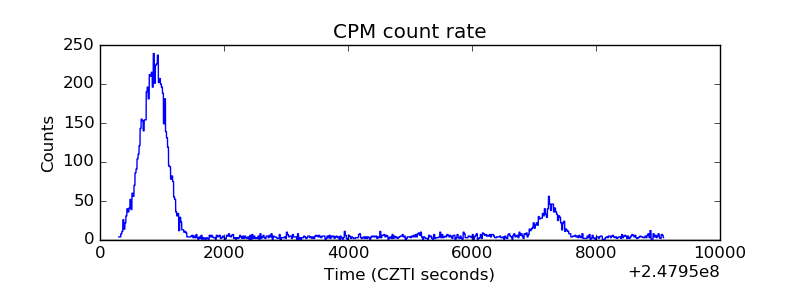 |
| CZT Counter | 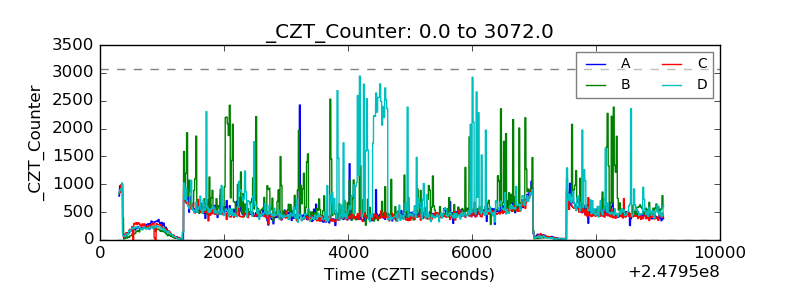 |
| +2.5 Volts monitor | 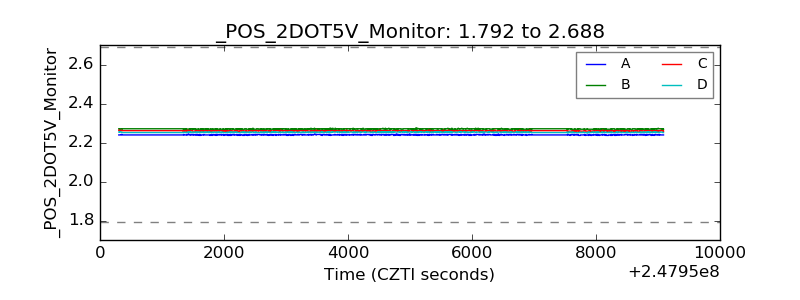 |
| +5 Volts monitor |  |
| _ROLL_ROT | 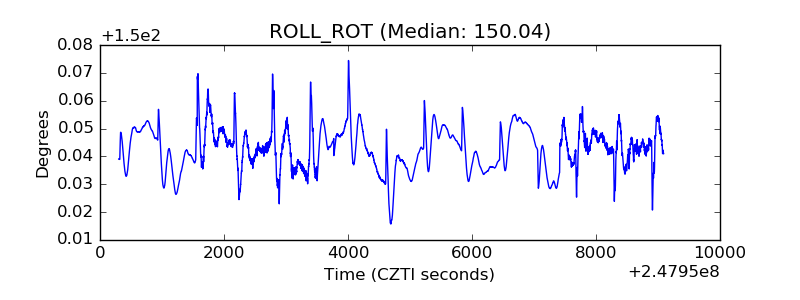 |
| _Roll_DEC | 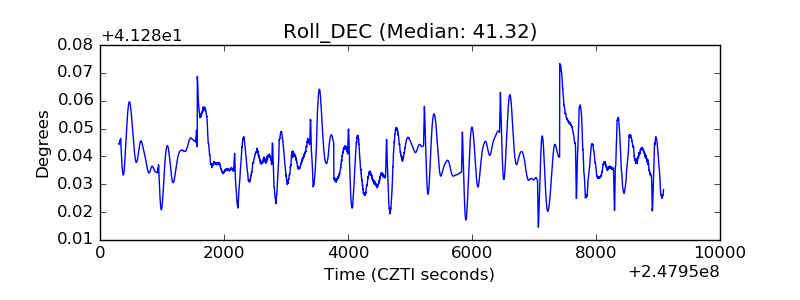 |
| _Roll_RA | 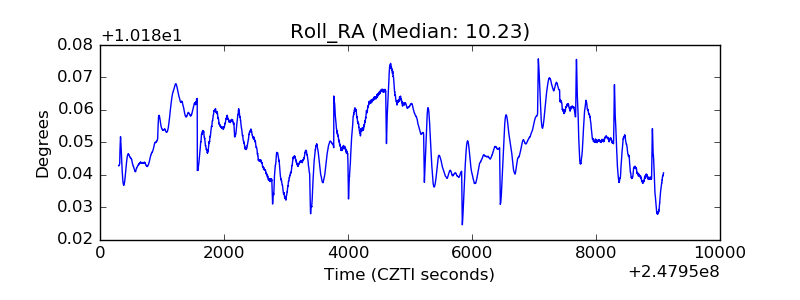 |
| Veto Counter | 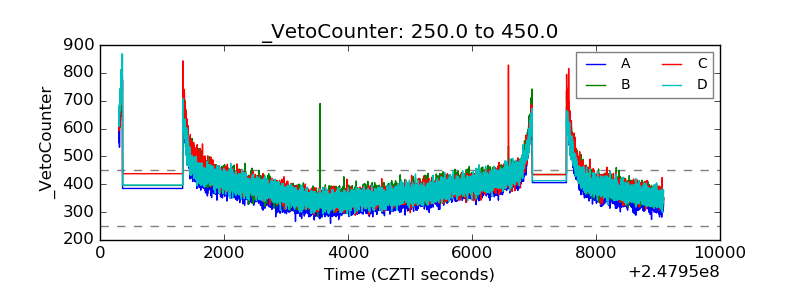 |