| Param | Original file | Final file |
|---|---|---|
| Filename | modeM0/AS1A04_021T03_9000001678_11454cztM0_level2.evt | modeM0/AS1A04_021T03_9000001678_11454cztM0_level2_quad_clean.evt |
| Size (bytes) | 745,413,120 | 114,805,440 |
| Size | 710.9 MB | 109.5 MB |
| Events in quadrant A | 3,951,212 | 726,491 |
| Events in quadrant B | 5,696,329 | 716,565 |
| Events in quadrant C | 3,781,057 | 783,717 |
| Events in quadrant D | 8,594,763 | 683,299 |
| Mode M0 | |||
|---|---|---|---|
| Quadrant | BADHDUFLAG | Total packets | Discarded packets |
| A | 0 | 17402 | 3 |
| B | 0 | 22474 | 2 |
| C | 0 | 16973 | 2 |
| D | 0 | 31083 | 2 |
| Mode M9 | |||
|---|---|---|---|
| Quadrant | BADHDUFLAG | Total packets | Discarded packets |
| A | 0 | 4 | 0 |
| B | 0 | 4 | 0 |
| C | 0 | 4 | 0 |
| D | 0 | 4 | 0 |
| Mode SS | |||
|---|---|---|---|
| Quadrant | BADHDUFLAG | Total packets | Discarded packets |
| A | 0 | 166 | 0 |
| B | 0 | 166 | 0 |
| C | 0 | 166 | 0 |
| D | 0 | 166 | 0 |
| Quadrant | Total seconds | Saturated seconds | Saturation percentage |
|---|---|---|---|
| A | 8154 | 81 | 0.993377% |
| B | 8154 | 535 | 6.561197% |
| C | 8154 | 36 | 0.441501% |
| D | 8154 | 1581 | 19.389257% |
Noise dominated data is calculated using 1-second bins in cleaned event files. If a bin has >2000 counts, and if more than 50% of those come from <1% of pixels, then it is considered to be noise-dominated and hence unusable.
| Quadrant | # 1 sec bins | Bins with >0 counts | Bins with >2000 counts | High rate bins dominated by noise | Noise dominated (total time) | Noise dominated (detector-on time) | Marked lightcurve |
|---|---|---|---|---|---|---|---|
| A | 8505 | 8157 | 4 | 4 | 0.05% | 0.05% | 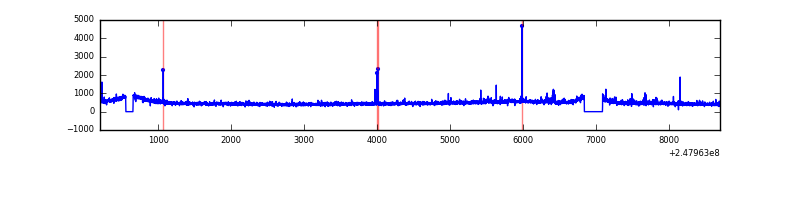 |
| B | 8505 | 8157 | 217 | 217 | 2.55% | 2.66% | 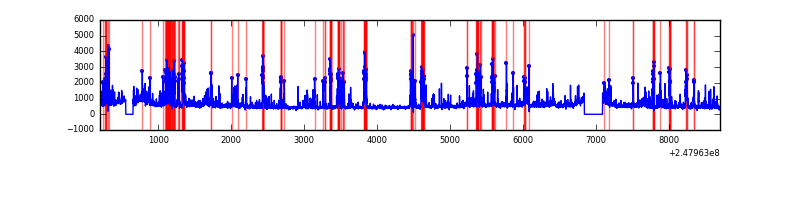 |
| C | 8505 | 8157 | 0 | 0 | 0.00% | 0.00% | 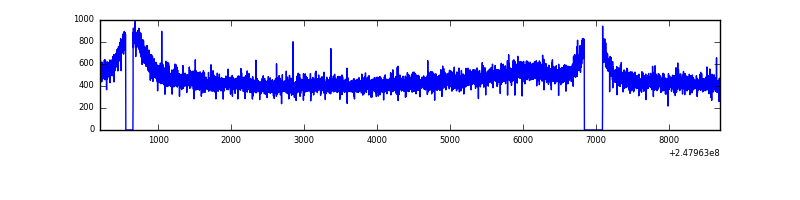 |
| D | 8505 | 8157 | 1231 | 1231 | 14.47% | 15.09% | 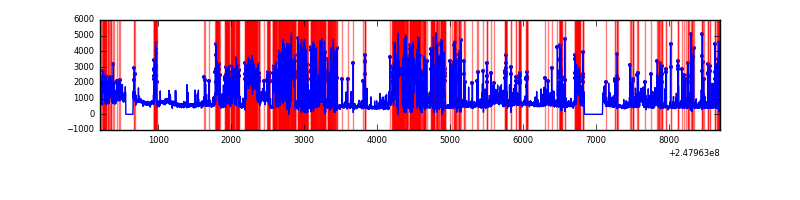 |
Top three noisy pixels from each quadrant. If the there are fewer than three noisy pixels in the level2.evt file, extra rows are filled as -1
| Pixel properties | Quadrant properties | ||||||
|---|---|---|---|---|---|---|---|
| Quadrant | DetID | PixID | Counts | Sigma | Mean | Median | Sigma |
| A | 1 | 162 | 61212 | 306.03 | 963 | 940 | 196.9 |
| A | 1 | 178 | 35094 | 173.42 | 963 | 940 | 196.9 |
| A | 9 | 143 | 33314 | 164.38 | 963 | 940 | 196.9 |
| B | 4 | 239 | 1486372 | 8176.37 | 952 | 924 | 181.7 |
| B | 11 | 51 | 233981 | 1282.82 | 952 | 924 | 181.7 |
| B | 15 | 204 | 74659 | 405.86 | 952 | 924 | 181.7 |
| C | 8 | 128 | 9797 | 39.2 | 965 | 970 | 225.2 |
| C | 13 | 61 | 7103 | 27.24 | 965 | 970 | 225.2 |
| C | 8 | 112 | 6189 | 23.18 | 965 | 970 | 225.2 |
| D | 1 | 52 | 2635578 | 12611.84 | 863 | 836 | 208.9 |
| D | 10 | 253 | 1879442 | 8992.41 | 863 | 836 | 208.9 |
| D | 8 | 195 | 346110 | 1652.74 | 863 | 836 | 208.9 |
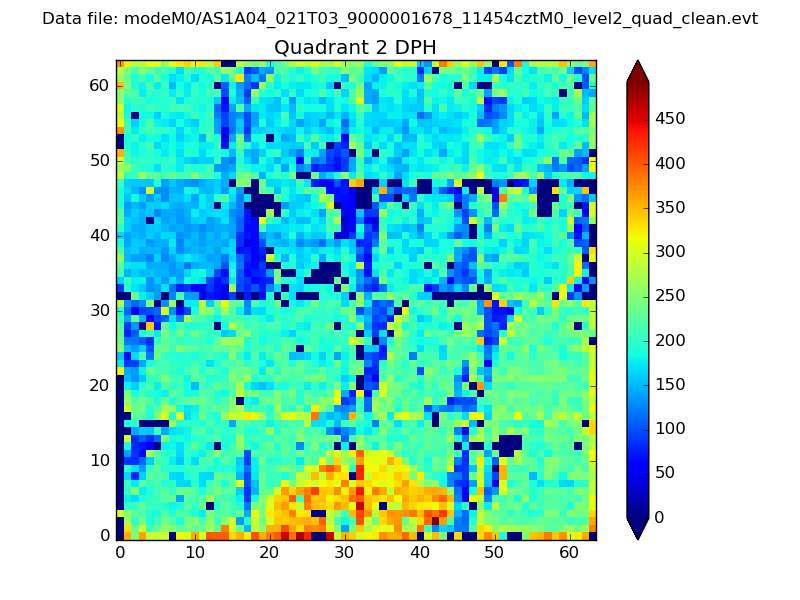
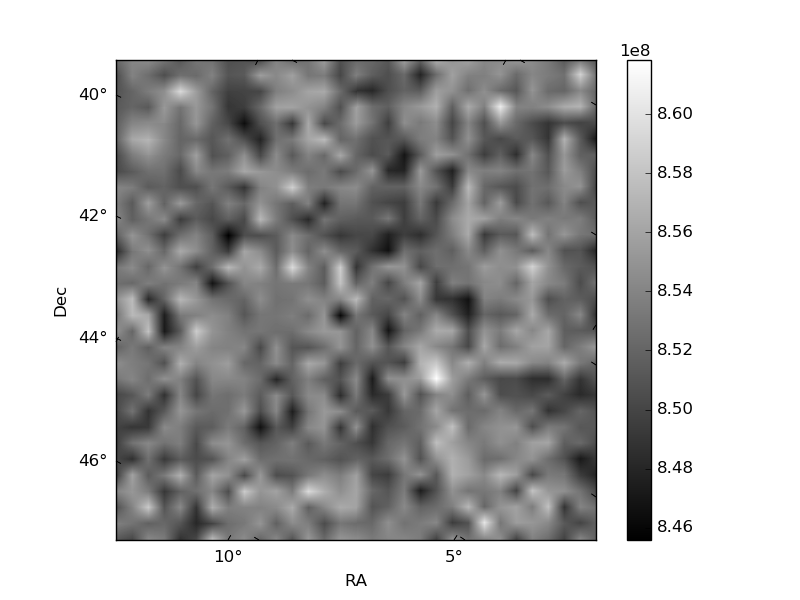
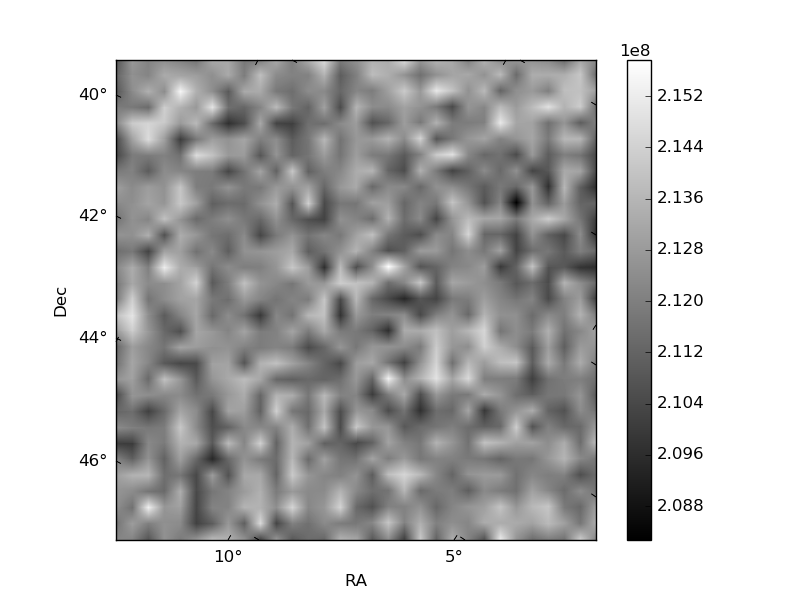
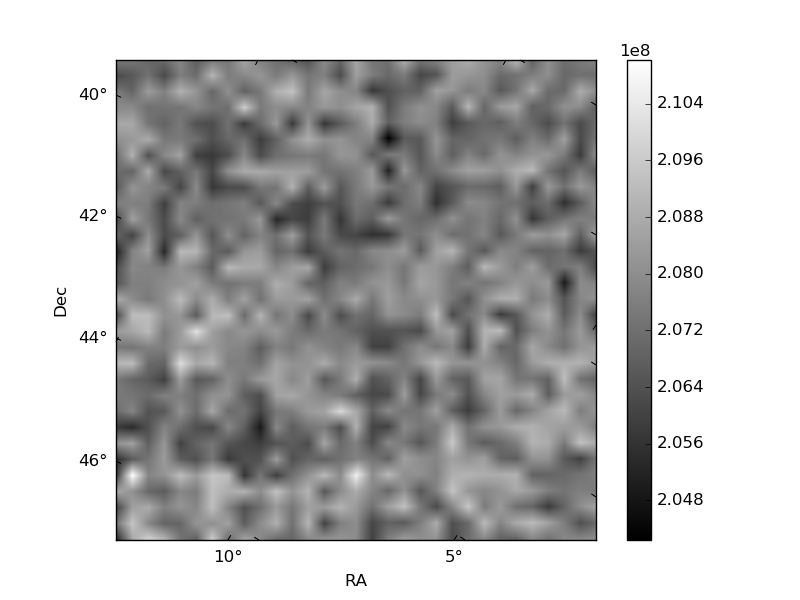
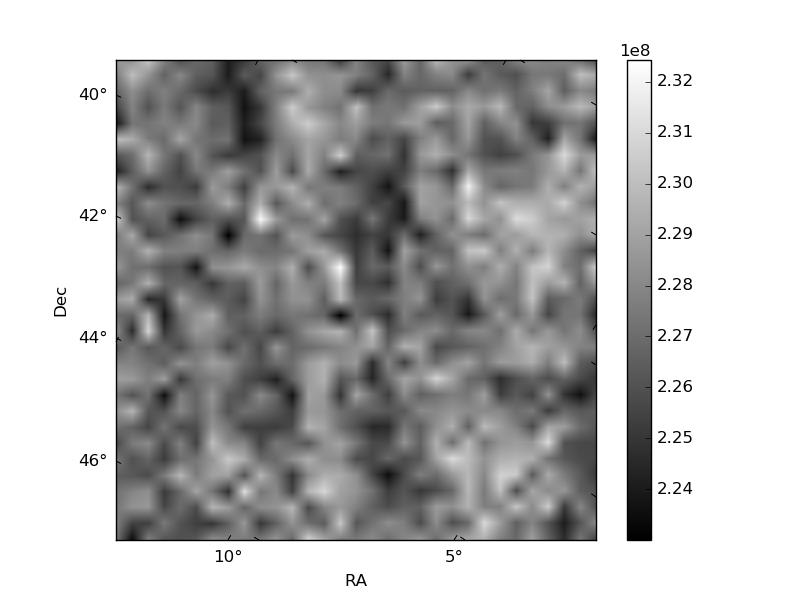
Histogram calculated using DETX and DETY for each event in the final _common_clean file
| Quadrant A | 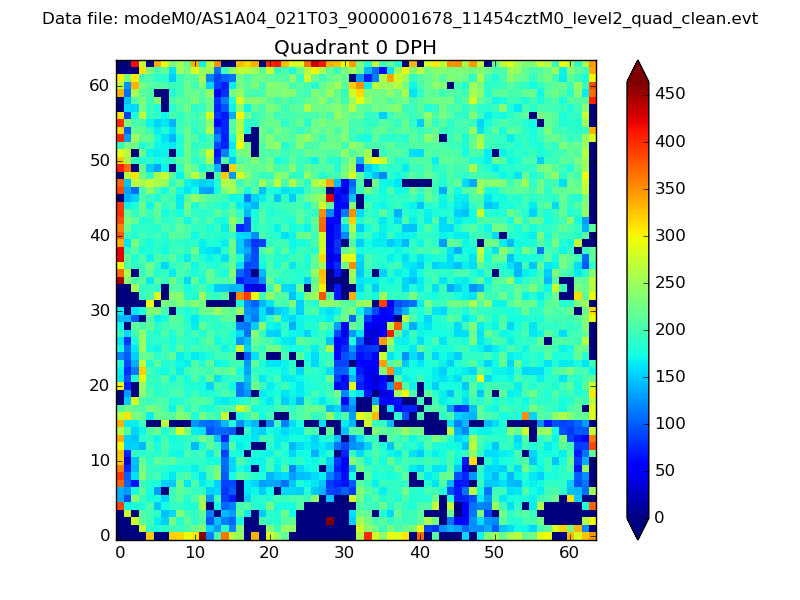 |
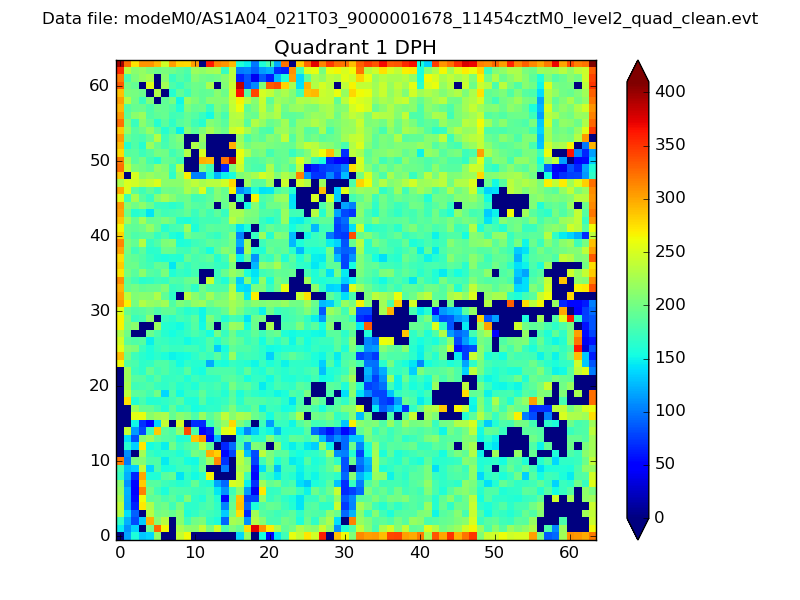 |
Quadrant B |
|---|---|---|---|
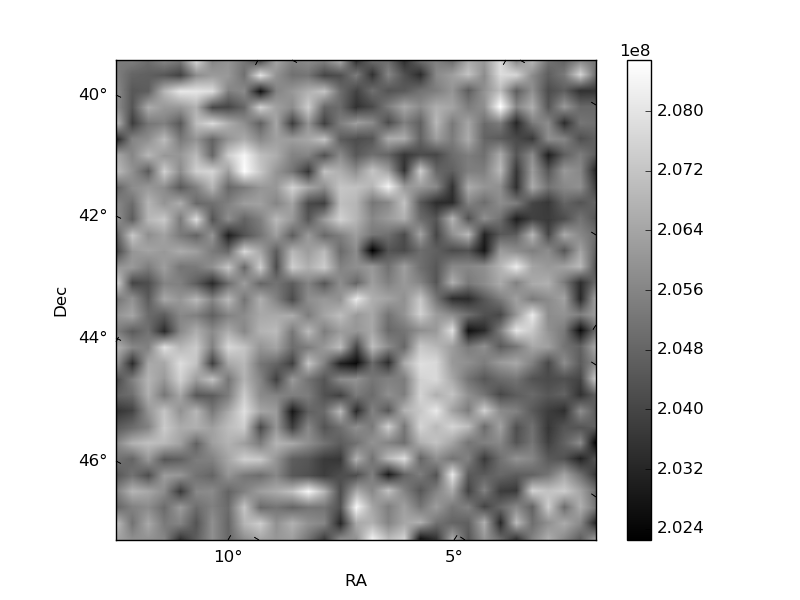
| Quadrant D | 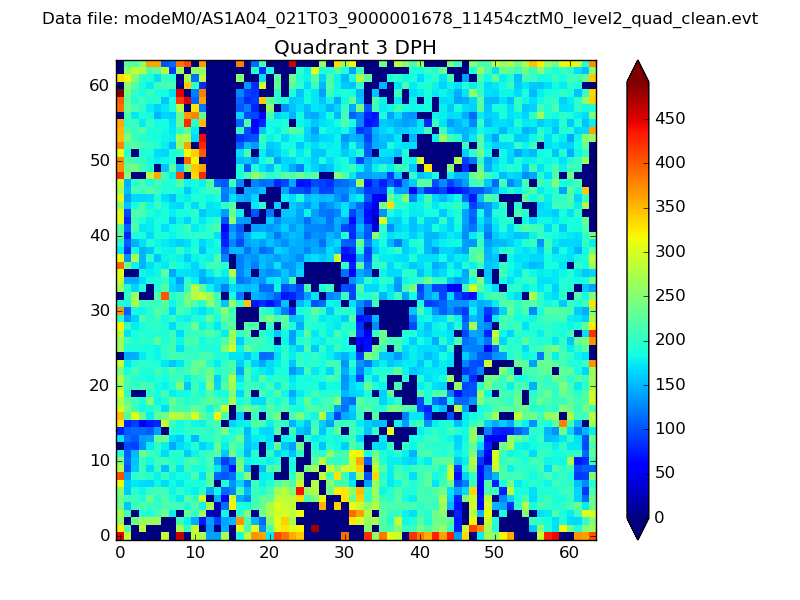 |
 |
Quadrant C |
| Plot type | Count rate plots | Images |
|---|---|---|
| Comparison with Poisson distribution Blue bars denote a histogram of data divided into 1 sec bins. Red curve is a Poisson curve with rate = median count rate of data. |
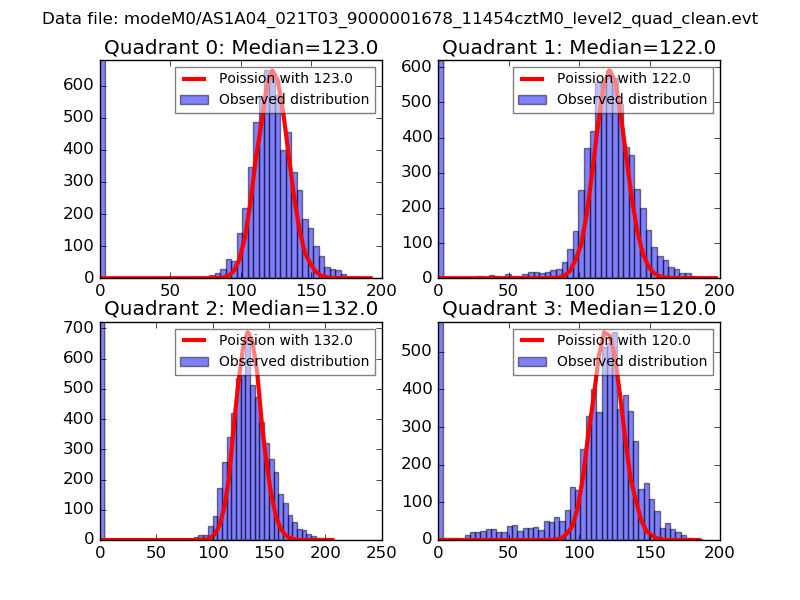 |
 |
| Quadrant-wise count rates Data is divided into 100 sec bins |
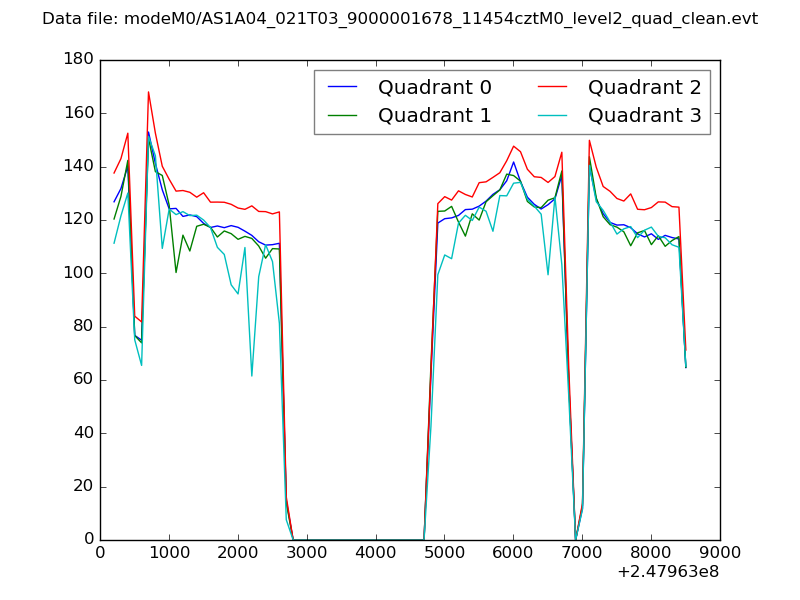 |
|
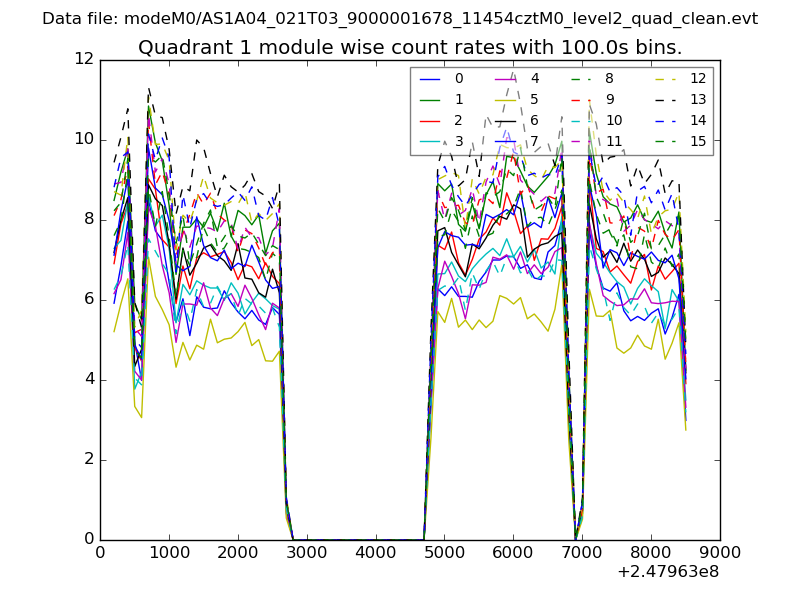
| Module-wise count rates for Quadrant A Data is divided into 100 sec bins |
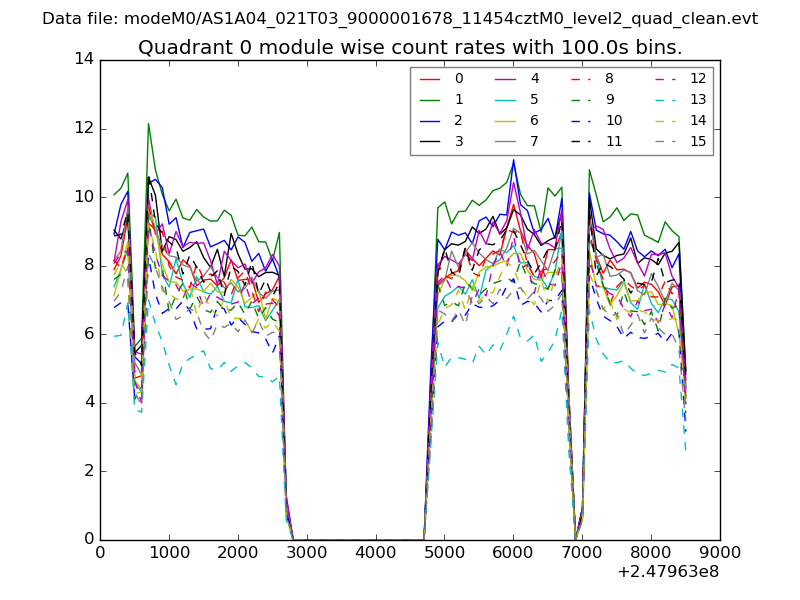 |
 |
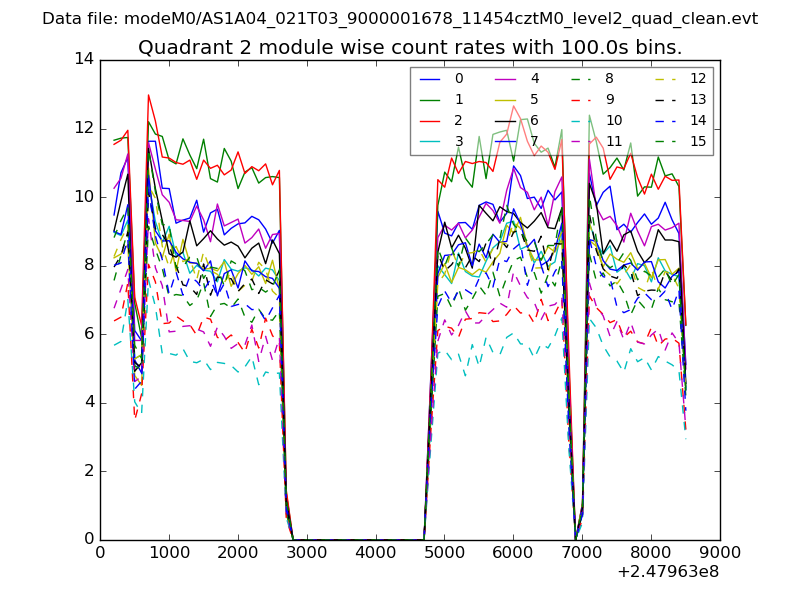
| Module-wise count rates for Quadrant B Data is divided into 100 sec bins |
 |
 |
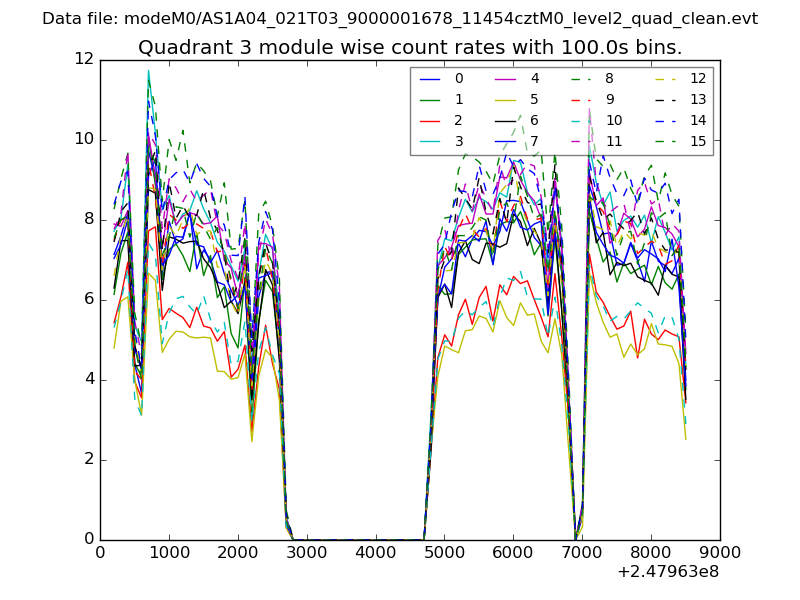
| Module-wise count rates for Quadrant C Data is divided into 100 sec bins |
 |
 |
| Module-wise count rates for Quadrant D Data is divided into 100 sec bins |
 |
 |
| Parameter | Plot |
|---|---|
| CZT HV Monitor | 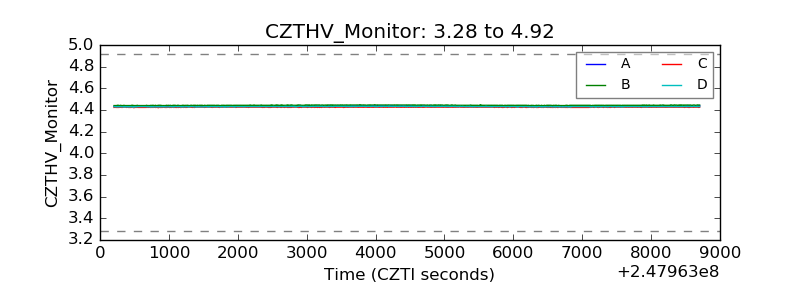 |
| D_VDD | 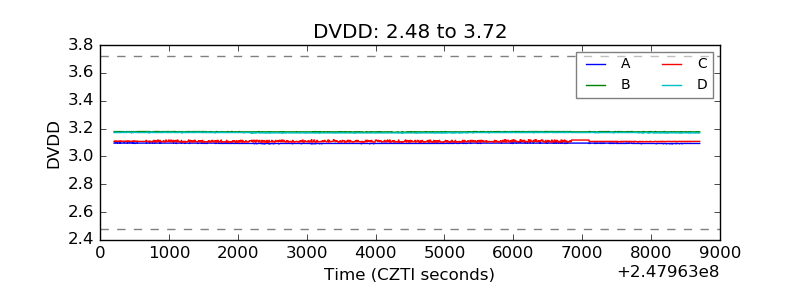 |
| Temperature 1 | 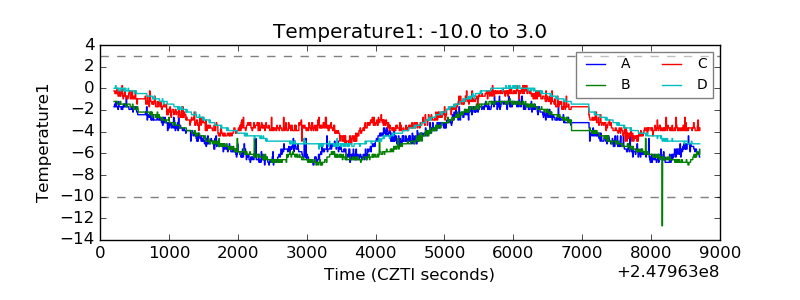 |
| Veto HV Monitor | 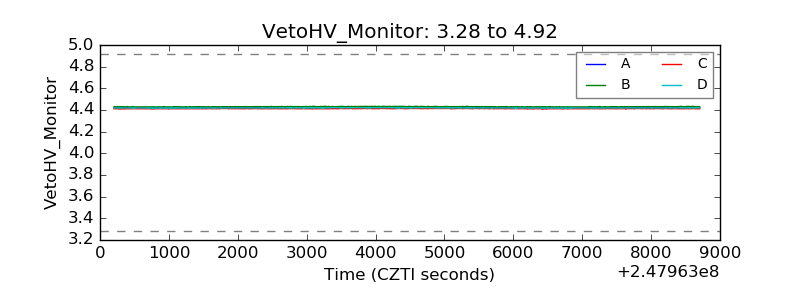 |
| Veto LLD | 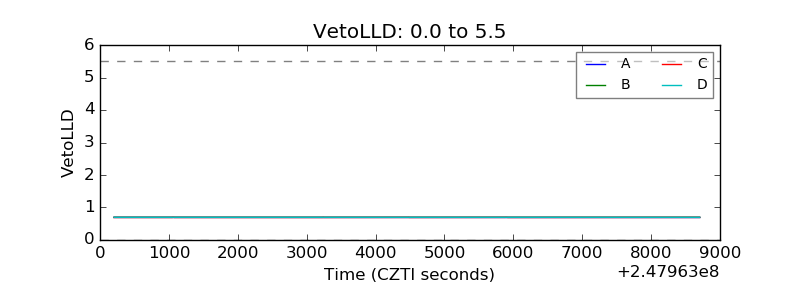 |
| Alpha Counter | 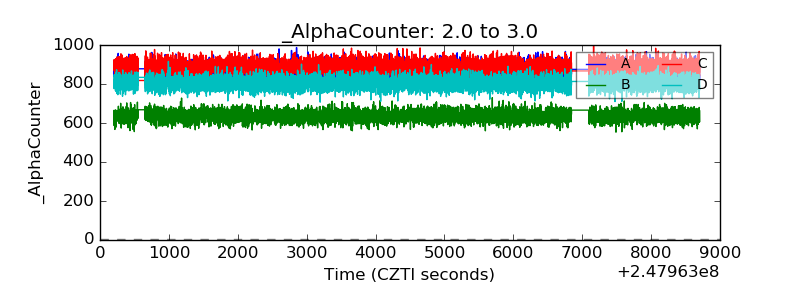 |
| _CPM_Rate | 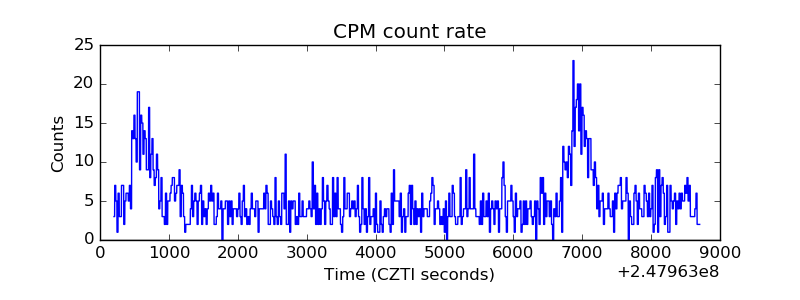 |
| CZT Counter | 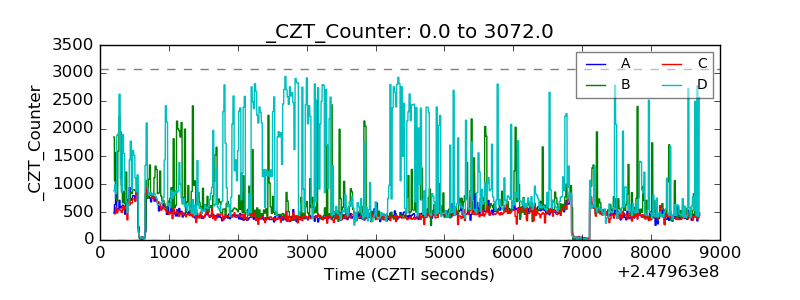 |
| +2.5 Volts monitor | 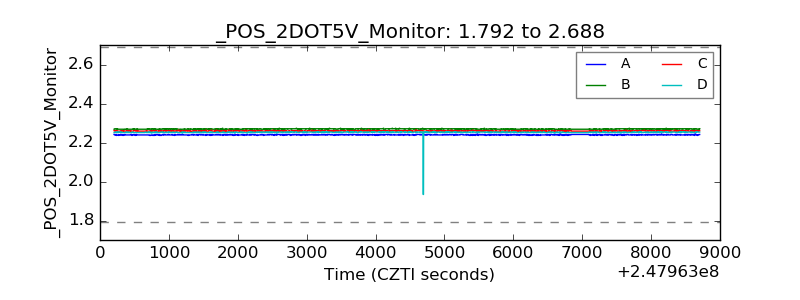 |
| +5 Volts monitor | 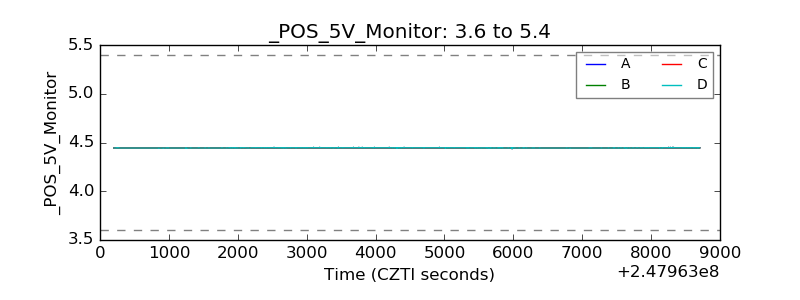 |
| _ROLL_ROT | 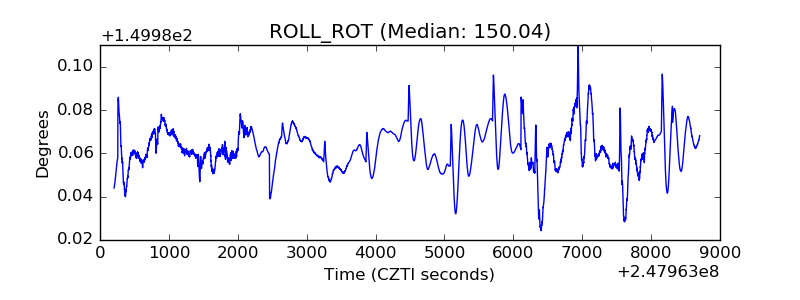 |
| _Roll_DEC | 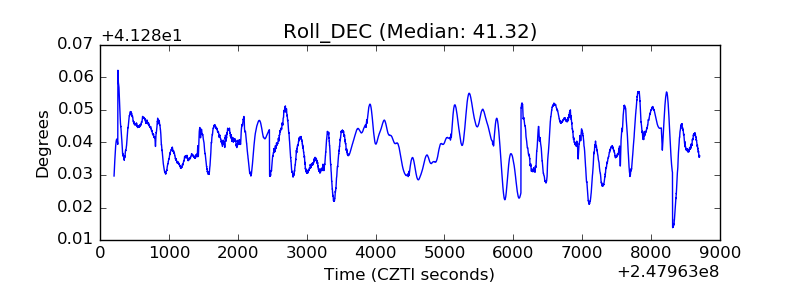 |
| _Roll_RA |  |
| Veto Counter | 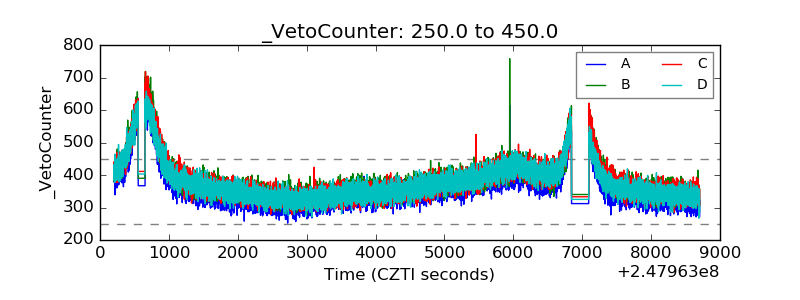 |