| Param | Original file | Final file |
|---|---|---|
| Filename | modeM0/AS1A04_021T03_9000001678_11460cztM0_level2.evt | modeM0/AS1A04_021T03_9000001678_11460cztM0_level2_quad_clean.evt |
| Size (bytes) | 546,670,080 | 83,306,880 |
| Size | 521.3 MB | 79.4 MB |
| Events in quadrant A | 3,590,193 | 501,675 |
| Events in quadrant B | 4,915,637 | 492,357 |
| Events in quadrant C | 3,352,178 | 538,028 |
| Events in quadrant D | 4,213,742 | 493,624 |
| Mode M0 | |||
|---|---|---|---|
| Quadrant | BADHDUFLAG | Total packets | Discarded packets |
| A | 0 | 15098 | 3 |
| B | 0 | 19204 | 2 |
| C | 0 | 14671 | 2 |
| D | 0 | 17216 | 2 |
| Mode M9 | |||
|---|---|---|---|
| Quadrant | BADHDUFLAG | Total packets | Discarded packets |
| A | 0 | 19 | 0 |
| B | 0 | 19 | 0 |
| C | 0 | 19 | 0 |
| D | 0 | 19 | 0 |
| Mode SS | |||
|---|---|---|---|
| Quadrant | BADHDUFLAG | Total packets | Discarded packets |
| A | 0 | 148 | 0 |
| B | 0 | 148 | 0 |
| C | 0 | 148 | 0 |
| D | 0 | 148 | 0 |
| Quadrant | Total seconds | Saturated seconds | Saturation percentage |
|---|---|---|---|
| A | 7129 | 132 | 1.851592% |
| B | 7129 | 458 | 6.424463% |
| C | 7129 | 93 | 1.304531% |
| D | 7129 | 346 | 4.853416% |
Noise dominated data is calculated using 1-second bins in cleaned event files. If a bin has >2000 counts, and if more than 50% of those come from <1% of pixels, then it is considered to be noise-dominated and hence unusable.
| Quadrant | # 1 sec bins | Bins with >0 counts | Bins with >2000 counts | High rate bins dominated by noise | Noise dominated (total time) | Noise dominated (detector-on time) | Marked lightcurve |
|---|---|---|---|---|---|---|---|
| A | 9060 | 7132 | 2 | 2 | 0.02% | 0.03% | 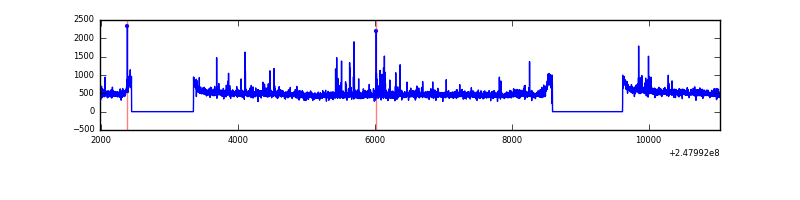 |
| B | 9060 | 7132 | 183 | 183 | 2.02% | 2.57% | 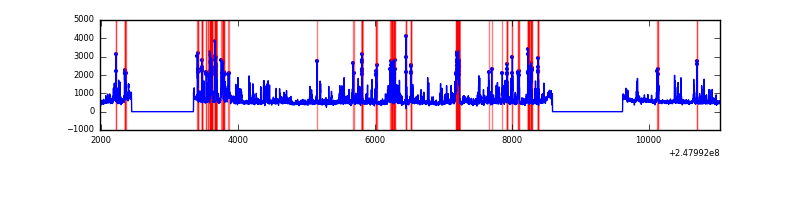 |
| C | 9060 | 7132 | 1 | 1 | 0.01% | 0.01% | 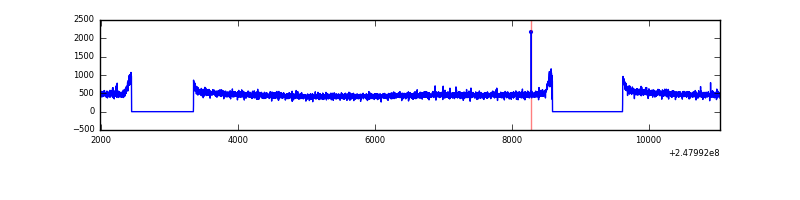 |
| D | 9060 | 7132 | 190 | 190 | 2.10% | 2.66% | 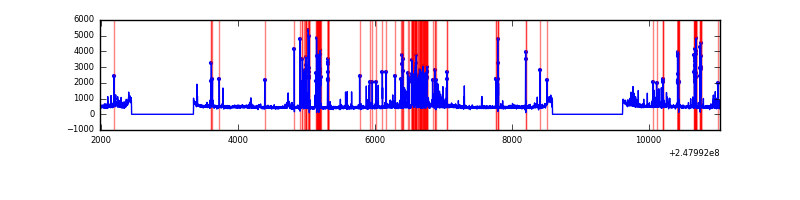 |
Top three noisy pixels from each quadrant. If the there are fewer than three noisy pixels in the level2.evt file, extra rows are filled as -1
| Pixel properties | Quadrant properties | ||||||
|---|---|---|---|---|---|---|---|
| Quadrant | DetID | PixID | Counts | Sigma | Mean | Median | Sigma |
| A | 8 | 5 | 47224 | 258.75 | 881 | 861 | 179.2 |
| A | 1 | 162 | 39539 | 215.86 | 881 | 861 | 179.2 |
| A | 9 | 143 | 36567 | 199.27 | 881 | 861 | 179.2 |
| B | 4 | 239 | 1091446 | 6524.06 | 861 | 840 | 167.2 |
| B | 15 | 204 | 166446 | 990.66 | 861 | 840 | 167.2 |
| B | 11 | 51 | 98345 | 583.28 | 861 | 840 | 167.2 |
| C | 13 | 61 | 6425 | 27.97 | 859 | 863 | 198.8 |
| C | 14 | 234 | 4436 | 17.97 | 859 | 863 | 198.8 |
| C | 3 | 202 | 2103 | 6.23 | 859 | 863 | 198.8 |
| D | 1 | 52 | 475529 | 2348.57 | 843 | 818 | 202.1 |
| D | 10 | 253 | 289306 | 1427.26 | 843 | 818 | 202.1 |
| D | 2 | 14 | 81361 | 398.48 | 843 | 818 | 202.1 |
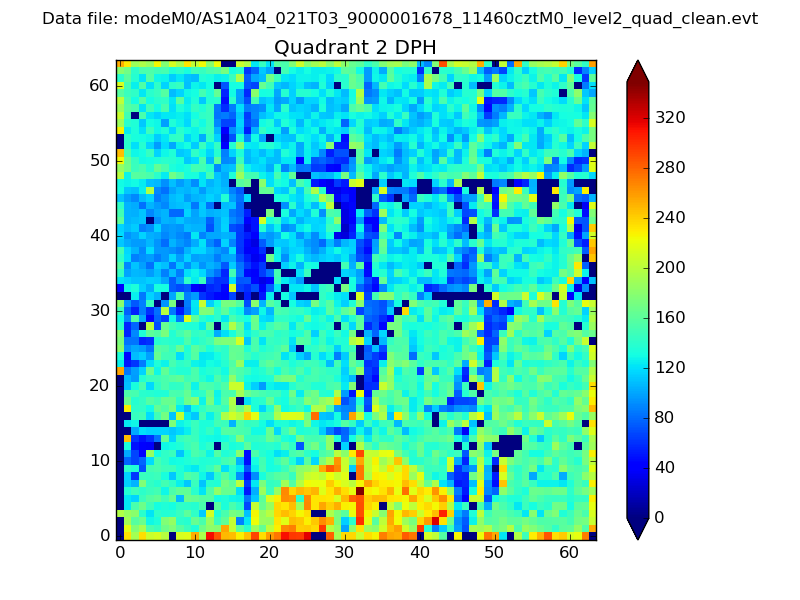
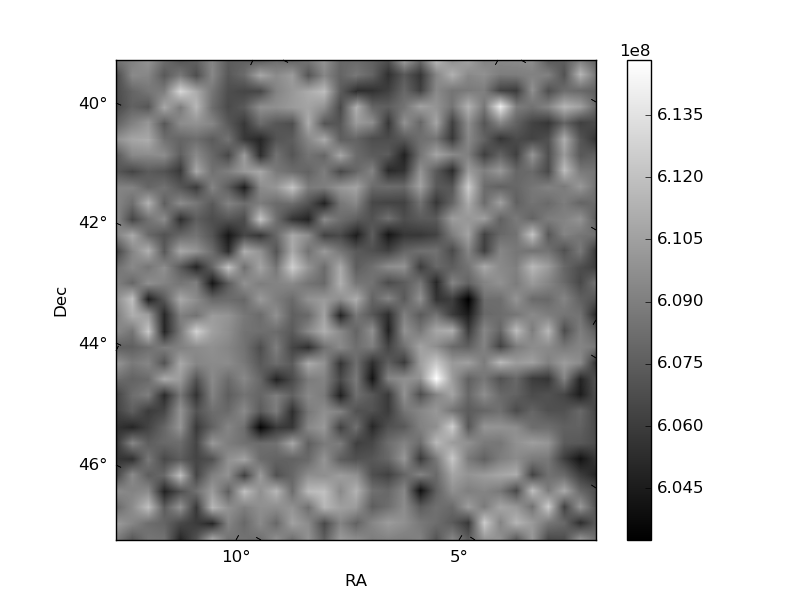
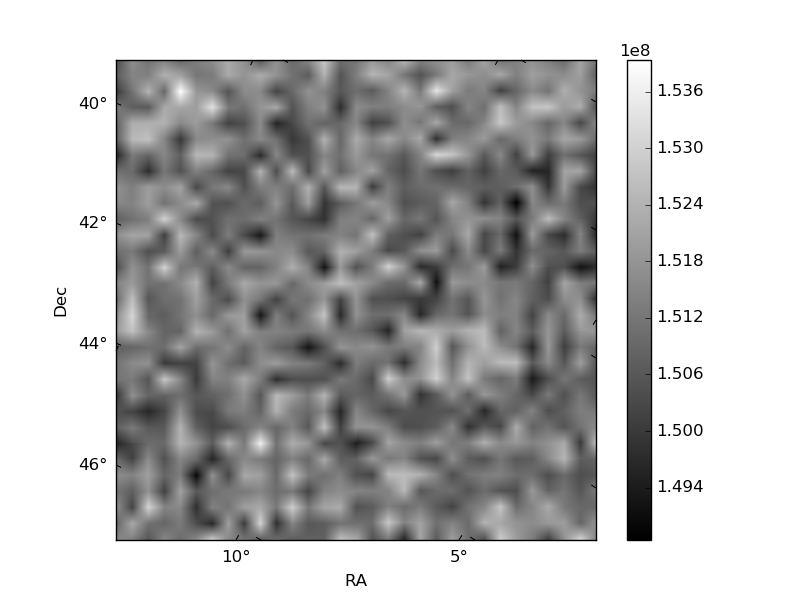
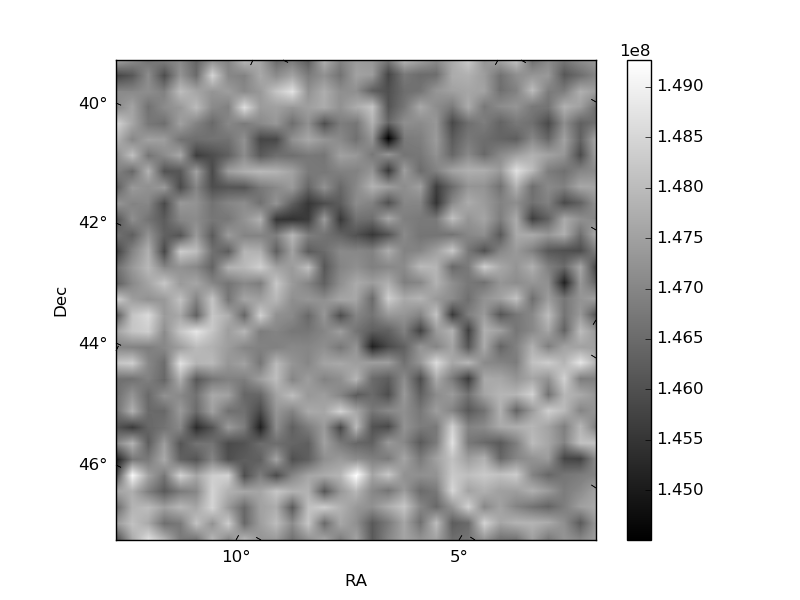
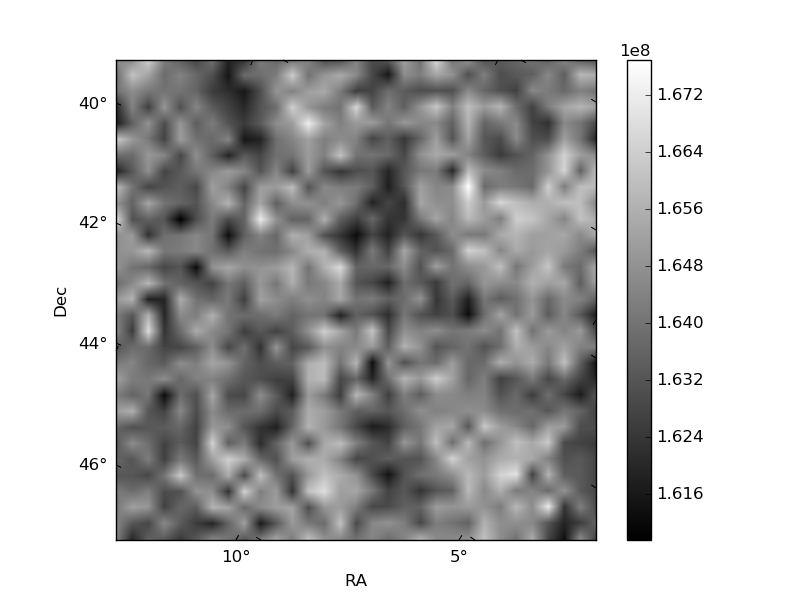
Histogram calculated using DETX and DETY for each event in the final _common_clean file
| Quadrant A | 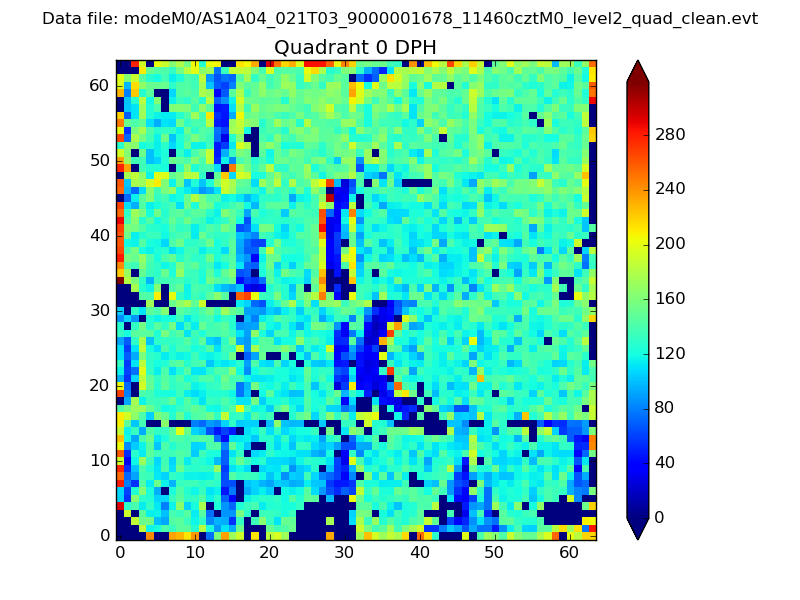 |
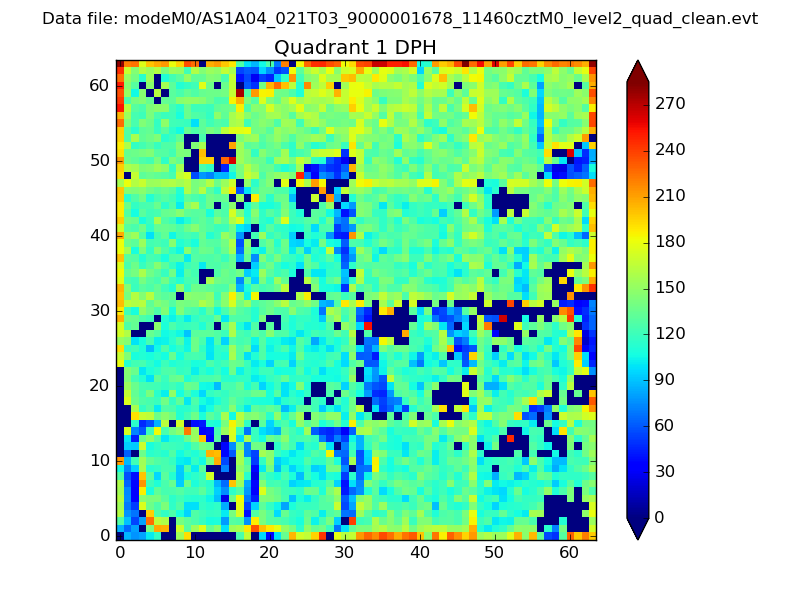 |
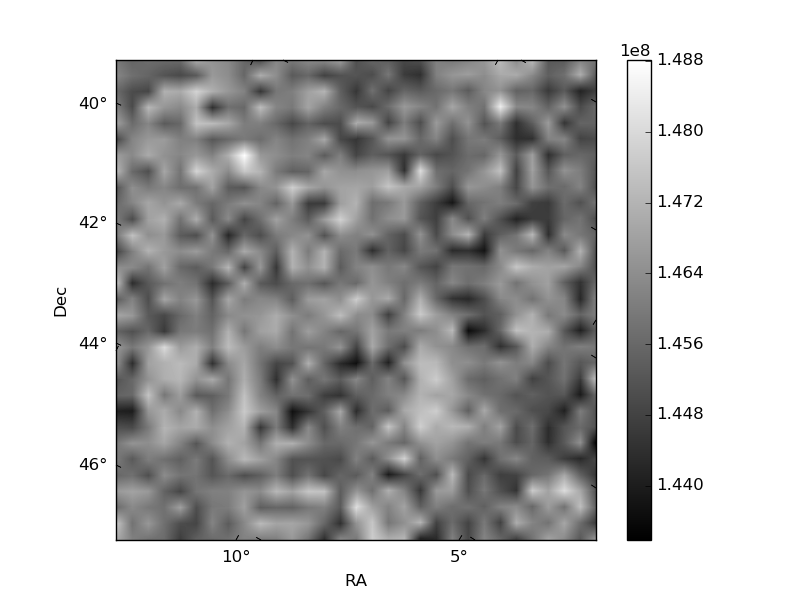
Quadrant B |
|---|---|---|---|
| Quadrant D | 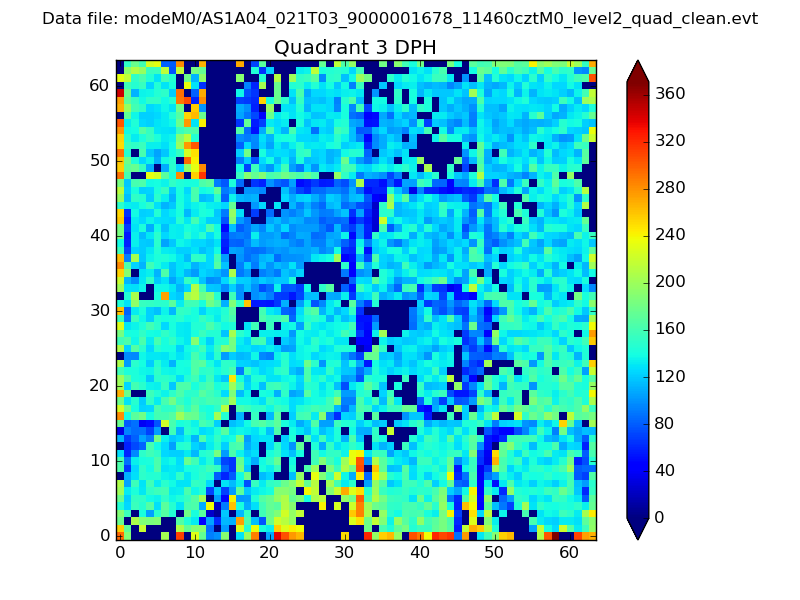 |
 |
Quadrant C |
| Plot type | Count rate plots | Images |
|---|---|---|
| Comparison with Poisson distribution Blue bars denote a histogram of data divided into 1 sec bins. Red curve is a Poisson curve with rate = median count rate of data. |
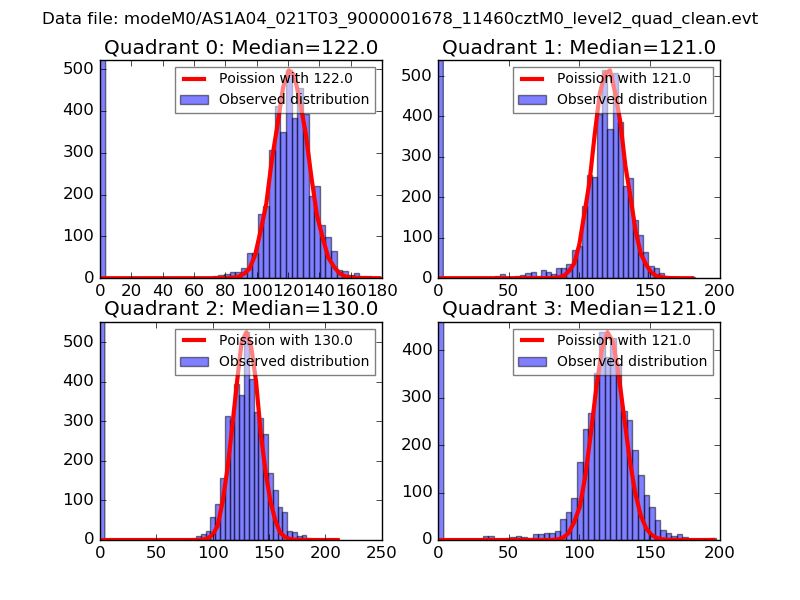 |
 |
| Quadrant-wise count rates Data is divided into 100 sec bins |
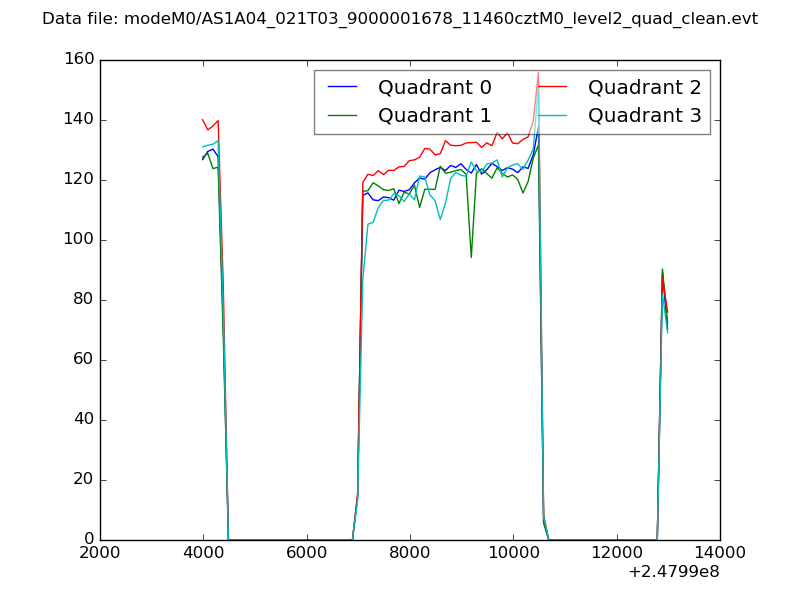 |
|
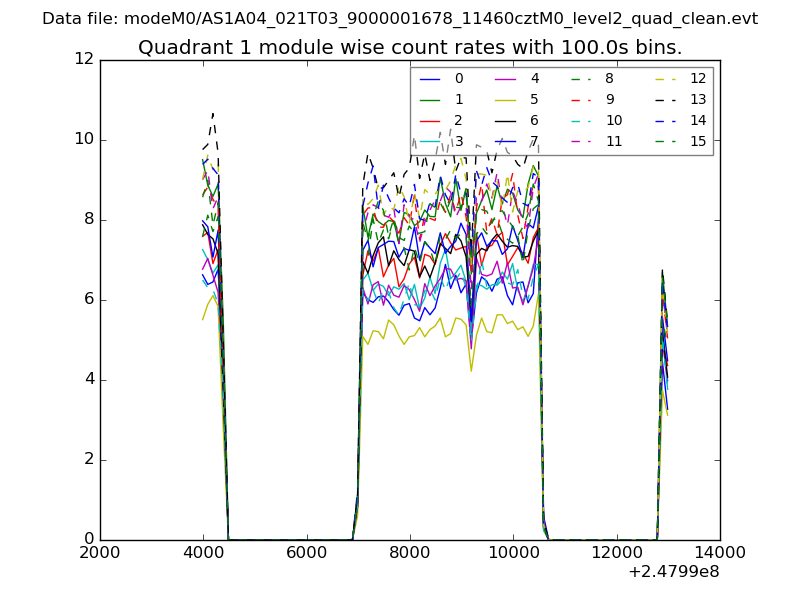
| Module-wise count rates for Quadrant A Data is divided into 100 sec bins |
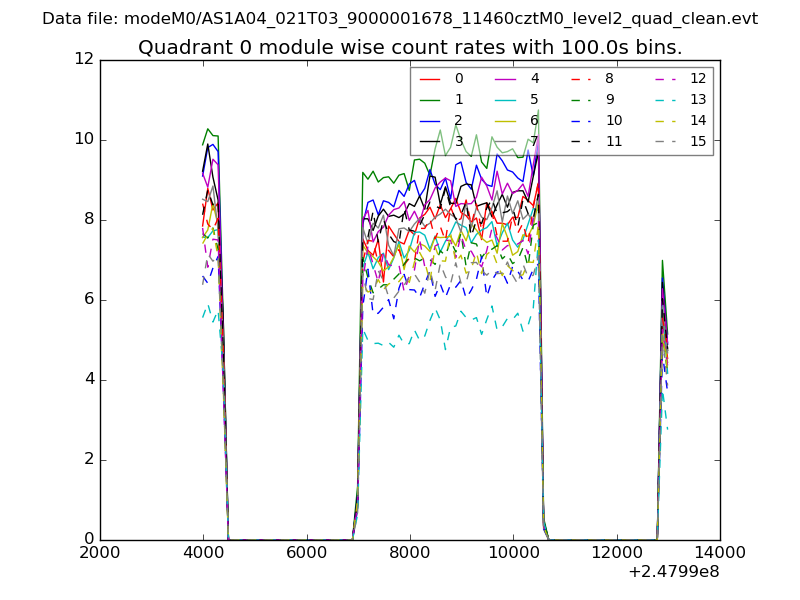 |
 |
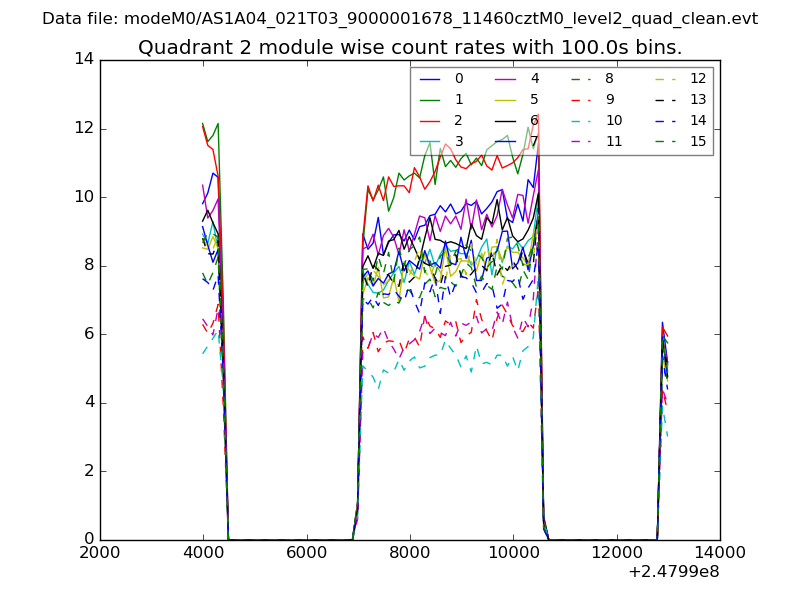
| Module-wise count rates for Quadrant B Data is divided into 100 sec bins |
 |
 |
| Module-wise count rates for Quadrant C Data is divided into 100 sec bins |
 |
 |
| Module-wise count rates for Quadrant D Data is divided into 100 sec bins |
 |
 |
| Parameter | Plot |
|---|---|
| CZT HV Monitor | 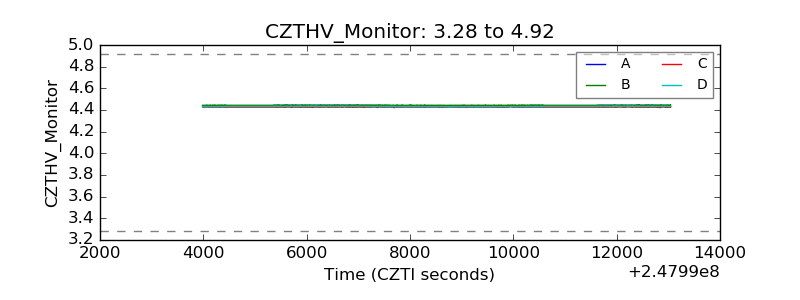 |
| D_VDD | 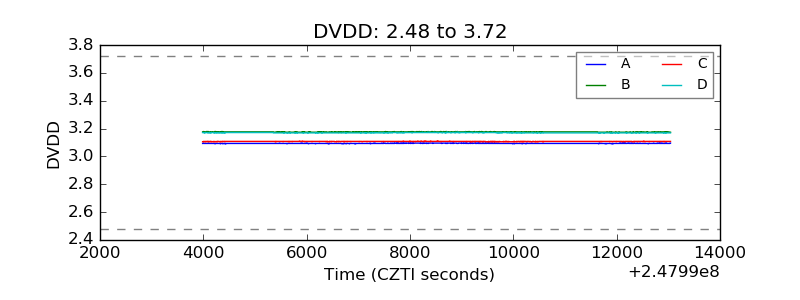 |
| Temperature 1 | 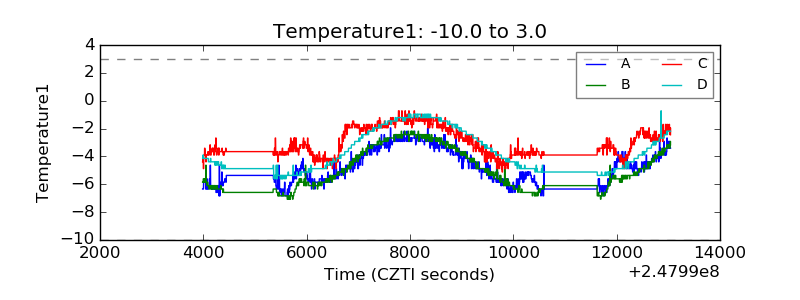 |
| Veto HV Monitor | 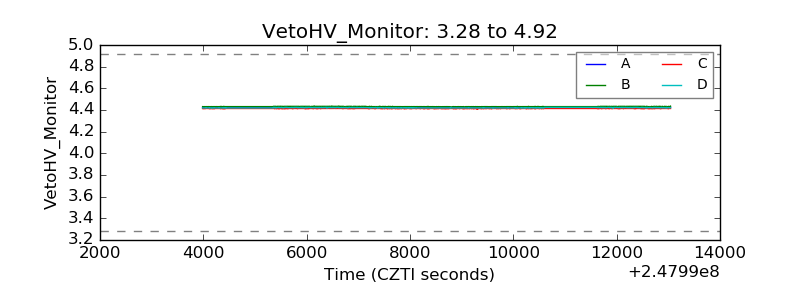 |
| Veto LLD | 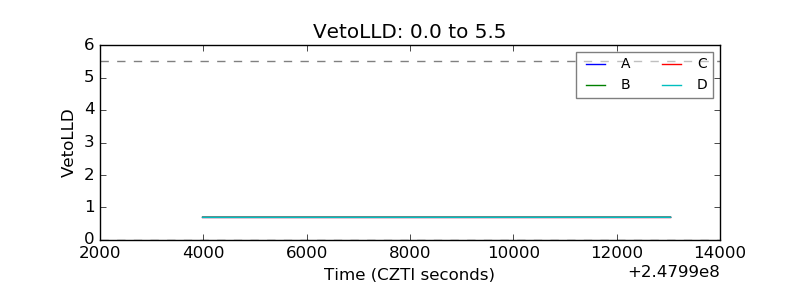 |
| Alpha Counter | 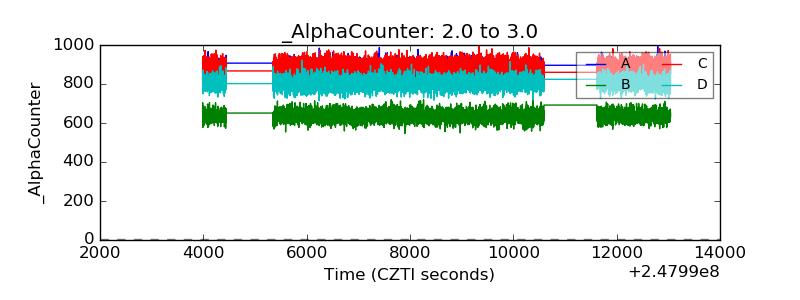 |
| _CPM_Rate | 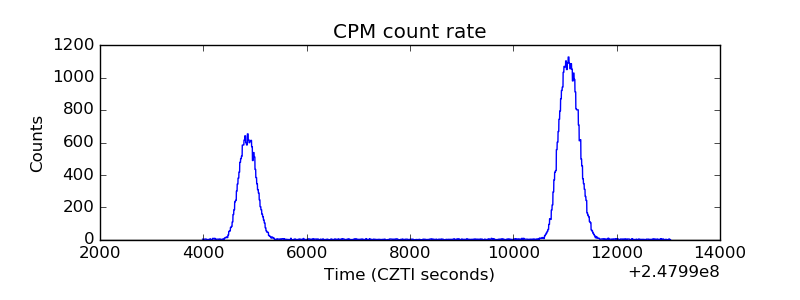 |
| CZT Counter | 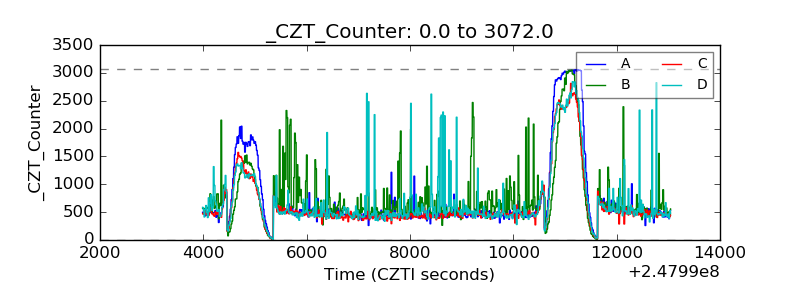 |
| +2.5 Volts monitor |  |
| +5 Volts monitor |  |
| _ROLL_ROT | 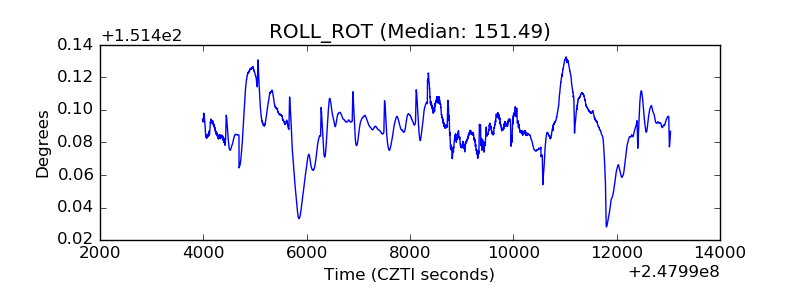 |
| _Roll_DEC | 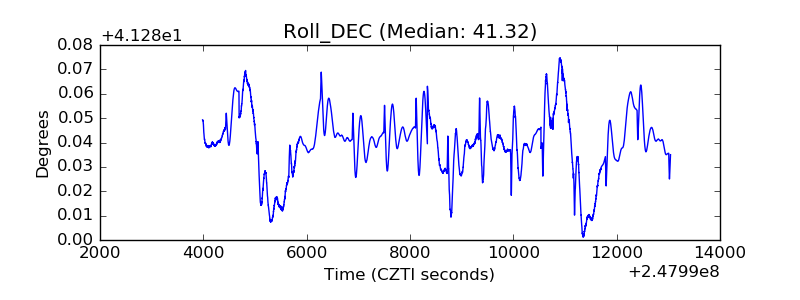 |
| _Roll_RA | 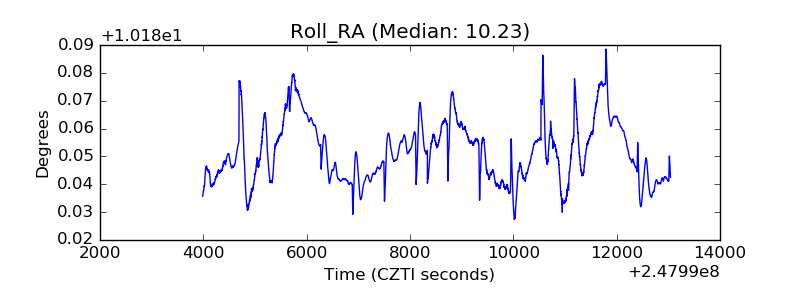 |
| Veto Counter | 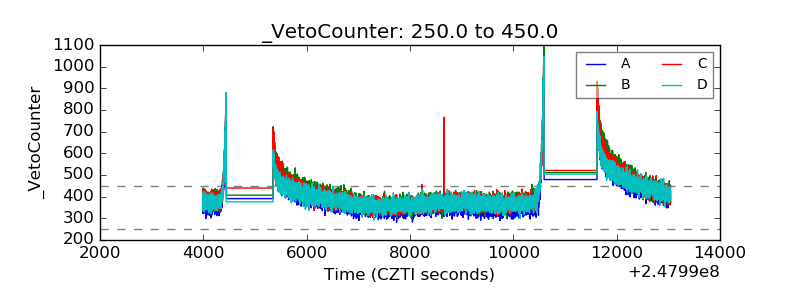 |