| Param | Original file | Final file |
|---|---|---|
| Filename | modeM0/AS1A04_021T03_9000001678_11462cztM0_level2.evt | modeM0/AS1A04_021T03_9000001678_11462cztM0_level2_quad_clean.evt |
| Size (bytes) | 706,731,840 | 99,299,520 |
| Size | 674.0 MB | 94.7 MB |
| Events in quadrant A | 3,620,929 | 666,446 |
| Events in quadrant B | 5,987,530 | 630,581 |
| Events in quadrant C | 3,316,611 | 692,050 |
| Events in quadrant D | 8,027,515 | 552,429 |
| Mode M0 | |||
|---|---|---|---|
| Quadrant | BADHDUFLAG | Total packets | Discarded packets |
| A | 0 | 14875 | 3 |
| B | 0 | 22393 | 2 |
| C | 0 | 13979 | 2 |
| D | 0 | 28410 | 2 |
| Mode M9 | |||
|---|---|---|---|
| Quadrant | BADHDUFLAG | Total packets | Discarded packets |
| A | 0 | 24 | 0 |
| B | 0 | 24 | 0 |
| C | 0 | 24 | 0 |
| D | 0 | 24 | 0 |
| Mode SS | |||
|---|---|---|---|
| Quadrant | BADHDUFLAG | Total packets | Discarded packets |
| A | 0 | 138 | 0 |
| B | 0 | 138 | 0 |
| C | 0 | 138 | 0 |
| D | 0 | 138 | 0 |
| Quadrant | Total seconds | Saturated seconds | Saturation percentage |
|---|---|---|---|
| A | 6669 | 132 | 1.979307% |
| B | 6669 | 849 | 12.730544% |
| C | 6669 | 75 | 1.124606% |
| D | 6669 | 1438 | 21.562453% |
Noise dominated data is calculated using 1-second bins in cleaned event files. If a bin has >2000 counts, and if more than 50% of those come from <1% of pixels, then it is considered to be noise-dominated and hence unusable.
| Quadrant | # 1 sec bins | Bins with >0 counts | Bins with >2000 counts | High rate bins dominated by noise | Noise dominated (total time) | Noise dominated (detector-on time) | Marked lightcurve |
|---|---|---|---|---|---|---|---|
| A | 9125 | 6672 | 4 | 4 | 0.04% | 0.06% |  |
| B | 9125 | 6671 | 468 | 468 | 5.13% | 7.02% | 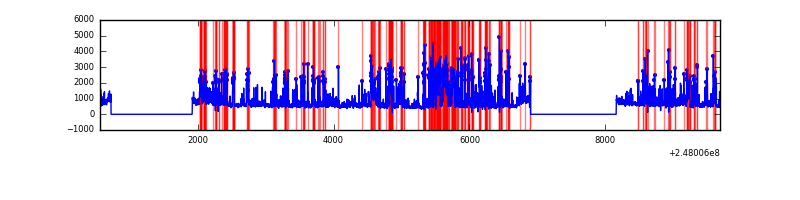 |
| C | 9125 | 6672 | 0 | 0 | 0.00% | 0.00% | 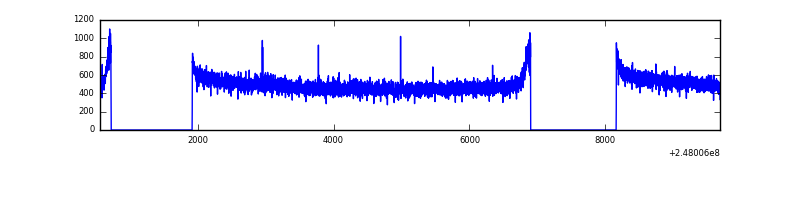 |
| D | 9125 | 6672 | 1142 | 1142 | 12.52% | 17.12% |  |
Top three noisy pixels from each quadrant. If the there are fewer than three noisy pixels in the level2.evt file, extra rows are filled as -1
| Pixel properties | Quadrant properties | ||||||
|---|---|---|---|---|---|---|---|
| Quadrant | DetID | PixID | Counts | Sigma | Mean | Median | Sigma |
| A | 14 | 254 | 79385 | 444.01 | 881 | 865 | 176.8 |
| A | 9 | 143 | 45744 | 253.78 | 881 | 865 | 176.8 |
| A | 1 | 162 | 32252 | 177.49 | 881 | 865 | 176.8 |
| B | 3 | 64 | 1371947 | 8854.35 | 833 | 813 | 154.9 |
| B | 4 | 239 | 1000060 | 6452.82 | 833 | 813 | 154.9 |
| B | 15 | 204 | 154317 | 991.28 | 833 | 813 | 154.9 |
| C | 13 | 61 | 6080 | 26.71 | 850 | 857 | 195.5 |
| C | 14 | 234 | 4264 | 17.43 | 850 | 857 | 195.5 |
| C | 3 | 202 | 2124 | 6.48 | 850 | 857 | 195.5 |
| D | 1 | 52 | 4333321 | 23636.59 | 774 | 755 | 183.3 |
| D | 10 | 253 | 307822 | 1675.22 | 774 | 755 | 183.3 |
| D | 2 | 120 | 188358 | 1023.48 | 774 | 755 | 183.3 |
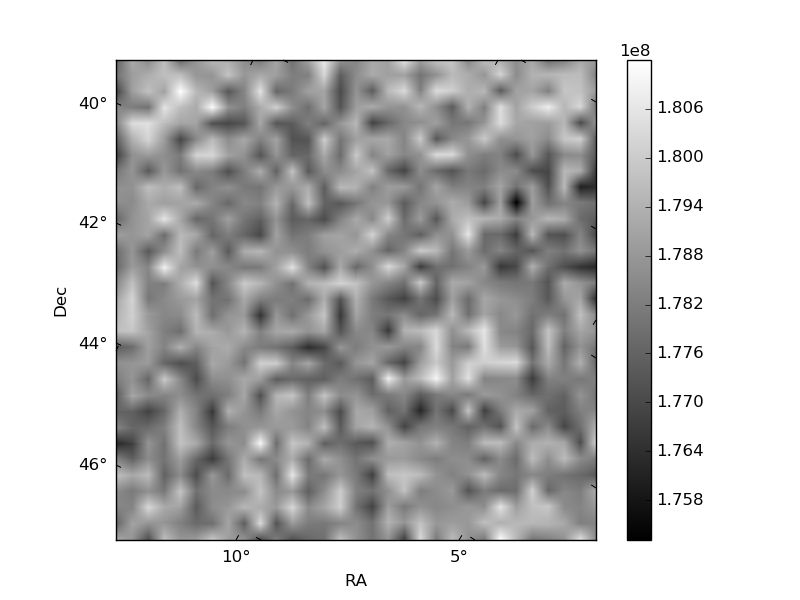
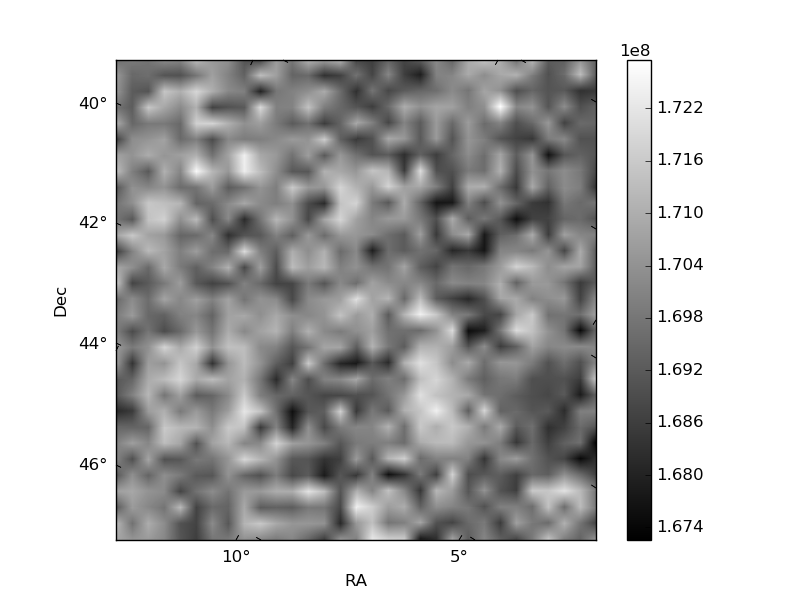
Histogram calculated using DETX and DETY for each event in the final _common_clean file
| Quadrant A | 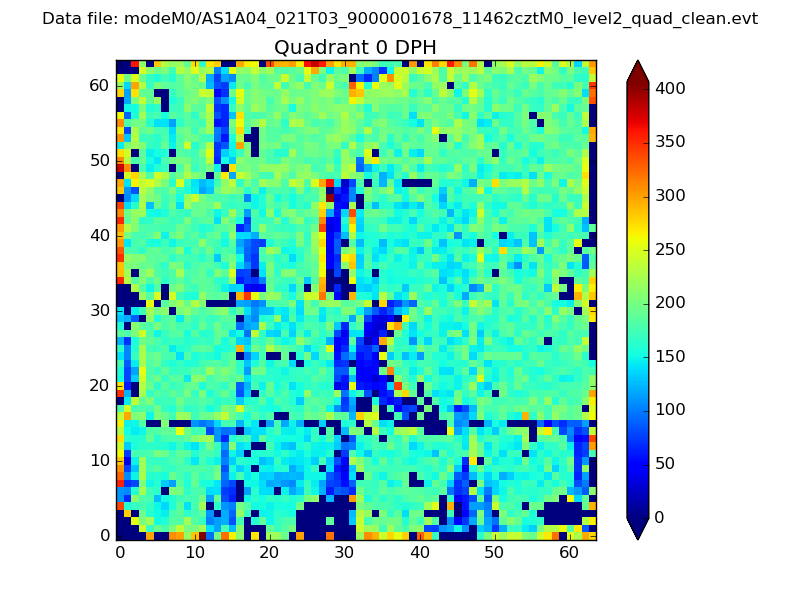 |
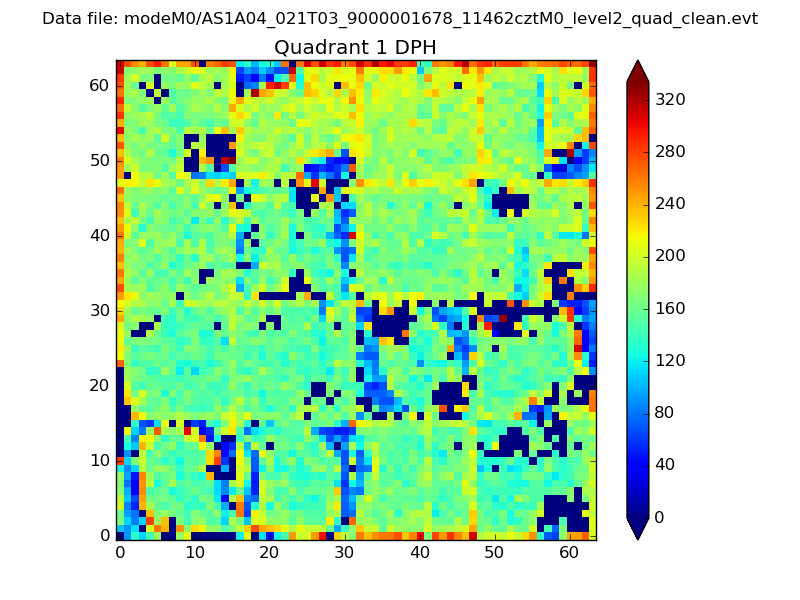 |
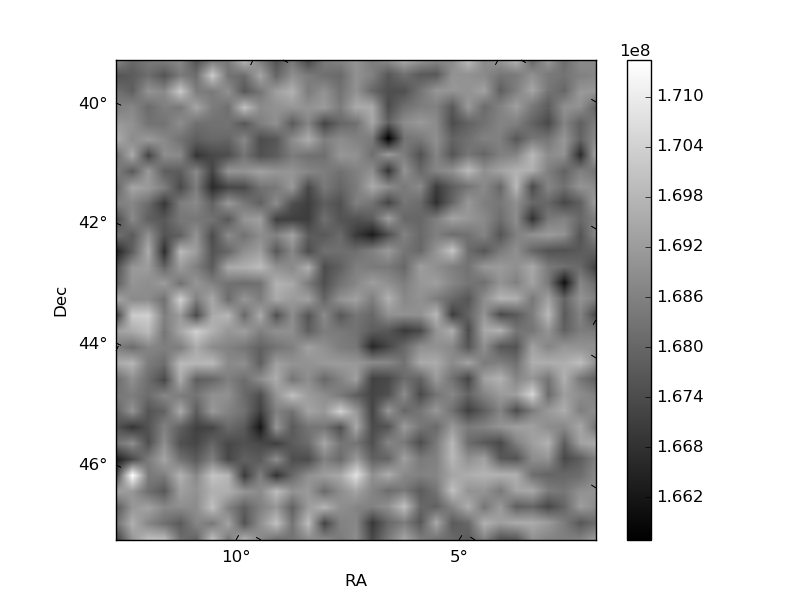
Quadrant B |
|---|---|---|---|
| Quadrant D |  |
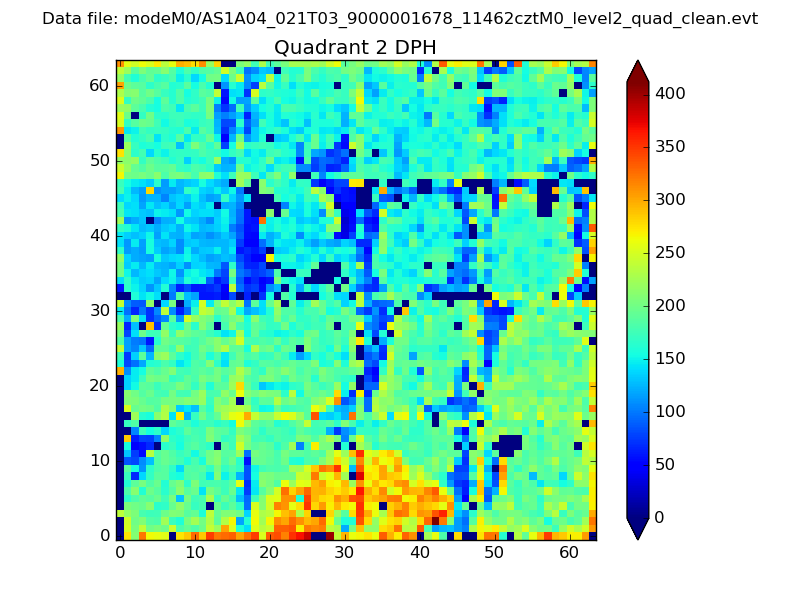 |
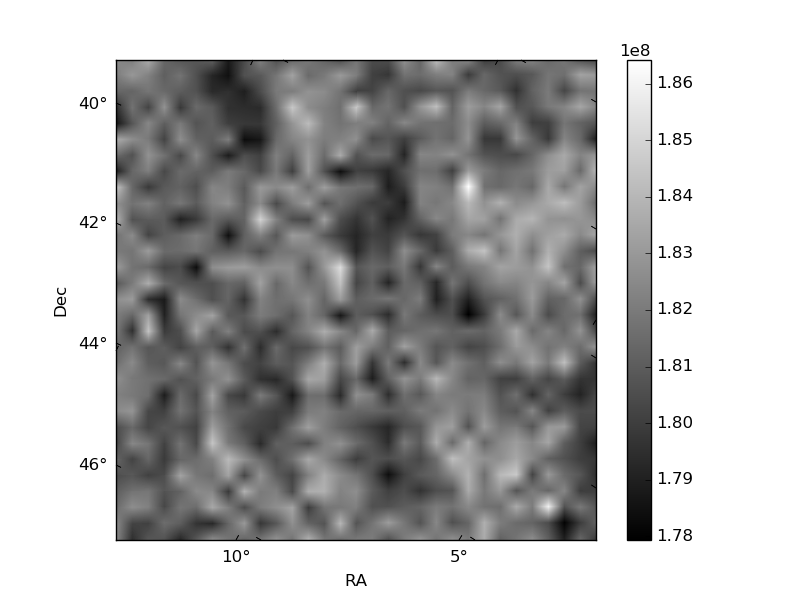
Quadrant C |
| Plot type | Count rate plots | Images |
|---|---|---|
| Comparison with Poisson distribution Blue bars denote a histogram of data divided into 1 sec bins. Red curve is a Poisson curve with rate = median count rate of data. |
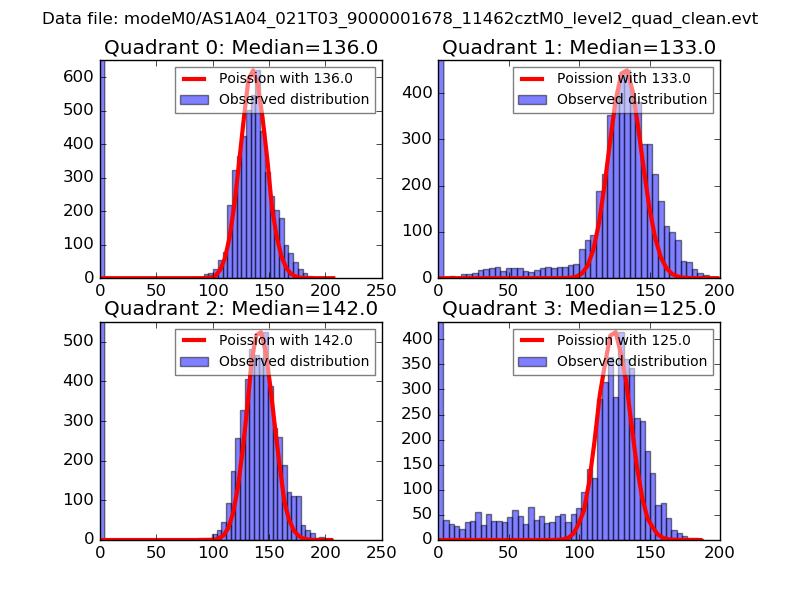 |
 |
| Quadrant-wise count rates Data is divided into 100 sec bins |
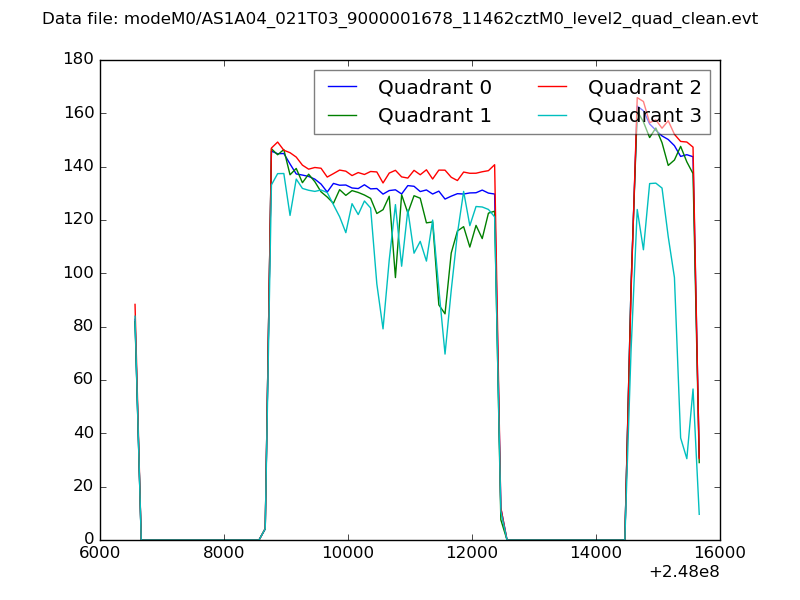 |
|
| Module-wise count rates for Quadrant A Data is divided into 100 sec bins |
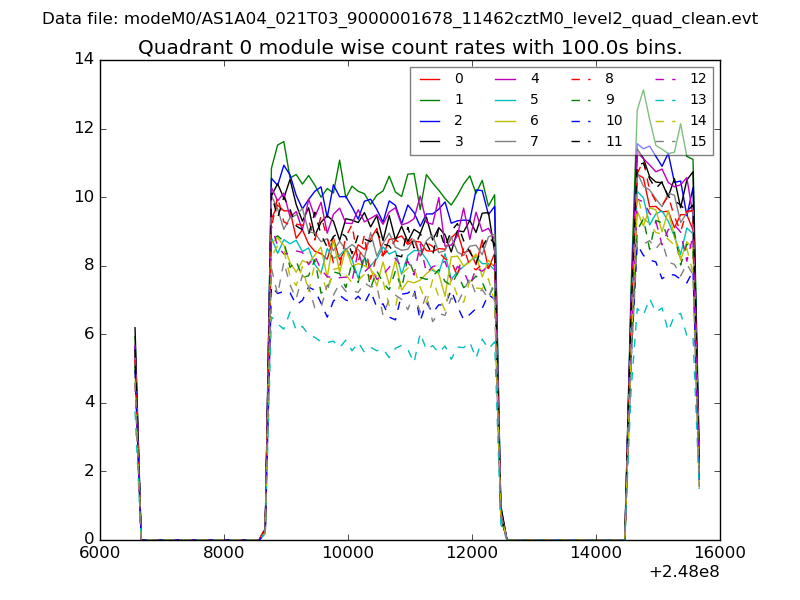 |
 |
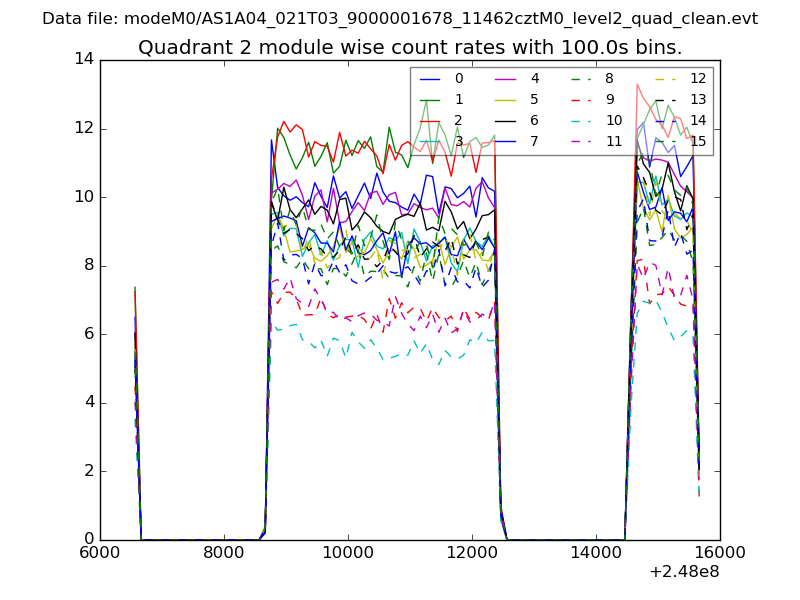
| Module-wise count rates for Quadrant B Data is divided into 100 sec bins |
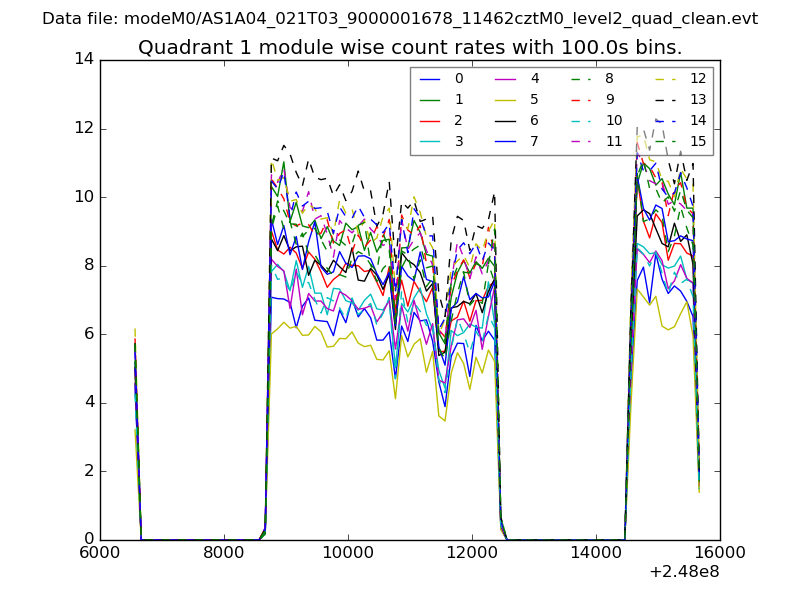 |
 |
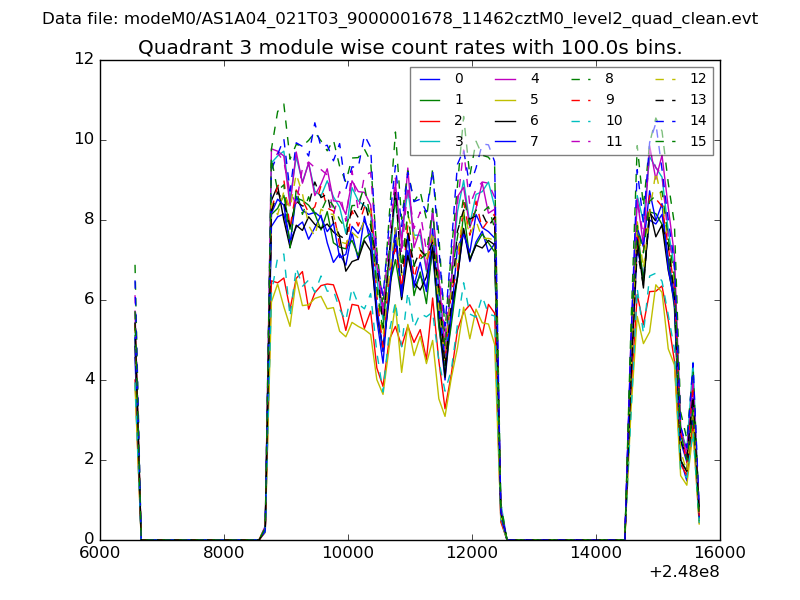
| Module-wise count rates for Quadrant C Data is divided into 100 sec bins |
 |
 |
| Module-wise count rates for Quadrant D Data is divided into 100 sec bins |
 |
 |
| Parameter | Plot |
|---|---|
| CZT HV Monitor | 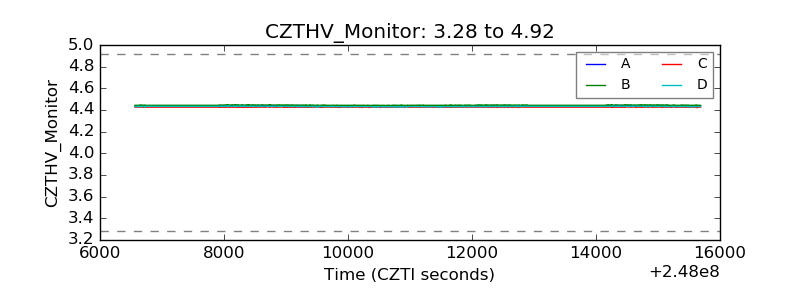 |
| D_VDD | 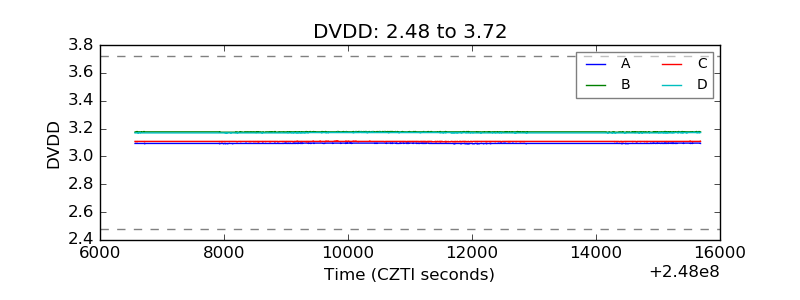 |
| Temperature 1 | 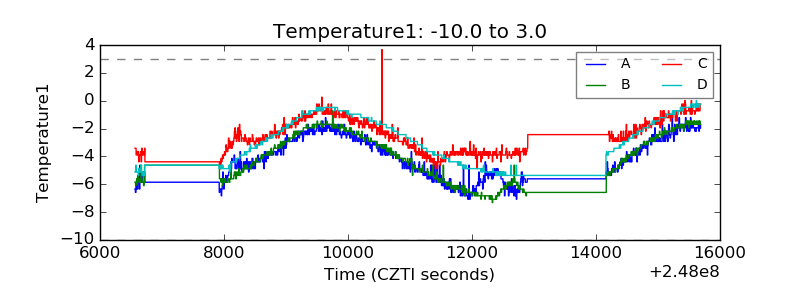 |
| Veto HV Monitor |  |
| Veto LLD |  |
| Alpha Counter | 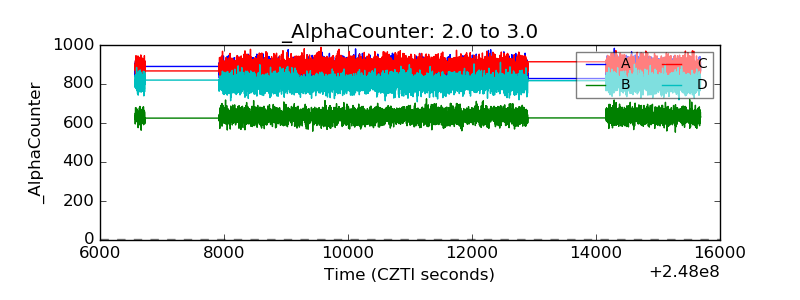 |
| _CPM_Rate | 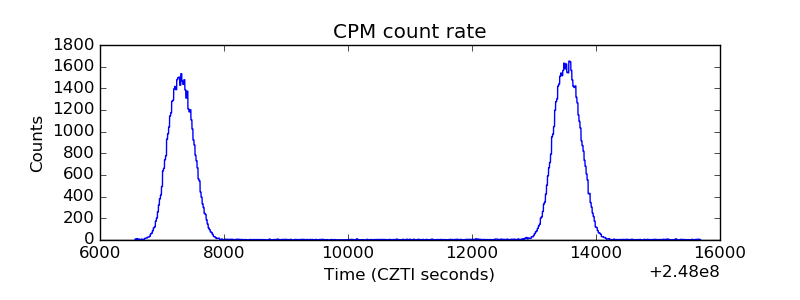 |
| CZT Counter | 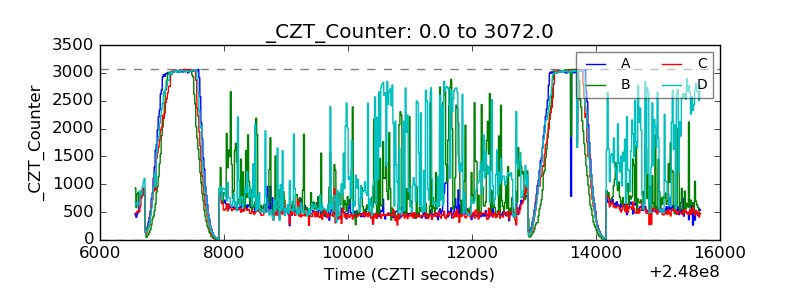 |
| +2.5 Volts monitor |  |
| +5 Volts monitor |  |
| _ROLL_ROT | 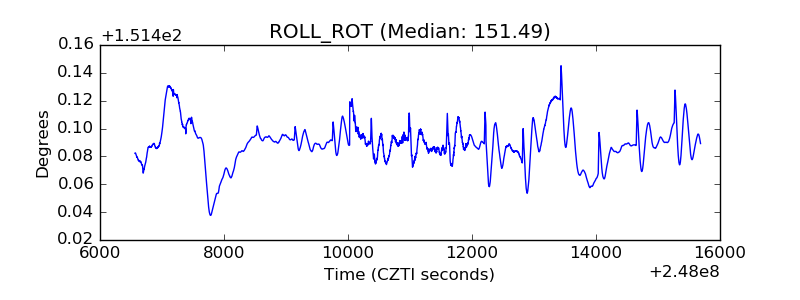 |
| _Roll_DEC | 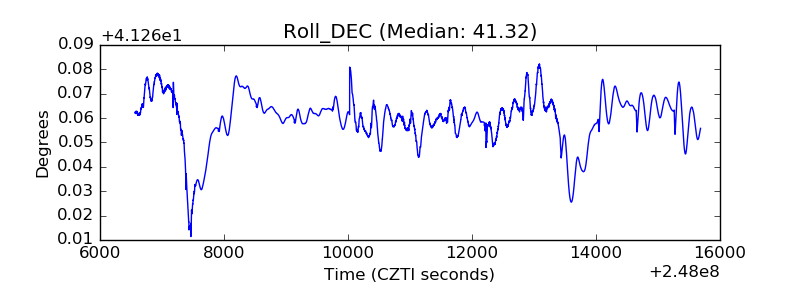 |
| _Roll_RA | 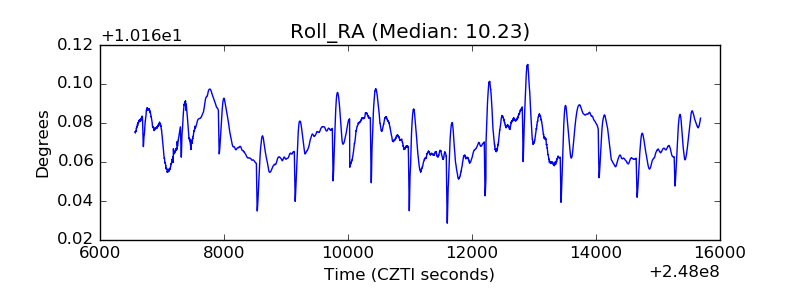 |
| Veto Counter | 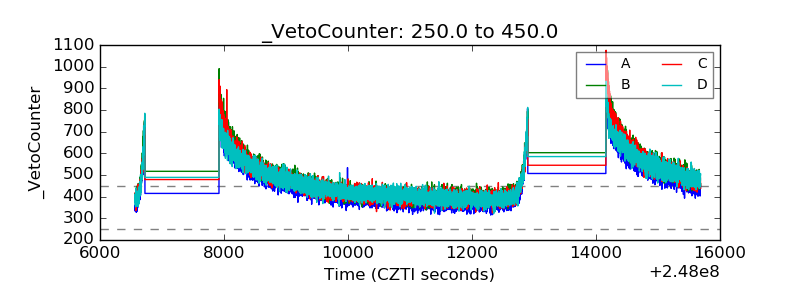 |