| Param | Original file | Final file |
|---|---|---|
| Filename | modeM0/AS1A04_021T03_9000001678_11463cztM0_level2.evt | modeM0/AS1A04_021T03_9000001678_11463cztM0_level2_quad_clean.evt |
| Size (bytes) | 168,223,680 | 28,644,480 |
| Size | 160.4 MB | 27.3 MB |
| Events in quadrant A | 739,329 | 209,372 |
| Events in quadrant B | 1,120,494 | 203,440 |
| Events in quadrant C | 699,163 | 215,124 |
| Events in quadrant D | 2,434,790 | 131,004 |
| Mode M0 | |||
|---|---|---|---|
| Quadrant | BADHDUFLAG | Total packets | Discarded packets |
| A | 0 | 3013 | 0 |
| B | 0 | 4276 | 0 |
| C | 0 | 2917 | 0 |
| D | 0 | 8186 | 0 |
| Mode SS | |||
|---|---|---|---|
| Quadrant | BADHDUFLAG | Total packets | Discarded packets |
| A | 0 | 28 | 0 |
| B | 0 | 28 | 0 |
| C | 0 | 28 | 0 |
| D | 0 | 28 | 0 |
| Quadrant | Total seconds | Saturated seconds | Saturation percentage |
|---|---|---|---|
| A | 1451 | 2 | 0.137836% |
| B | 1451 | 79 | 5.444521% |
| C | 1451 | 0 | 0.000000% |
| D | 1451 | 716 | 49.345279% |
Noise dominated data is calculated using 1-second bins in cleaned event files. If a bin has >2000 counts, and if more than 50% of those come from <1% of pixels, then it is considered to be noise-dominated and hence unusable.
| Quadrant | # 1 sec bins | Bins with >0 counts | Bins with >2000 counts | High rate bins dominated by noise | Noise dominated (total time) | Noise dominated (detector-on time) | Marked lightcurve |
|---|---|---|---|---|---|---|---|
| A | 1452 | 1452 | 0 | 0 | 0.00% | 0.00% |  |
| B | 1452 | 1452 | 43 | 43 | 2.96% | 2.96% |  |
| C | 1452 | 1452 | 0 | 0 | 0.00% | 0.00% |  |
| D | 1452 | 1452 | 585 | 585 | 40.29% | 40.29% | 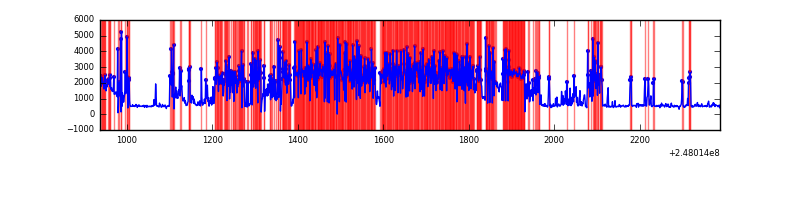 |
Top three noisy pixels from each quadrant. If the there are fewer than three noisy pixels in the level2.evt file, extra rows are filled as -1
| Pixel properties | Quadrant properties | ||||||
|---|---|---|---|---|---|---|---|
| Quadrant | DetID | PixID | Counts | Sigma | Mean | Median | Sigma |
| A | 1 | 162 | 7361 | 181.67 | 185 | 182 | 39.5 |
| A | 1 | 178 | 4170 | 100.92 | 185 | 182 | 39.5 |
| A | 9 | 143 | 3903 | 94.16 | 185 | 182 | 39.5 |
| B | 4 | 239 | 333021 | 9431.17 | 178 | 174 | 35.3 |
| B | 3 | 64 | 35723 | 1007.28 | 178 | 174 | 35.3 |
| B | 11 | 51 | 15411 | 431.74 | 178 | 174 | 35.3 |
| C | 13 | 61 | 1332 | 26.89 | 179 | 180 | 42.8 |
| C | 3 | 202 | 486 | 7.14 | 179 | 180 | 42.8 |
| C | -1 | -1 | -1 | -1.0 | 179 | 180 | 42.8 |
| D | 1 | 52 | 1889831 | 60343.18 | 125 | 122 | 31.3 |
| D | 8 | 195 | 24272 | 771.17 | 125 | 122 | 31.3 |
| D | 2 | 120 | 19112 | 606.4 | 125 | 122 | 31.3 |
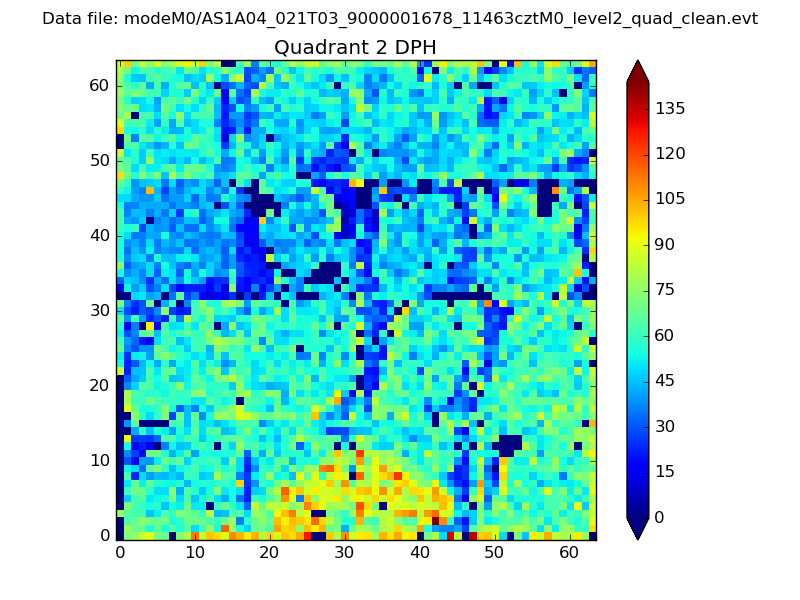
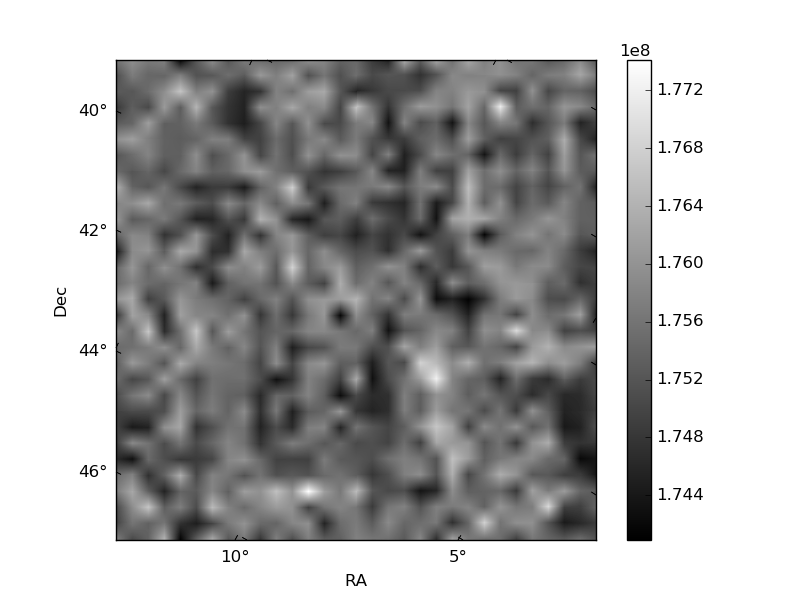
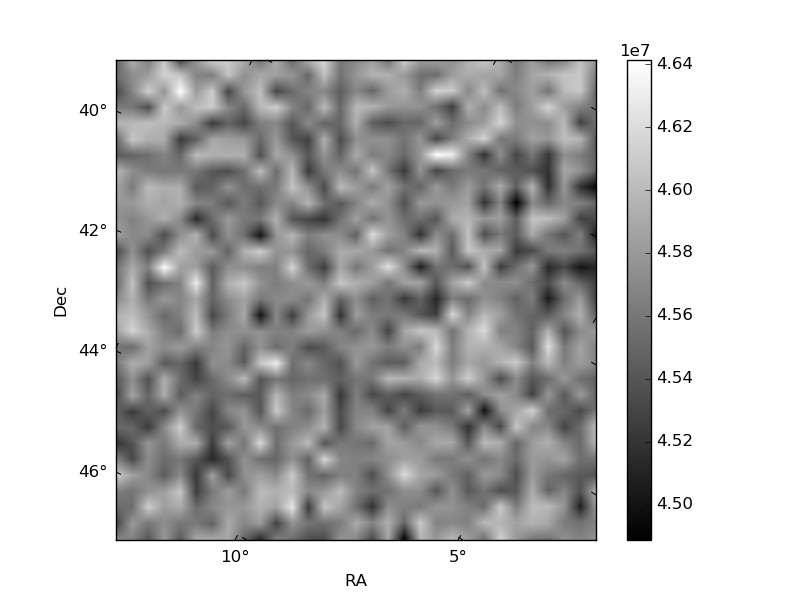
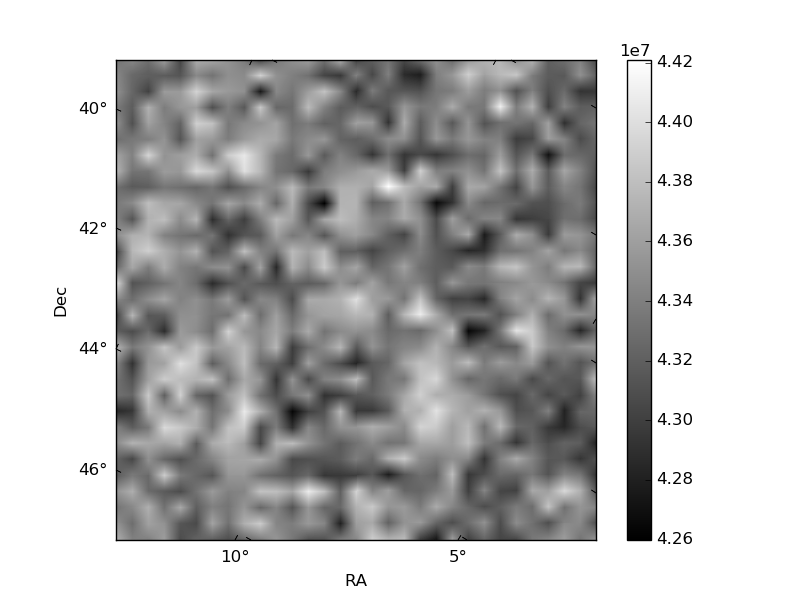
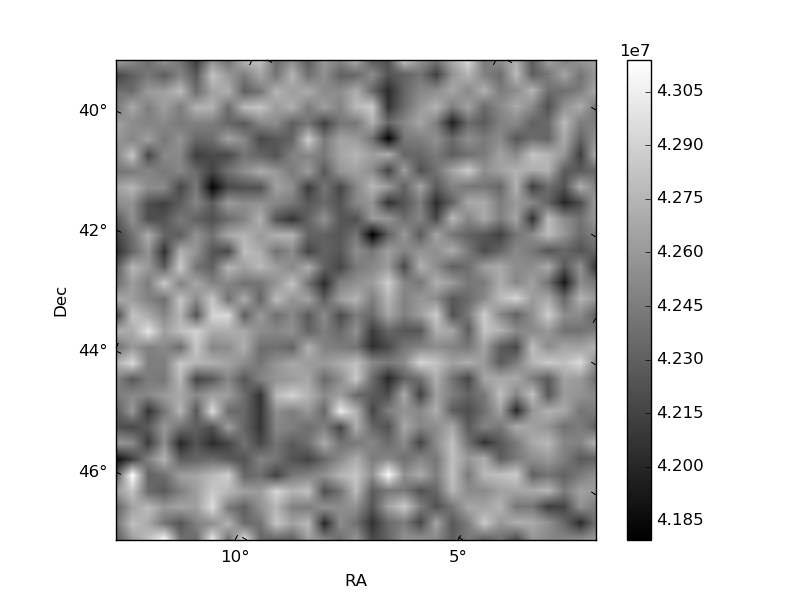
Histogram calculated using DETX and DETY for each event in the final _common_clean file
| Quadrant A |  |
 |
Quadrant B |
|---|---|---|---|
| Quadrant D | 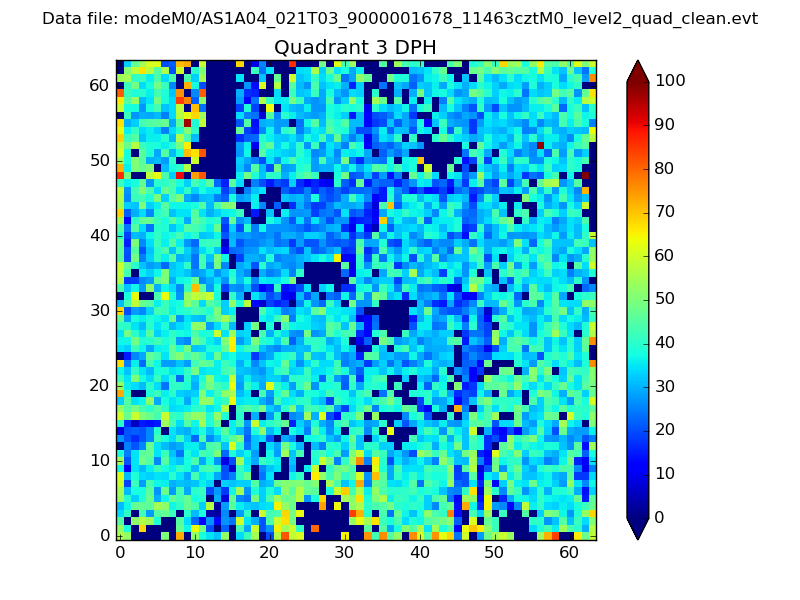 |
 |
Quadrant C |
| Plot type | Count rate plots | Images |
|---|---|---|
| Comparison with Poisson distribution Blue bars denote a histogram of data divided into 1 sec bins. Red curve is a Poisson curve with rate = median count rate of data. |
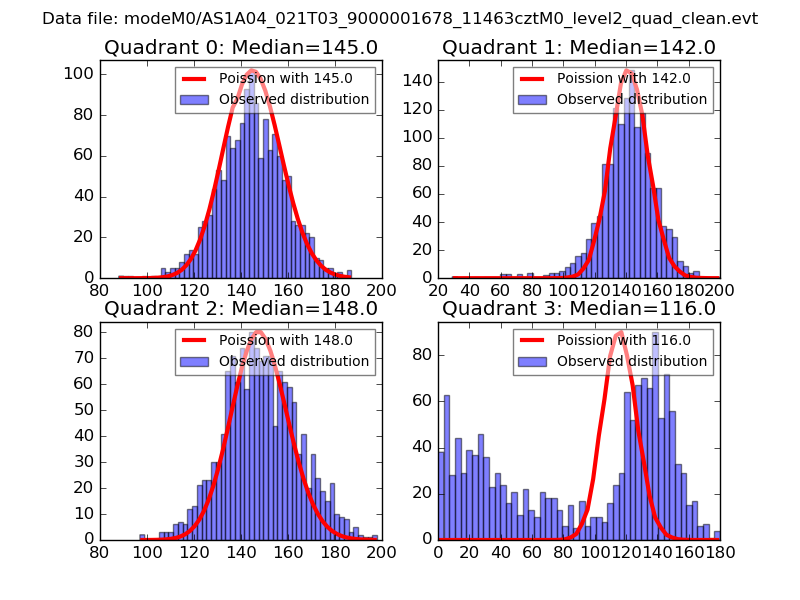 |
 |
| Quadrant-wise count rates Data is divided into 100 sec bins |
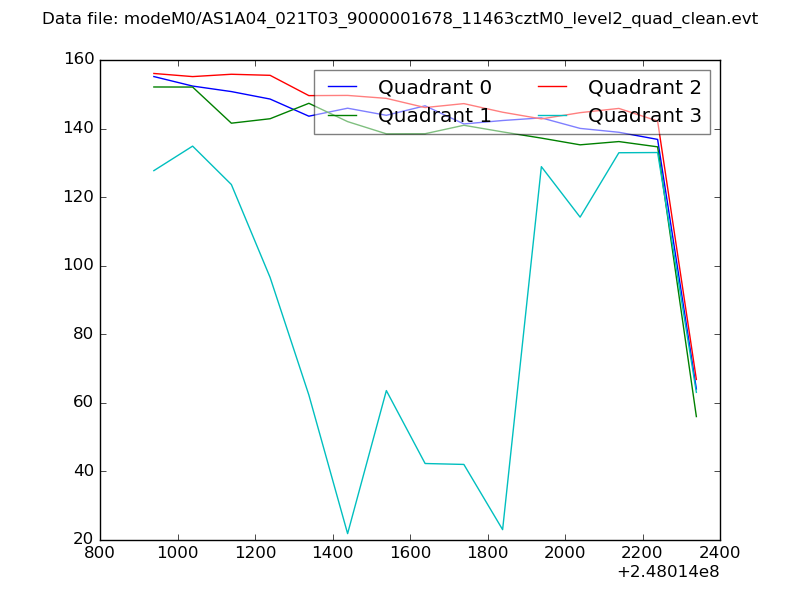 |
|
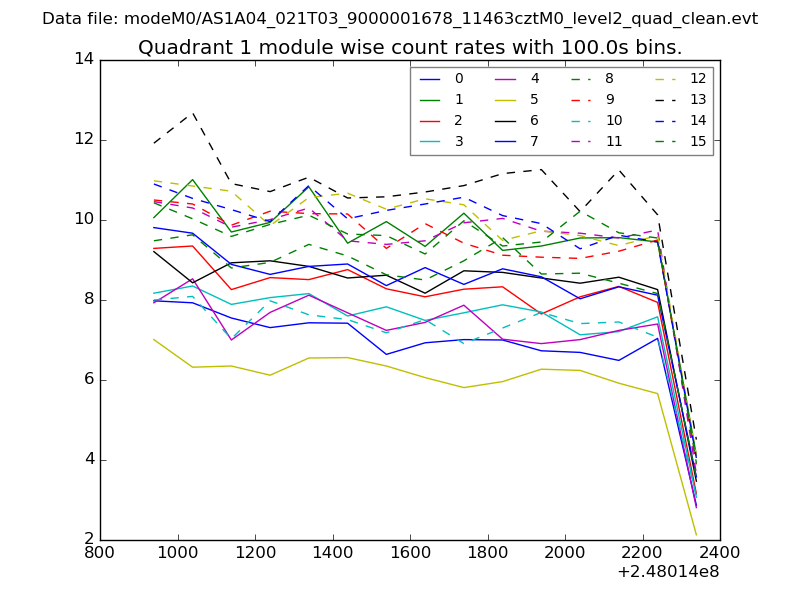
| Module-wise count rates for Quadrant A Data is divided into 100 sec bins |
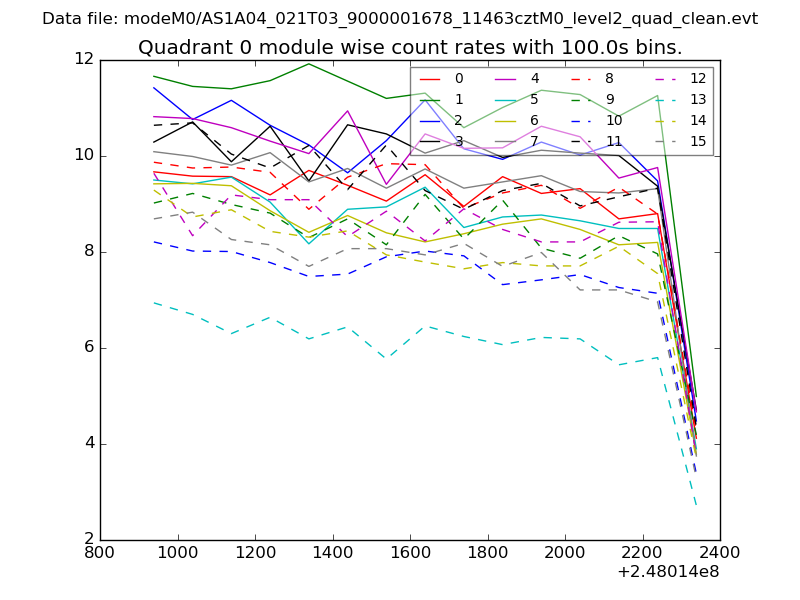 |
 |
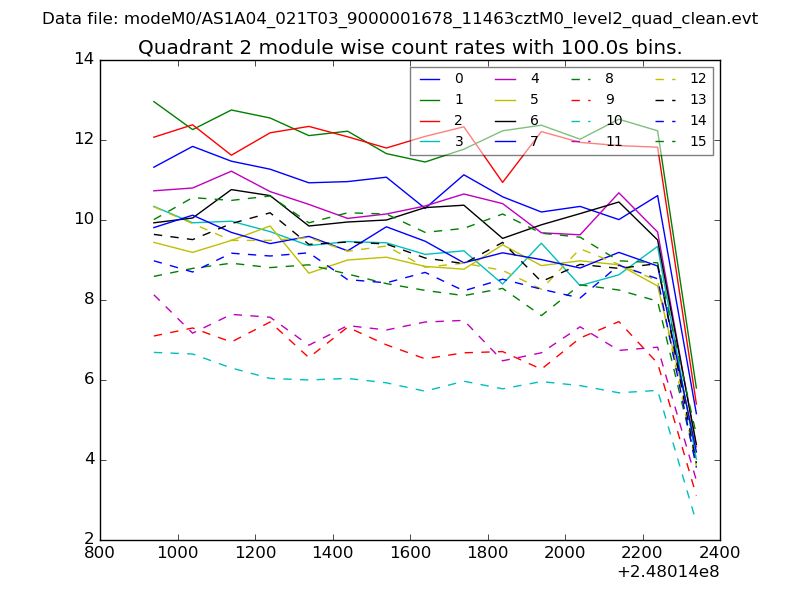
| Module-wise count rates for Quadrant B Data is divided into 100 sec bins |
 |
 |
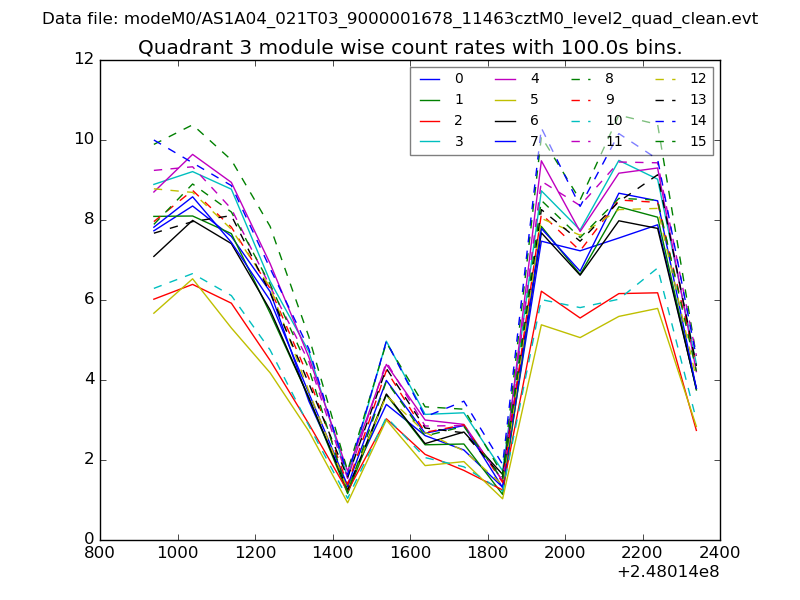
| Module-wise count rates for Quadrant C Data is divided into 100 sec bins |
 |
 |
| Module-wise count rates for Quadrant D Data is divided into 100 sec bins |
 |
 |
| Parameter | Plot |
|---|---|
| CZT HV Monitor | 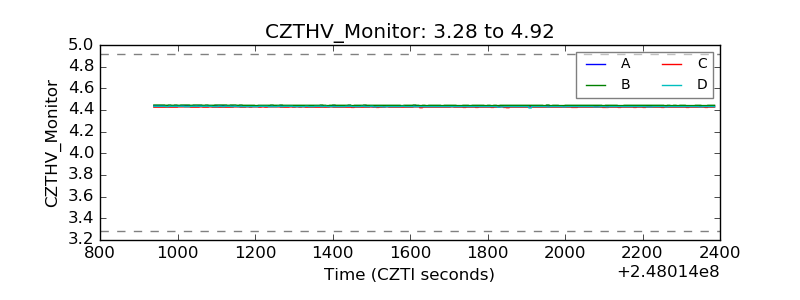 |
| D_VDD | 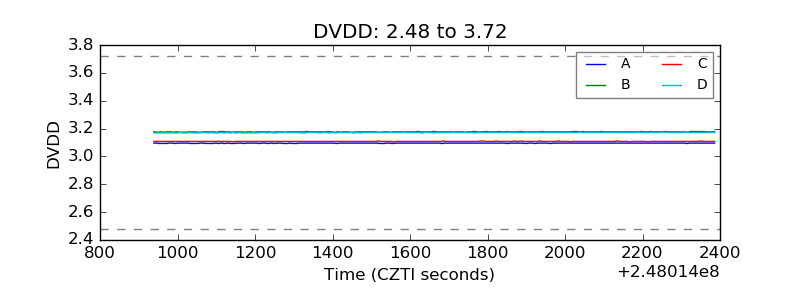 |
| Temperature 1 | 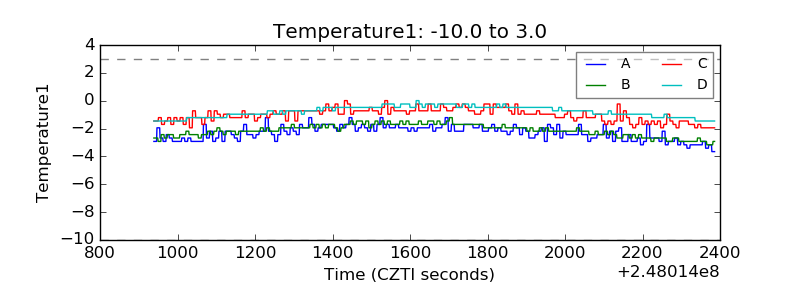 |
| Veto HV Monitor | 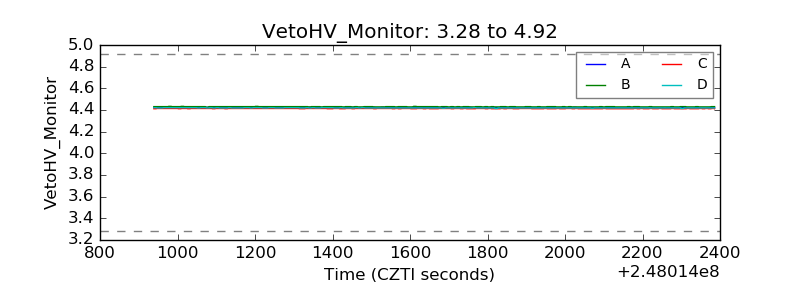 |
| Veto LLD | 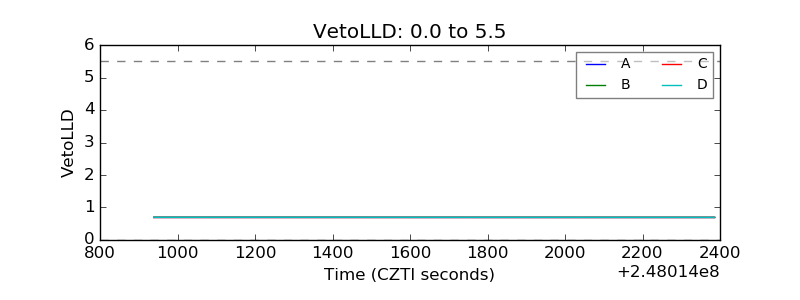 |
| Alpha Counter | 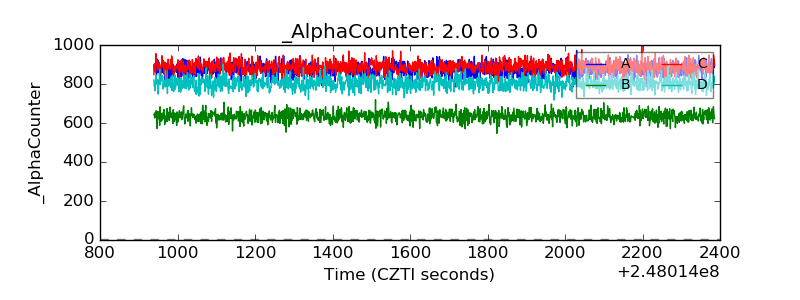 |
| _CPM_Rate | 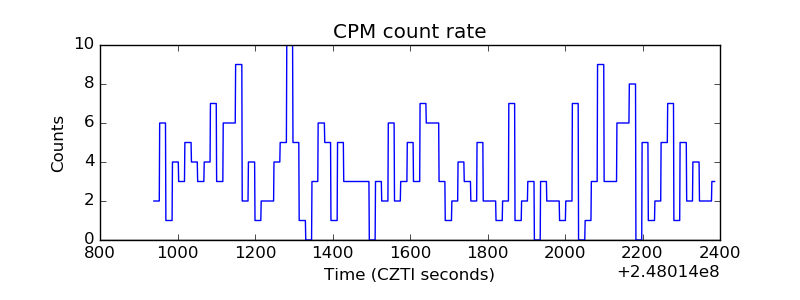 |
| CZT Counter | 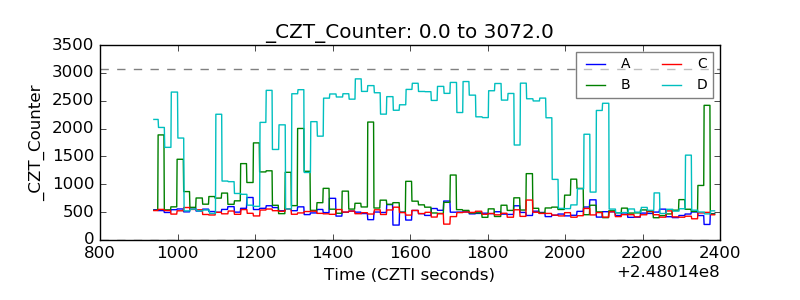 |
| +2.5 Volts monitor |  |
| +5 Volts monitor |  |
| _ROLL_ROT | 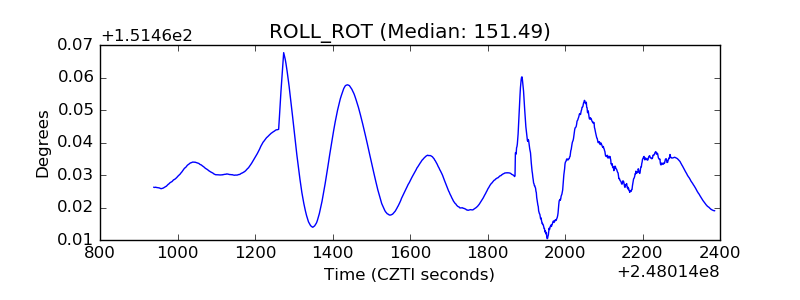 |
| _Roll_DEC | 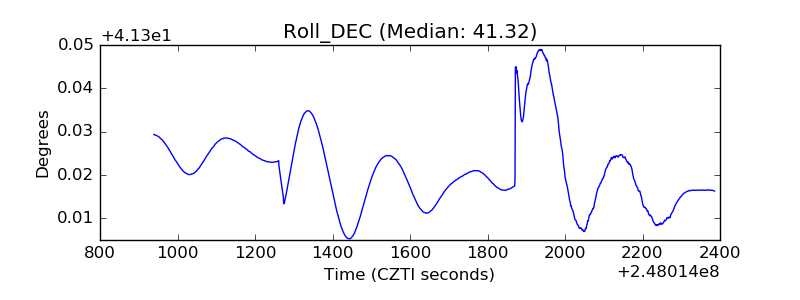 |
| _Roll_RA | 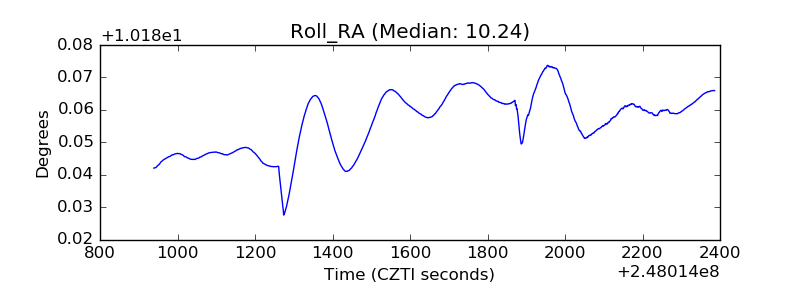 |
| Veto Counter | 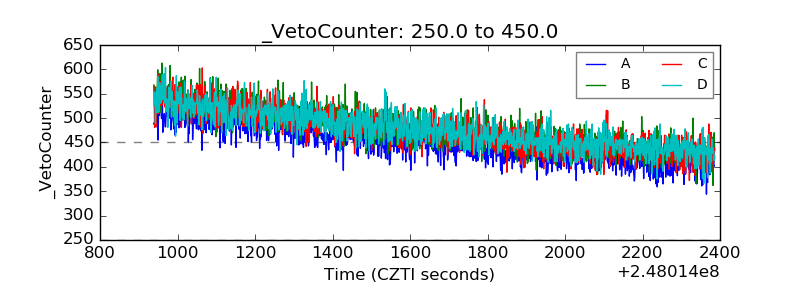 |