| Param | Original file | Final file |
|---|---|---|
| Filename | modeM0/AS1G08_032T01_9000001680cztM0_level2.fits | modeM0/AS1G08_032T01_9000001680cztM0_level2_quad_clean.evt |
| Size (bytes) | 358,873,920 | 297,279,360 |
| Size | 342.2 MB | 283.5 MB |
| Events in quadrant A | 2,185,656 | 1,691,287 |
| Events in quadrant B | 2,034,492 | 1,579,857 |
| Events in quadrant C | 2,151,946 | 1,601,941 |
| Events in quadrant D | 1,836,574 | 1,470,238 |
| Mode M0 | |||
|---|---|---|---|
| Quadrant | BADHDUFLAG | Total packets | Discarded packets |
| A | 0 | 81151 | 0 |
| B | 0 | 111648 | 0 |
| C | 0 | 79921 | 0 |
| D | 0 | 98584 | 0 |
| Mode M9 | |||
|---|---|---|---|
| Quadrant | BADHDUFLAG | Total packets | Discarded packets |
| A | 0 | 51 | 0 |
| B | 0 | 51 | 0 |
| C | 0 | 51 | 0 |
| D | 0 | 51 | 0 |
| Mode SS | |||
|---|---|---|---|
| Quadrant | BADHDUFLAG | Total packets | Discarded packets |
| A | 0 | 788 | 0 |
| B | 0 | 788 | 0 |
| C | 0 | 788 | 0 |
| D | 0 | 788 | 0 |
| Quadrant | Total seconds | Saturated seconds | Saturation percentage |
|---|---|---|---|
| A | 38712 | 453 | 1.170180% |
| B | 38712 | 2881 | 7.442137% |
| C | 38712 | 278 | 0.718124% |
| D | 38712 | 1538 | 3.972928% |
Noise dominated data is calculated using 1-second bins in cleaned event files. If a bin has >2000 counts, and if more than 50% of those come from <1% of pixels, then it is considered to be noise-dominated and hence unusable.
| Quadrant | # 1 sec bins | Bins with >0 counts | Bins with >2000 counts | High rate bins dominated by noise | Noise dominated (total time) | Noise dominated (detector-on time) | Marked lightcurve |
|---|---|---|---|---|---|---|---|
| A | 43862 | 38712 | 0 | 0 | 0.00% | 0.00% |  |
| B | 43862 | 38673 | 0 | 0 | 0.00% | 0.00% |  |
| C | 43862 | 38712 | 0 | 0 | 0.00% | 0.00% |  |
| D | 43862 | 38624 | 0 | 0 | 0.00% | 0.00% |  |
Top three noisy pixels from each quadrant. If the there are fewer than three noisy pixels in the level2.evt file, extra rows are filled as -1
| Pixel properties | Quadrant properties | ||||||
|---|---|---|---|---|---|---|---|
| Quadrant | DetID | PixID | Counts | Sigma | Mean | Median | Sigma |
| A | 0 | 29 | 2054 | 10.63 | 568 | 532 | 143.2 |
| A | 7 | 110 | 1706 | 8.2 | 568 | 532 | 143.2 |
| A | 9 | 19 | 1621 | 7.6 | 568 | 532 | 143.2 |
| B | 2 | 9 | 1790 | 11.85 | 536 | 511 | 107.9 |
| B | 5 | 225 | 1350 | 7.77 | 536 | 511 | 107.9 |
| B | 2 | 8 | 1332 | 7.61 | 536 | 511 | 107.9 |
| C | 12 | 241 | 1488 | 6.5 | 568 | 529 | 147.5 |
| C | 9 | 242 | 1415 | 6.01 | 568 | 529 | 147.5 |
| C | 2 | 191 | 1414 | 6.0 | 568 | 529 | 147.5 |
| D | 3 | 14 | 1371 | 6.34 | 524 | 475 | 141.3 |
| D | 6 | 231 | 1308 | 5.9 | 524 | 475 | 141.3 |
| D | 7 | 5 | 1295 | 5.8 | 524 | 475 | 141.3 |
Histogram calculated using DETX and DETY for each event in the final _common_clean file
| Quadrant A |  |
 |
Quadrant B |
|---|---|---|---|
| Quadrant D | 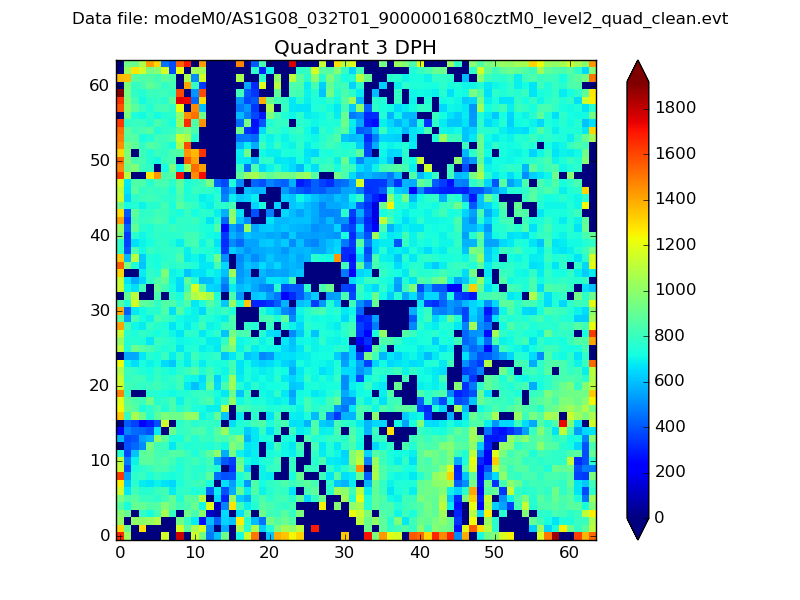 |
 |
Quadrant C |
| Plot type | Count rate plots | Images |
|---|---|---|
| Comparison with Poisson distribution Blue bars denote a histogram of data divided into 1 sec bins. Red curve is a Poisson curve with rate = median count rate of data. |
 |
 |
| Quadrant-wise count rates Data is divided into 100 sec bins |
 |
|
| Module-wise count rates for Quadrant A Data is divided into 100 sec bins |
 |
 |
| Module-wise count rates for Quadrant B Data is divided into 100 sec bins |
 |
 |
| Module-wise count rates for Quadrant C Data is divided into 100 sec bins |
 |
 |
| Module-wise count rates for Quadrant D Data is divided into 100 sec bins |
 |
 |
| Parameter | Plot |
|---|---|
| CZT HV Monitor |  |
| D_VDD |  |
| Temperature 1 |  |
| Veto HV Monitor |  |
| Veto LLD |  |
| Alpha Counter |  |
| _CPM_Rate |  |
| CZT Counter |  |
| +2.5 Volts monitor |  |
| +5 Volts monitor | 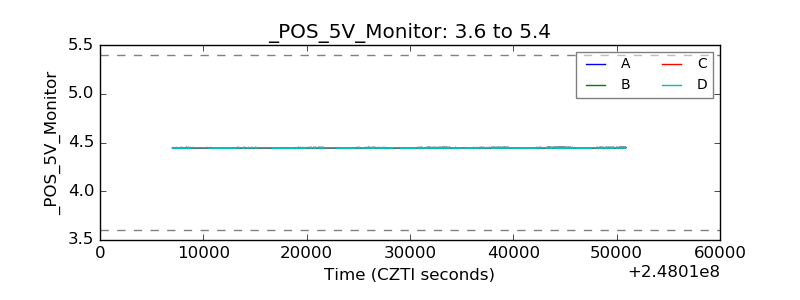 |
| _ROLL_ROT |  |
| _Roll_DEC |  |
| _Roll_RA |  |
| Veto Counter |  |