| Param | Original file | Final file |
|---|---|---|
| Filename | modeM0/AS1G08_032T01_9000001680_11463cztM0_level2.evt | modeM0/AS1G08_032T01_9000001680_11463cztM0_level2_quad_clean.evt |
| Size (bytes) | 300,052,800 | 43,632,000 |
| Size | 286.2 MB | 41.6 MB |
| Events in quadrant A | 1,839,771 | 273,270 |
| Events in quadrant B | 2,860,091 | 265,620 |
| Events in quadrant C | 1,766,467 | 267,695 |
| Events in quadrant D | 2,374,952 | 259,198 |
| Mode M0 | |||
|---|---|---|---|
| Quadrant | BADHDUFLAG | Total packets | Discarded packets |
| A | 0 | 7683 | 2 |
| B | 0 | 10899 | 1 |
| C | 0 | 7506 | 1 |
| D | 0 | 9287 | 1 |
| Mode M9 | |||
|---|---|---|---|
| Quadrant | BADHDUFLAG | Total packets | Discarded packets |
| A | 0 | 13 | 0 |
| B | 0 | 13 | 0 |
| C | 0 | 13 | 0 |
| D | 0 | 13 | 0 |
| Mode SS | |||
|---|---|---|---|
| Quadrant | BADHDUFLAG | Total packets | Discarded packets |
| A | 0 | 74 | 0 |
| B | 0 | 74 | 0 |
| C | 0 | 74 | 0 |
| D | 0 | 74 | 0 |
| Quadrant | Total seconds | Saturated seconds | Saturation percentage |
|---|---|---|---|
| A | 3602 | 81 | 2.248751% |
| B | 3602 | 304 | 8.439756% |
| C | 3602 | 49 | 1.360355% |
| D | 3602 | 223 | 6.191005% |
Noise dominated data is calculated using 1-second bins in cleaned event files. If a bin has >2000 counts, and if more than 50% of those come from <1% of pixels, then it is considered to be noise-dominated and hence unusable.
| Quadrant | # 1 sec bins | Bins with >0 counts | Bins with >2000 counts | High rate bins dominated by noise | Noise dominated (total time) | Noise dominated (detector-on time) | Marked lightcurve |
|---|---|---|---|---|---|---|---|
| A | 4903 | 3604 | 0 | 0 | 0.00% | 0.00% | 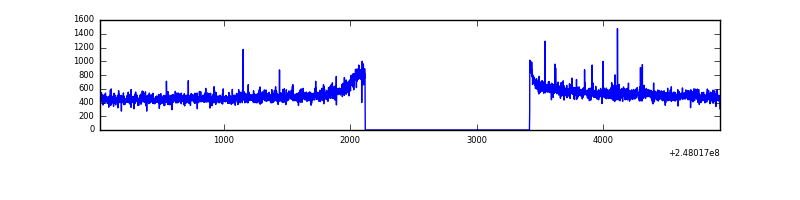 |
| B | 4903 | 3604 | 115 | 115 | 2.35% | 3.19% | 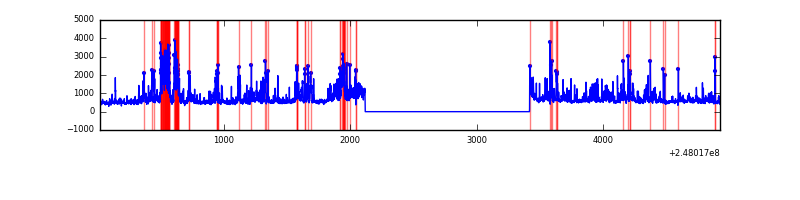 |
| C | 4903 | 3604 | 0 | 0 | 0.00% | 0.00% | 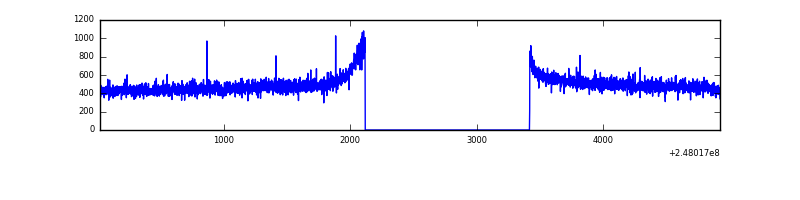 |
| D | 4903 | 3604 | 109 | 109 | 2.22% | 3.02% | 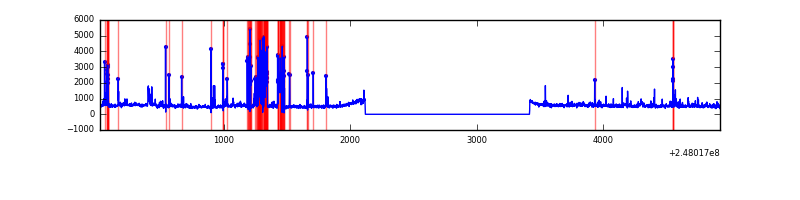 |
Top three noisy pixels from each quadrant. If the there are fewer than three noisy pixels in the level2.evt file, extra rows are filled as -1
| Pixel properties | Quadrant properties | ||||||
|---|---|---|---|---|---|---|---|
| Quadrant | DetID | PixID | Counts | Sigma | Mean | Median | Sigma |
| A | 9 | 143 | 9334 | 91.59 | 467 | 458 | 96.9 |
| A | 1 | 162 | 8289 | 80.81 | 467 | 458 | 96.9 |
| A | 8 | 5 | 5465 | 51.67 | 467 | 458 | 96.9 |
| B | 4 | 239 | 505486 | 5921.33 | 450 | 440 | 85.3 |
| B | 3 | 64 | 391541 | 4585.4 | 450 | 440 | 85.3 |
| B | 11 | 51 | 86320 | 1006.89 | 450 | 440 | 85.3 |
| C | 13 | 61 | 3352 | 27.38 | 453 | 456 | 105.8 |
| C | 3 | 202 | 1114 | 6.22 | 453 | 456 | 105.8 |
| C | -1 | -1 | -1 | -1.0 | 453 | 456 | 105.8 |
| D | 10 | 253 | 323350 | 3035.21 | 444 | 433 | 106.4 |
| D | 1 | 52 | 137979 | 1292.84 | 444 | 433 | 106.4 |
| D | 8 | 195 | 125985 | 1180.11 | 444 | 433 | 106.4 |
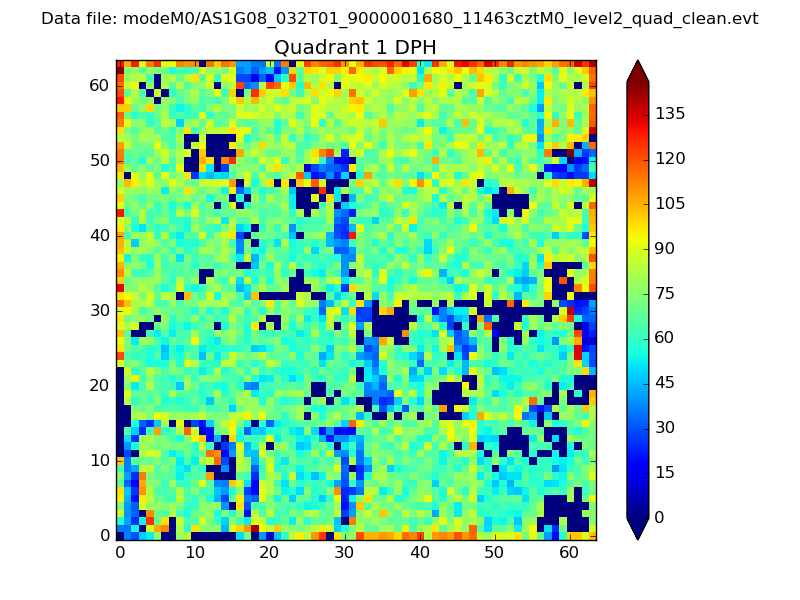
Histogram calculated using DETX and DETY for each event in the final _common_clean file
| Quadrant A |  |
 |
Quadrant B |
|---|---|---|---|
| Quadrant D | 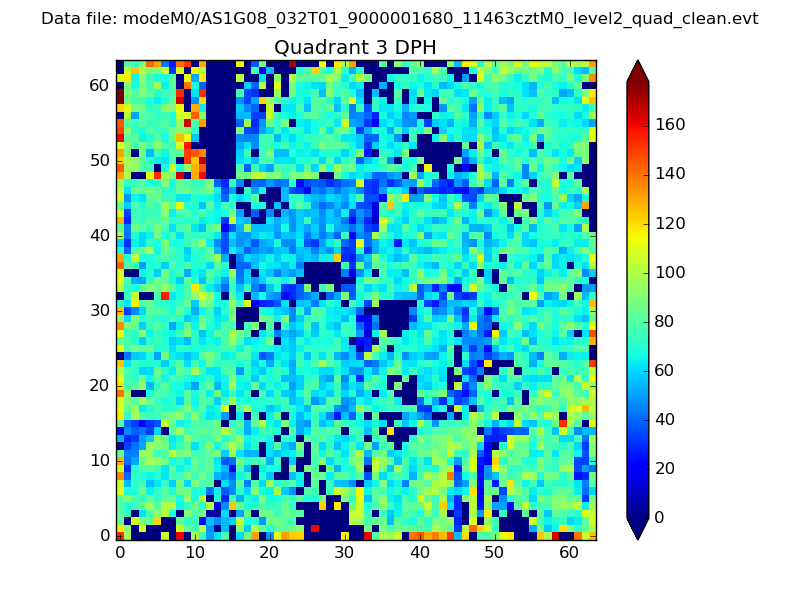 |
 |
Quadrant C |
| Plot type | Count rate plots | Images |
|---|---|---|
| Comparison with Poisson distribution Blue bars denote a histogram of data divided into 1 sec bins. Red curve is a Poisson curve with rate = median count rate of data. |
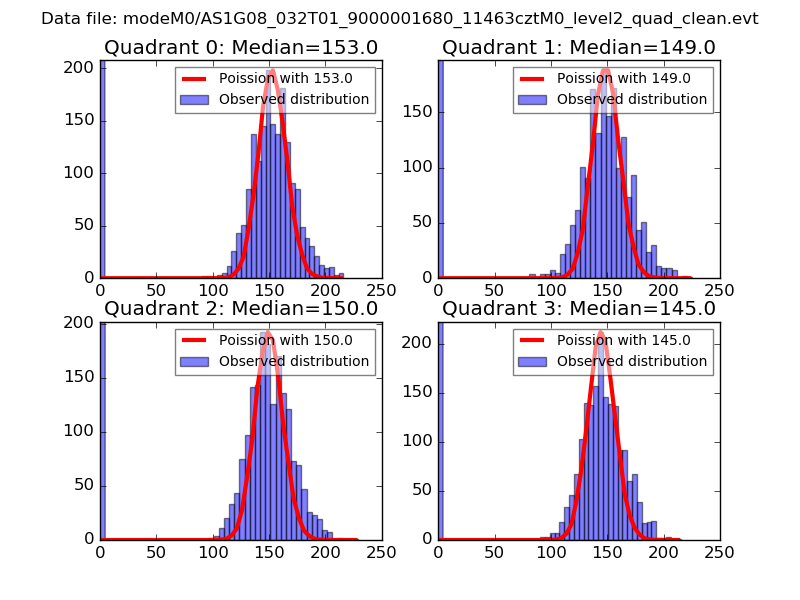 |
 |
| Quadrant-wise count rates Data is divided into 100 sec bins |
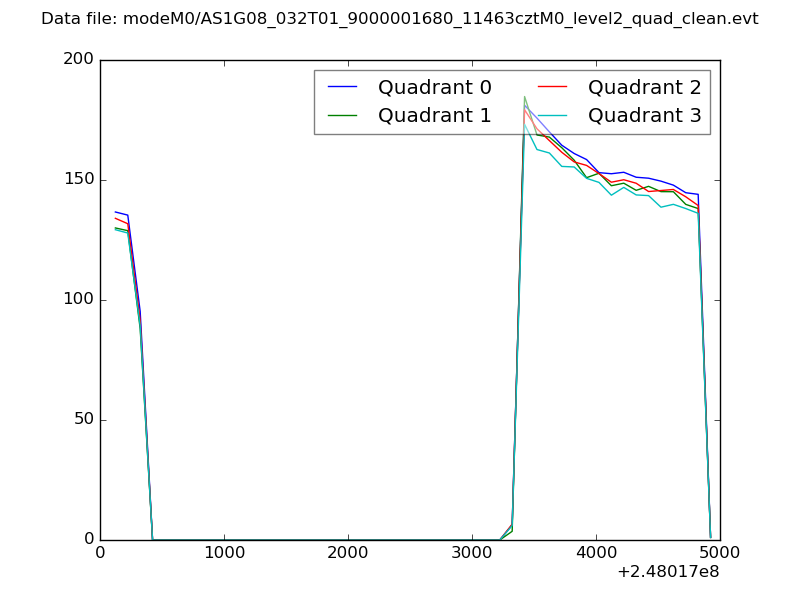 |
|
| Module-wise count rates for Quadrant A Data is divided into 100 sec bins |
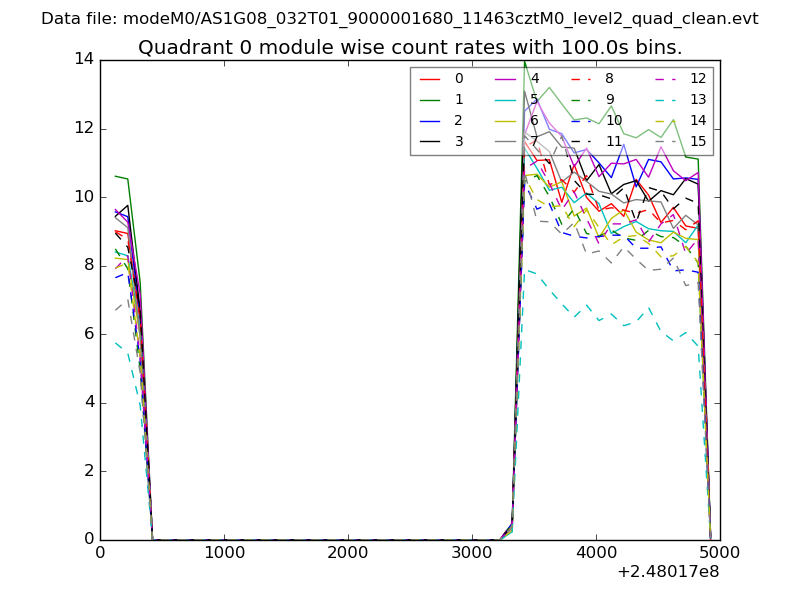 |
 |
| Module-wise count rates for Quadrant B Data is divided into 100 sec bins |
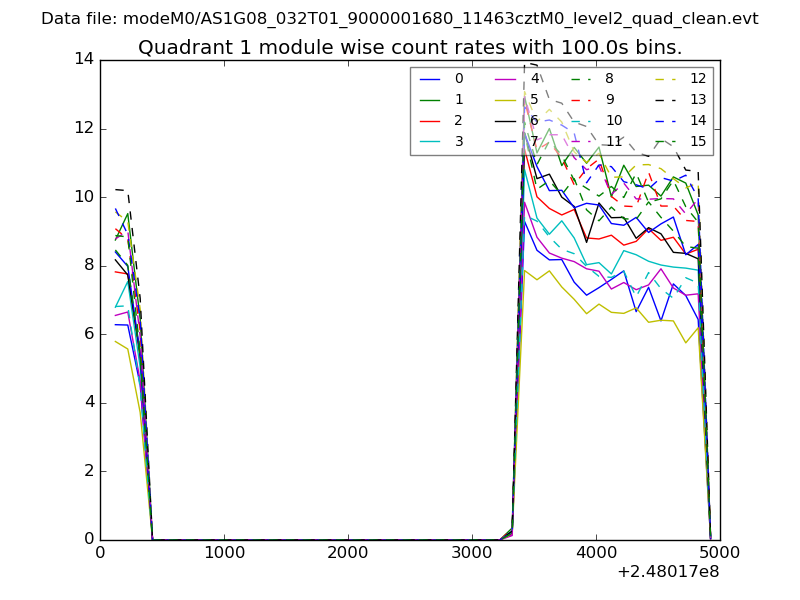 |
 |
| Module-wise count rates for Quadrant C Data is divided into 100 sec bins |
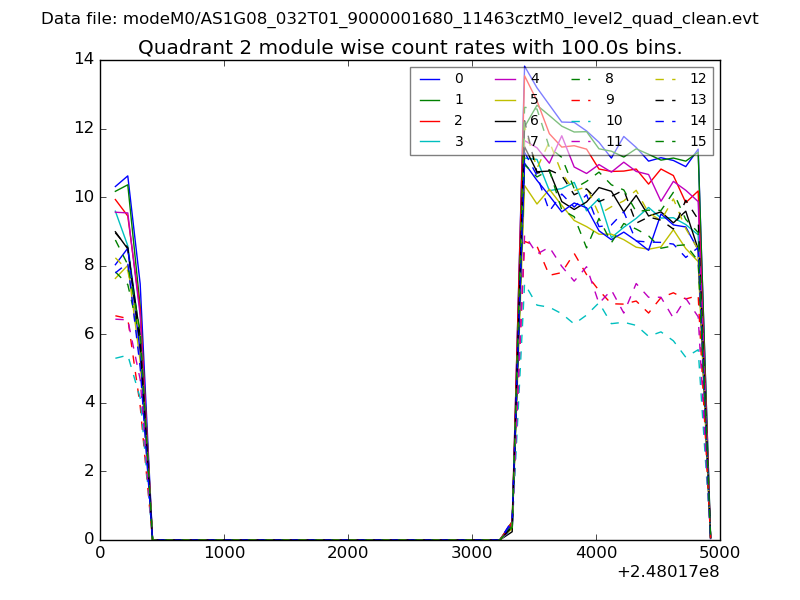 |
 |
| Module-wise count rates for Quadrant D Data is divided into 100 sec bins |
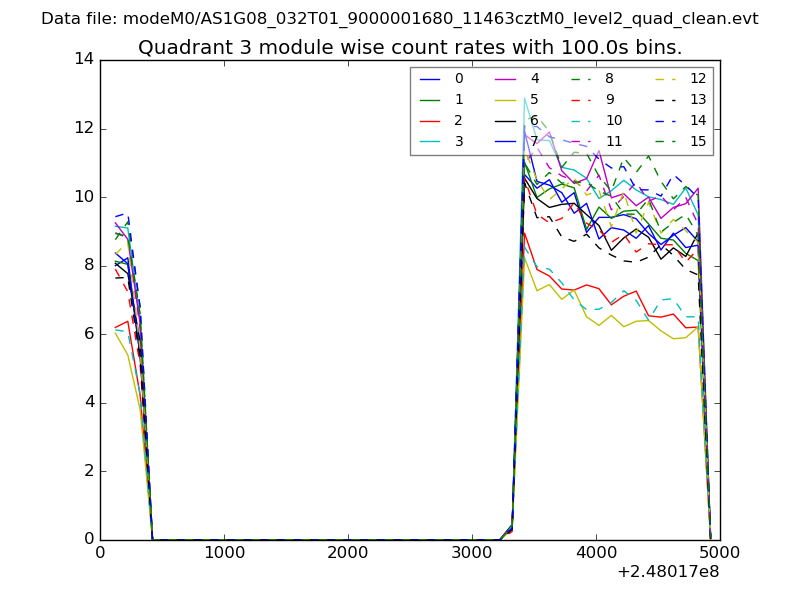 |
 |
| Parameter | Plot |
|---|---|
| CZT HV Monitor | 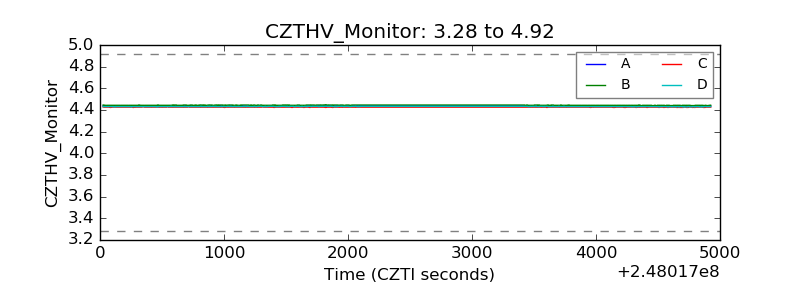 |
| D_VDD | 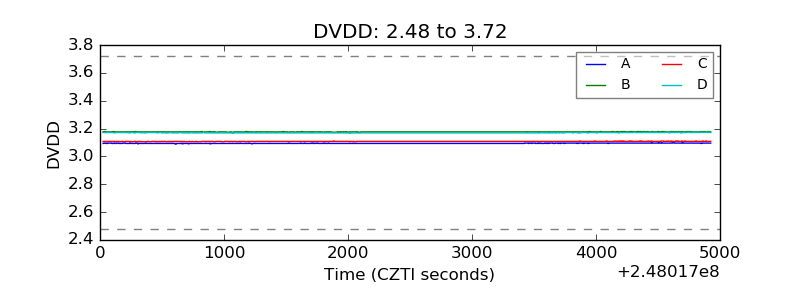 |
| Temperature 1 | 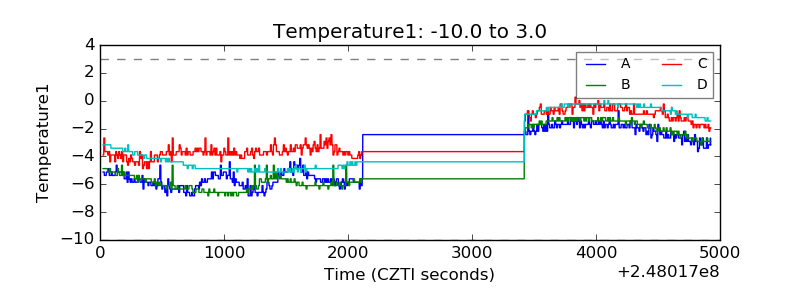 |
| Veto HV Monitor | 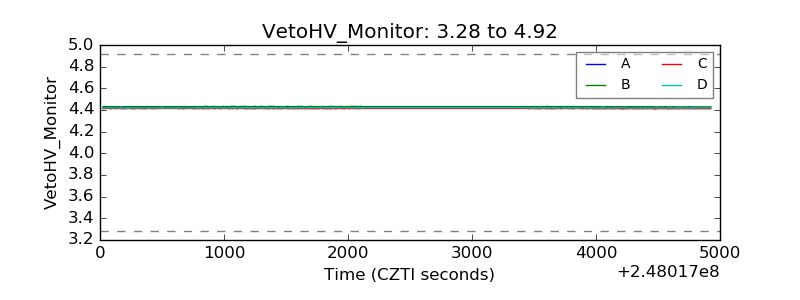 |
| Veto LLD | 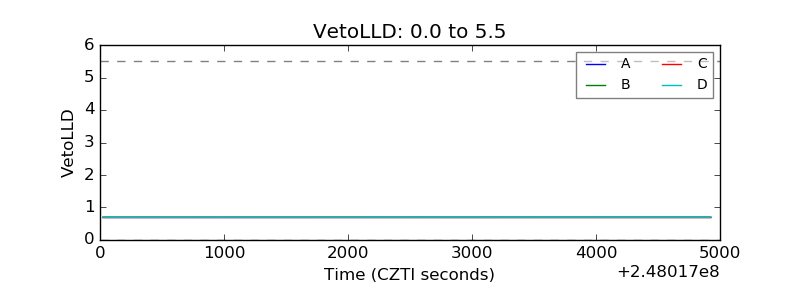 |
| Alpha Counter | 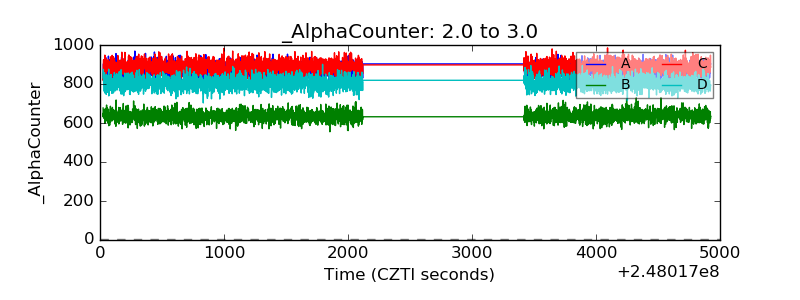 |
| _CPM_Rate | 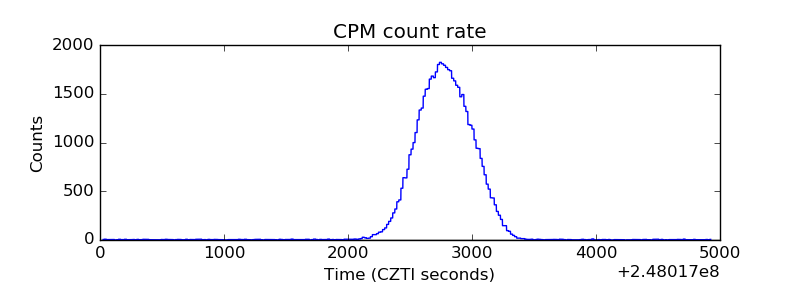 |
| CZT Counter | 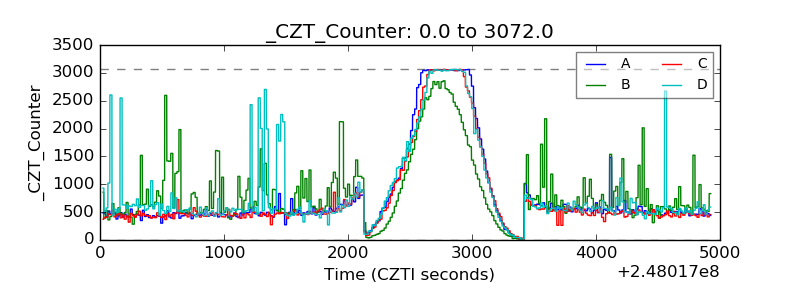 |
| +2.5 Volts monitor |  |
| +5 Volts monitor |  |
| _ROLL_ROT | 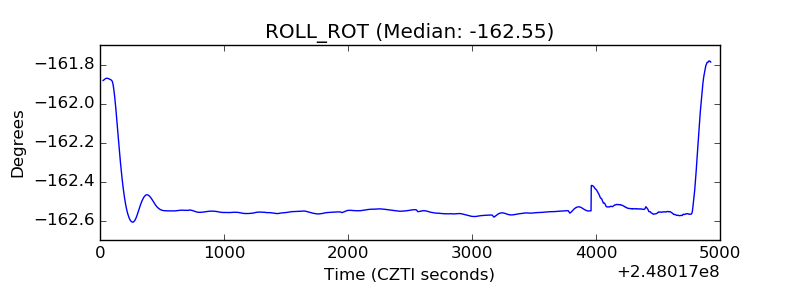 |
| _Roll_DEC | 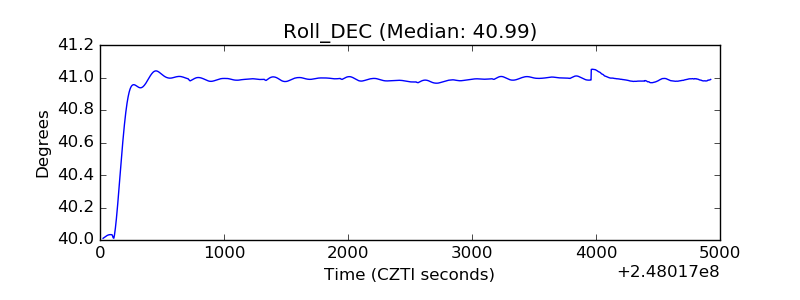 |
| _Roll_RA | 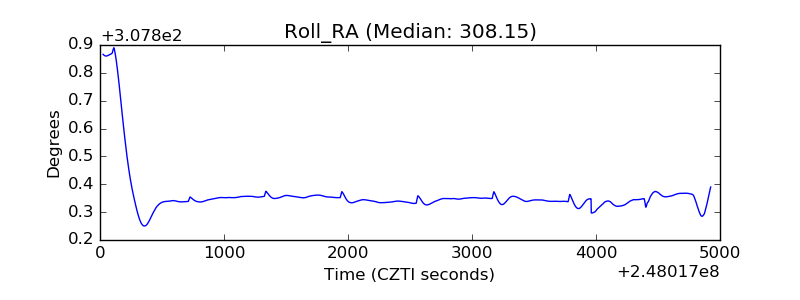 |
| Veto Counter | 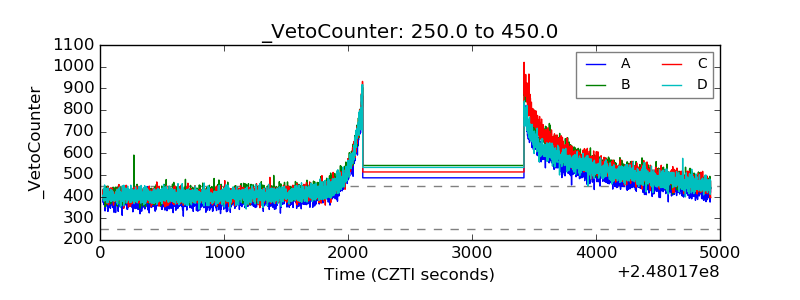 |