| Param | Original file | Final file |
|---|---|---|
| Filename | modeM0/AS1G08_032T01_9000001680_11464cztM0_level2.evt | modeM0/AS1G08_032T01_9000001680_11464cztM0_level2_quad_clean.evt |
| Size (bytes) | 498,608,640 | 86,670,720 |
| Size | 475.5 MB | 82.7 MB |
| Events in quadrant A | 2,990,330 | 567,293 |
| Events in quadrant B | 4,558,902 | 547,095 |
| Events in quadrant C | 2,923,794 | 558,302 |
| Events in quadrant D | 4,217,775 | 530,226 |
| Mode M0 | |||
|---|---|---|---|
| Quadrant | BADHDUFLAG | Total packets | Discarded packets |
| A | 0 | 12672 | 2 |
| B | 0 | 17606 | 1 |
| C | 0 | 12636 | 1 |
| D | 0 | 16439 | 1 |
| Mode M9 | |||
|---|---|---|---|
| Quadrant | BADHDUFLAG | Total packets | Discarded packets |
| A | 0 | 13 | 0 |
| B | 0 | 13 | 0 |
| C | 0 | 13 | 0 |
| D | 0 | 13 | 0 |
| Mode SS | |||
|---|---|---|---|
| Quadrant | BADHDUFLAG | Total packets | Discarded packets |
| A | 0 | 122 | 0 |
| B | 0 | 122 | 0 |
| C | 0 | 122 | 0 |
| D | 0 | 122 | 0 |
| Quadrant | Total seconds | Saturated seconds | Saturation percentage |
|---|---|---|---|
| A | 6039 | 71 | 1.175691% |
| B | 6039 | 362 | 5.994370% |
| C | 6039 | 43 | 0.712038% |
| D | 6039 | 358 | 5.928134% |
Noise dominated data is calculated using 1-second bins in cleaned event files. If a bin has >2000 counts, and if more than 50% of those come from <1% of pixels, then it is considered to be noise-dominated and hence unusable.
| Quadrant | # 1 sec bins | Bins with >0 counts | Bins with >2000 counts | High rate bins dominated by noise | Noise dominated (total time) | Noise dominated (detector-on time) | Marked lightcurve |
|---|---|---|---|---|---|---|---|
| A | 7325 | 6041 | 4 | 4 | 0.05% | 0.07% | 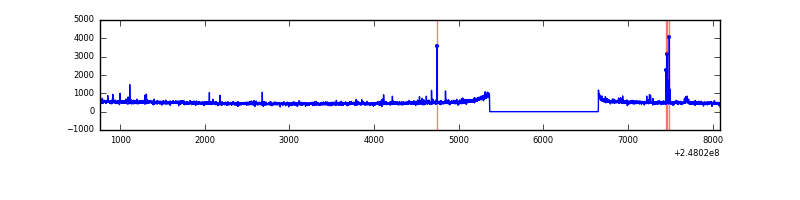 |
| B | 7325 | 6041 | 194 | 194 | 2.65% | 3.21% | 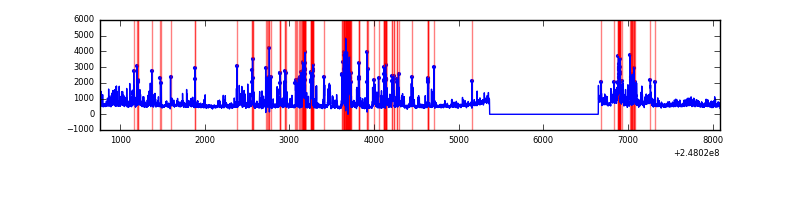 |
| C | 7325 | 6041 | 0 | 0 | 0.00% | 0.00% | 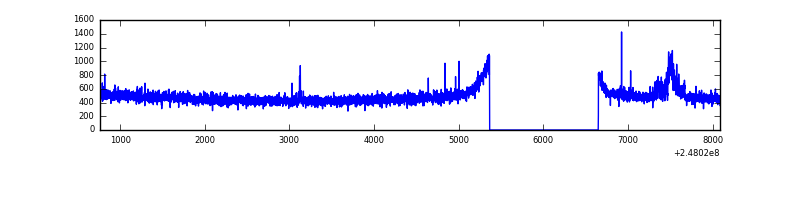 |
| D | 7325 | 6041 | 256 | 256 | 3.49% | 4.24% | 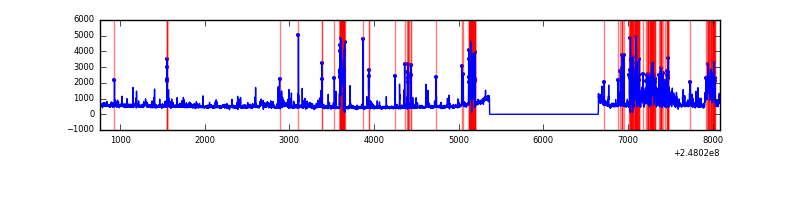 |
Top three noisy pixels from each quadrant. If the there are fewer than three noisy pixels in the level2.evt file, extra rows are filled as -1
| Pixel properties | Quadrant properties | ||||||
|---|---|---|---|---|---|---|---|
| Quadrant | DetID | PixID | Counts | Sigma | Mean | Median | Sigma |
| A | 9 | 143 | 43049 | 278.86 | 749 | 733 | 151.7 |
| A | 1 | 162 | 19238 | 121.95 | 749 | 733 | 151.7 |
| A | 1 | 178 | 10162 | 62.13 | 749 | 733 | 151.7 |
| B | 3 | 64 | 671292 | 4905.58 | 729 | 712 | 136.7 |
| B | 4 | 239 | 516577 | 3773.78 | 729 | 712 | 136.7 |
| B | 15 | 204 | 208582 | 1520.66 | 729 | 712 | 136.7 |
| C | 3 | 9 | 70548 | 411.7 | 730 | 737 | 169.6 |
| C | 12 | 4 | 5659 | 29.02 | 730 | 737 | 169.6 |
| C | 13 | 61 | 5297 | 26.89 | 730 | 737 | 169.6 |
| D | 13 | 104 | 524740 | 3071.17 | 713 | 696 | 170.6 |
| D | 1 | 52 | 373141 | 2182.72 | 713 | 696 | 170.6 |
| D | 10 | 253 | 348102 | 2035.98 | 713 | 696 | 170.6 |
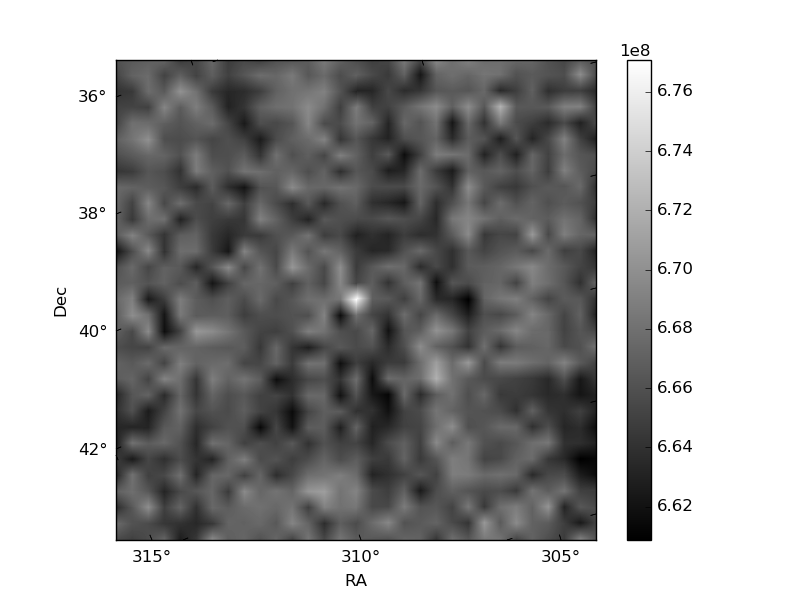
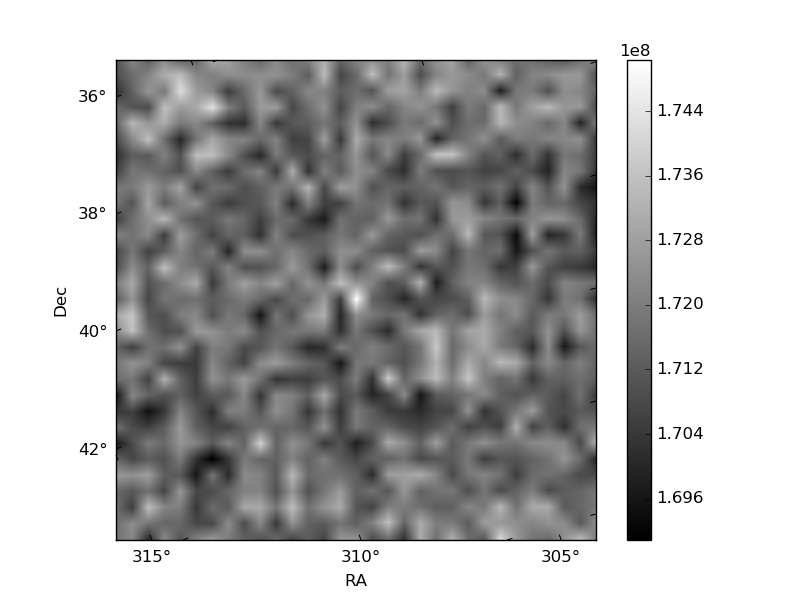
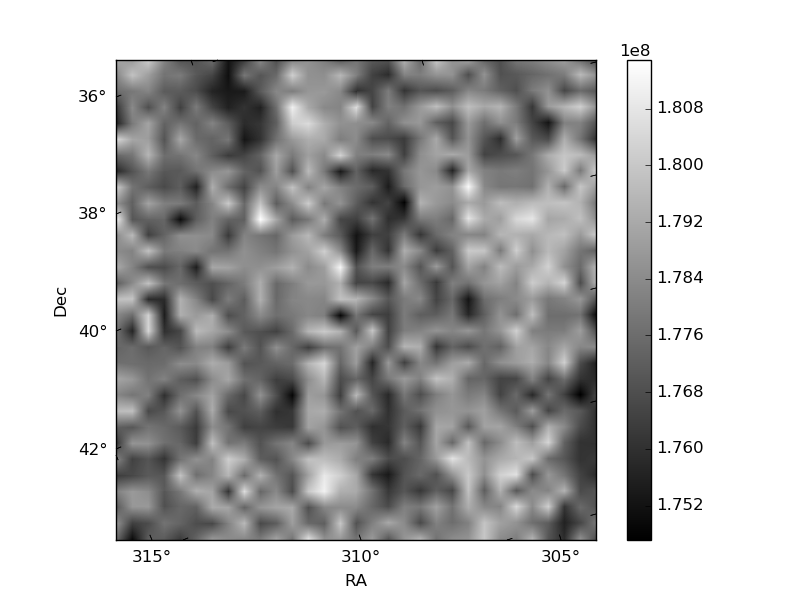
Histogram calculated using DETX and DETY for each event in the final _common_clean file
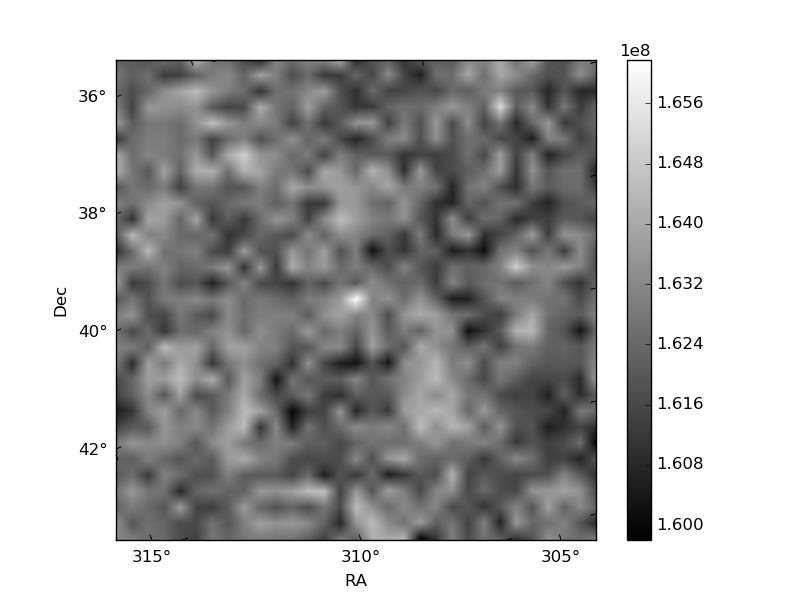
| Quadrant A | 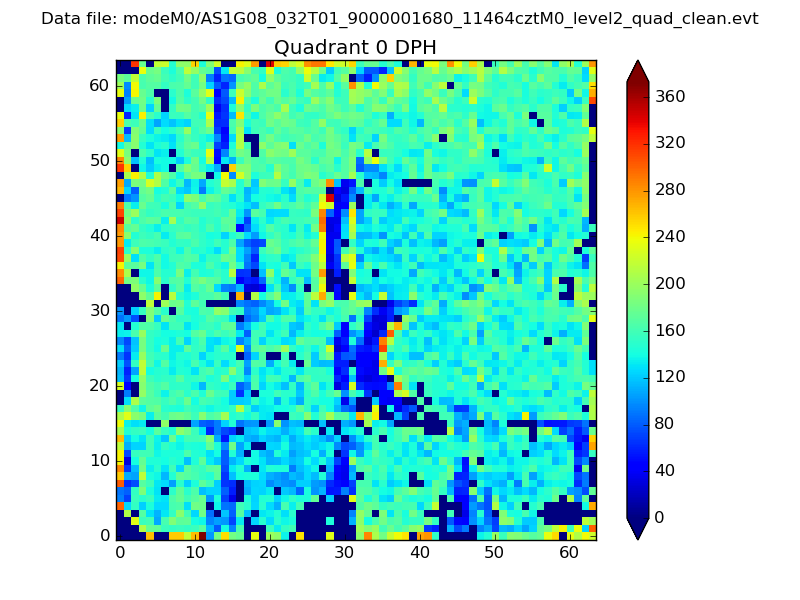 |
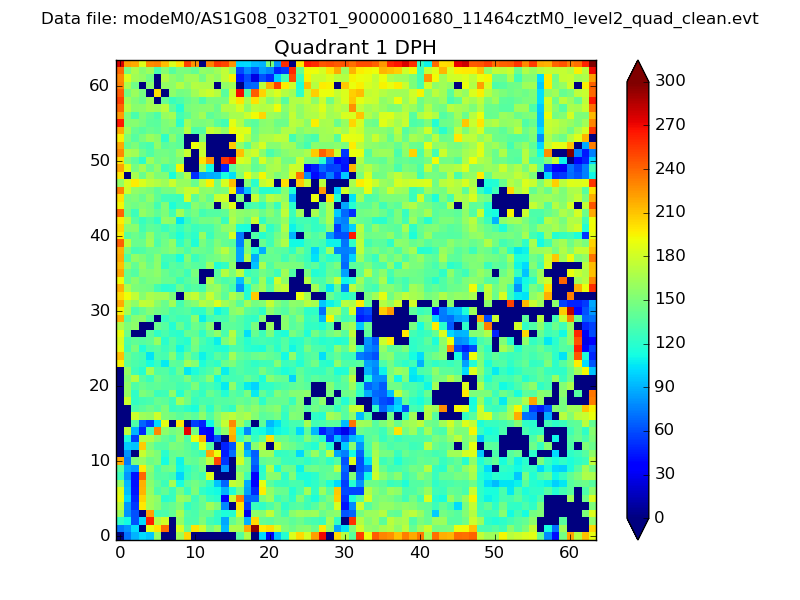 |
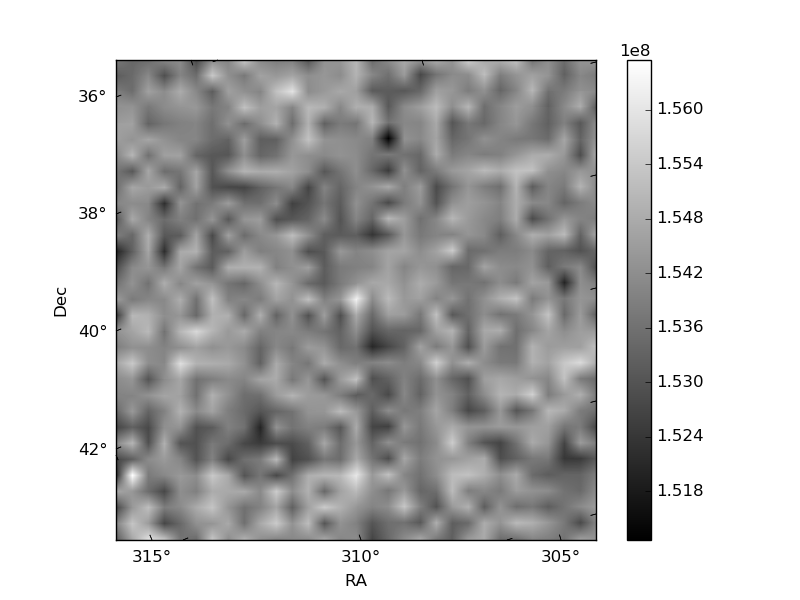
Quadrant B |
|---|---|---|---|
| Quadrant D | 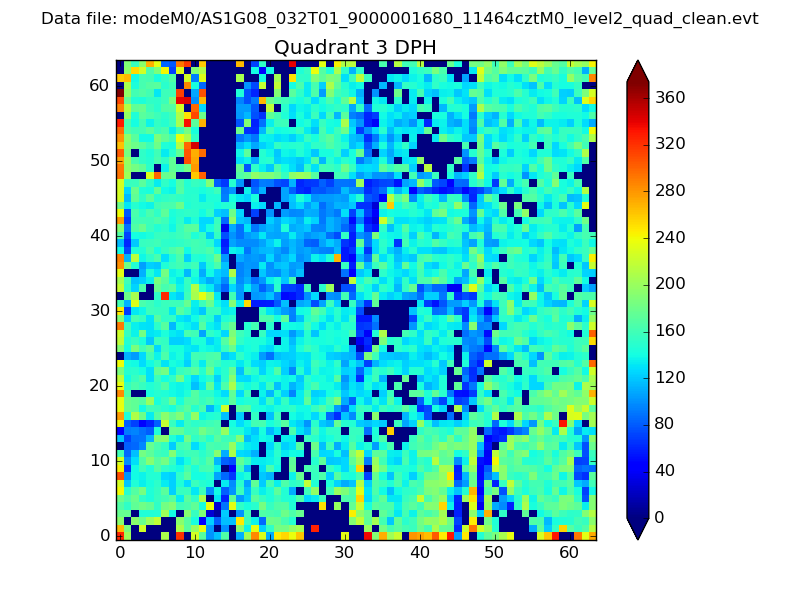 |
 |
Quadrant C |
| Plot type | Count rate plots | Images |
|---|---|---|
| Comparison with Poisson distribution Blue bars denote a histogram of data divided into 1 sec bins. Red curve is a Poisson curve with rate = median count rate of data. |
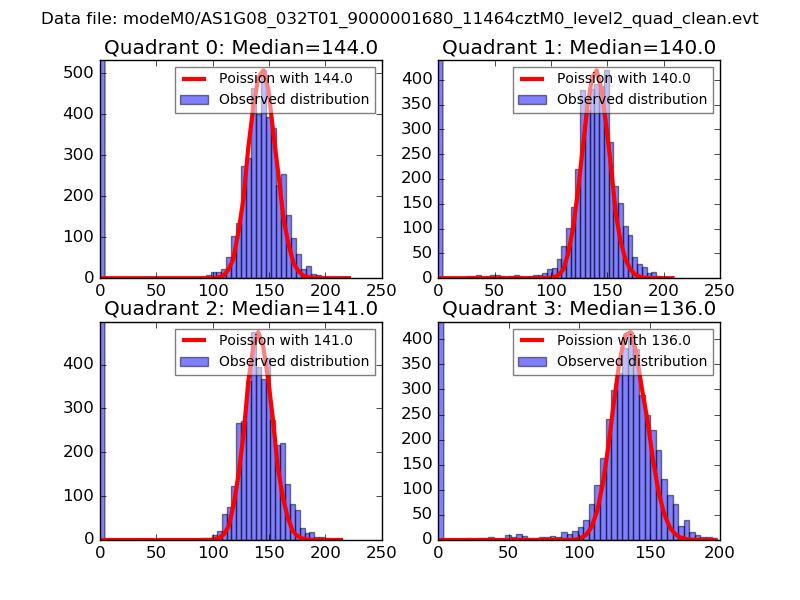 |
 |
| Quadrant-wise count rates Data is divided into 100 sec bins |
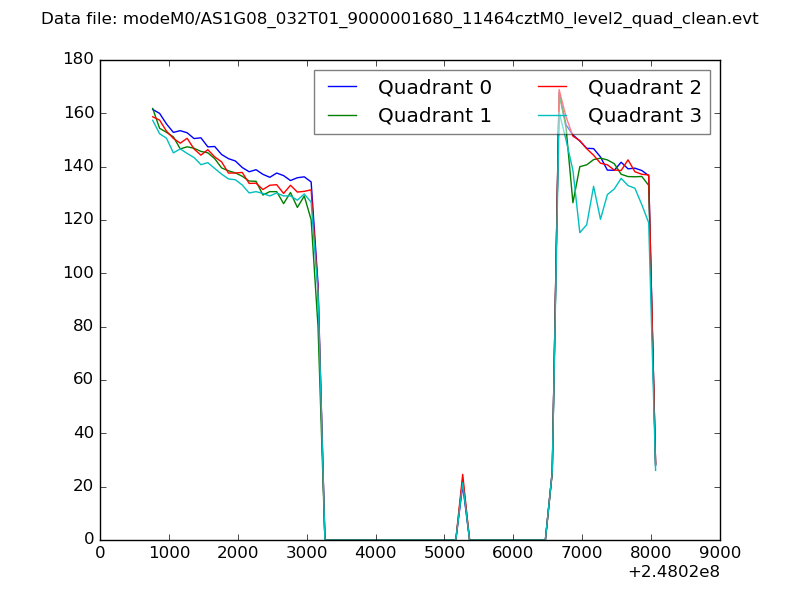 |
|
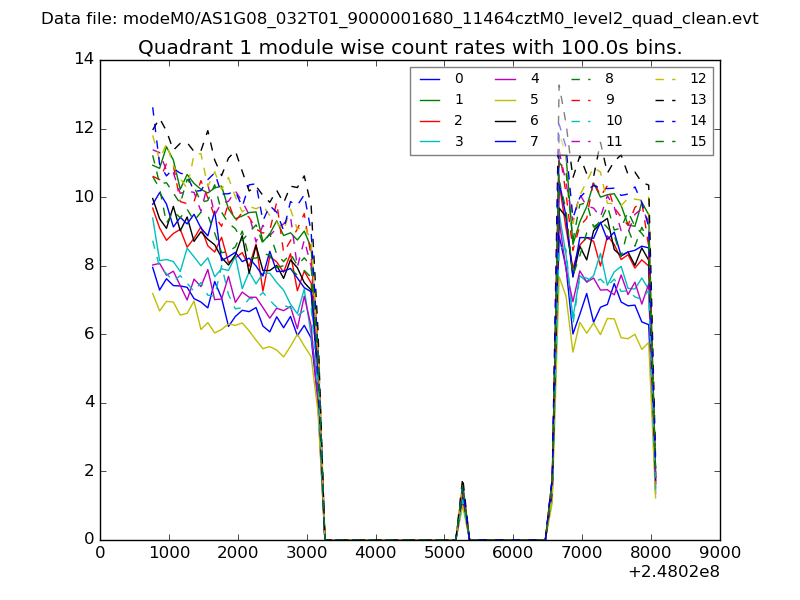
| Module-wise count rates for Quadrant A Data is divided into 100 sec bins |
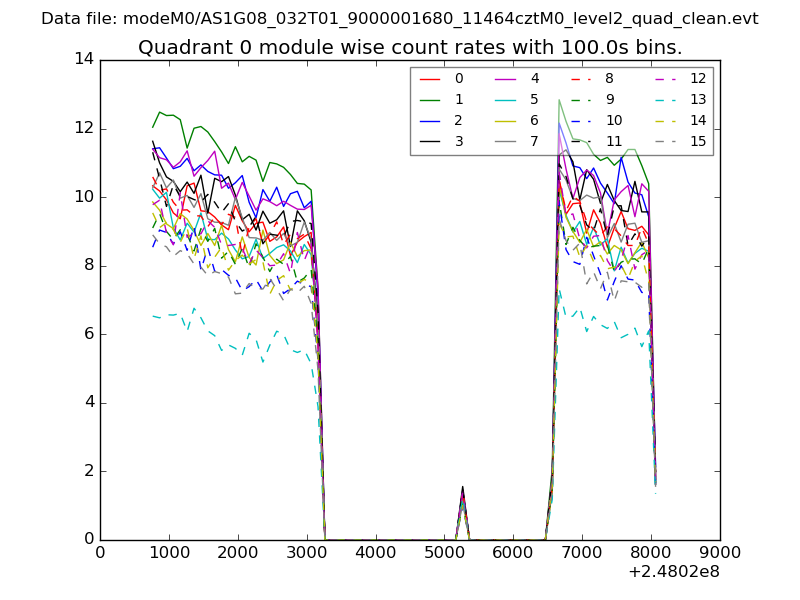 |
 |
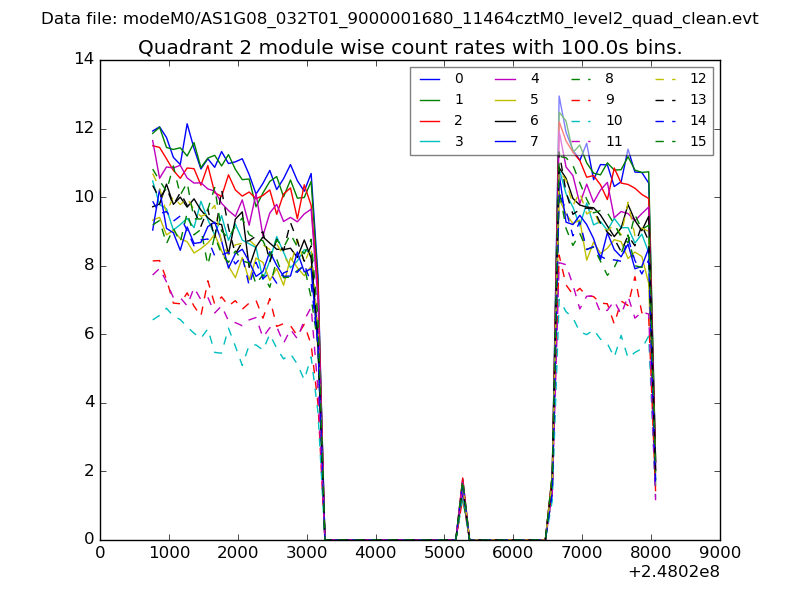
| Module-wise count rates for Quadrant B Data is divided into 100 sec bins |
 |
 |
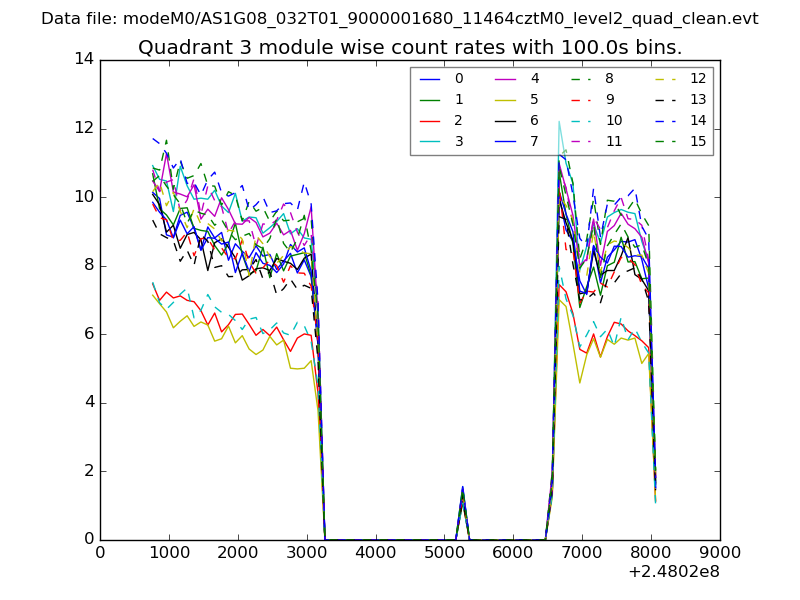
| Module-wise count rates for Quadrant C Data is divided into 100 sec bins |
 |
 |
| Module-wise count rates for Quadrant D Data is divided into 100 sec bins |
 |
 |
| Parameter | Plot |
|---|---|
| CZT HV Monitor | 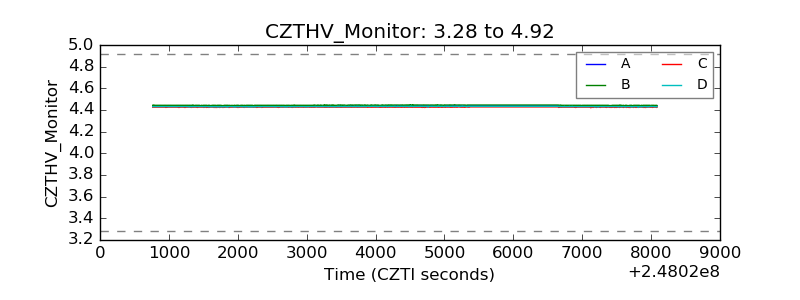 |
| D_VDD | 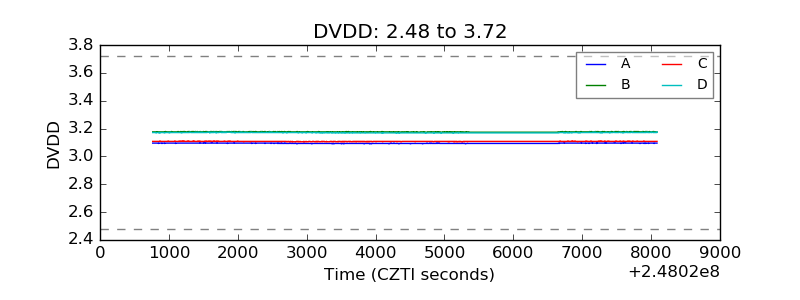 |
| Temperature 1 | 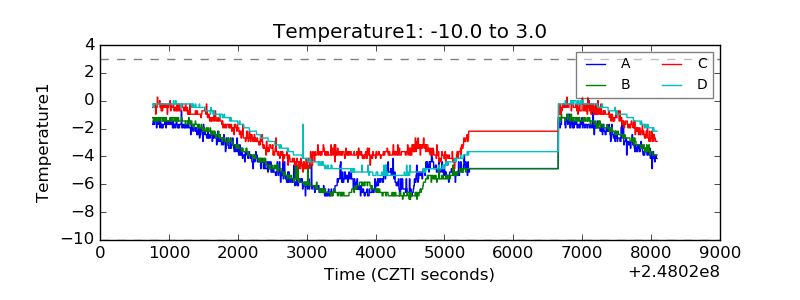 |
| Veto HV Monitor | 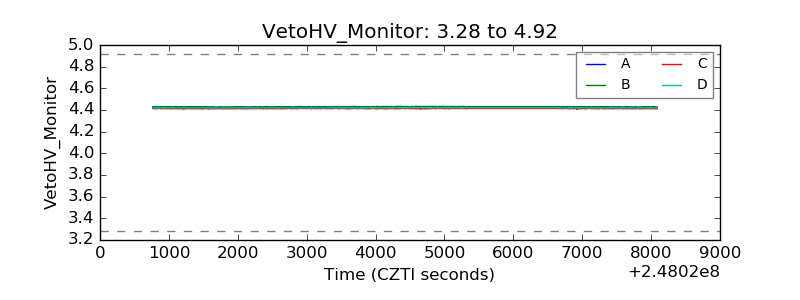 |
| Veto LLD | 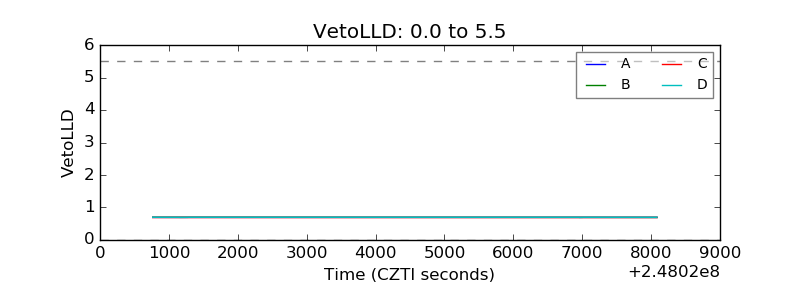 |
| Alpha Counter | 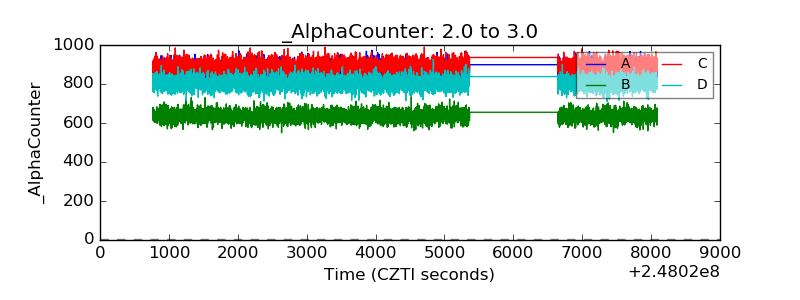 |
| _CPM_Rate | 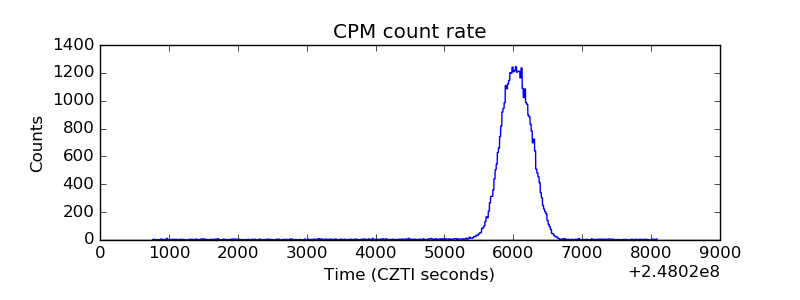 |
| CZT Counter |  |
| +2.5 Volts monitor |  |
| +5 Volts monitor |  |
| _ROLL_ROT | 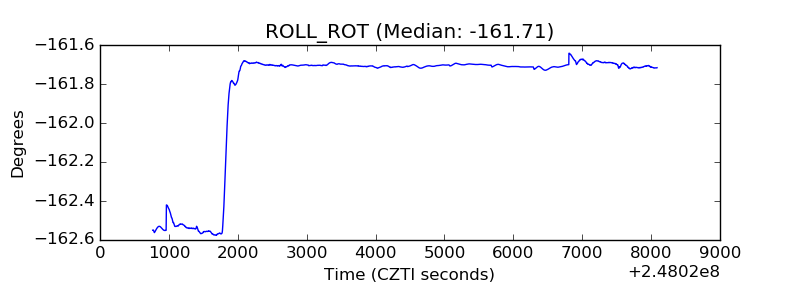 |
| _Roll_DEC | 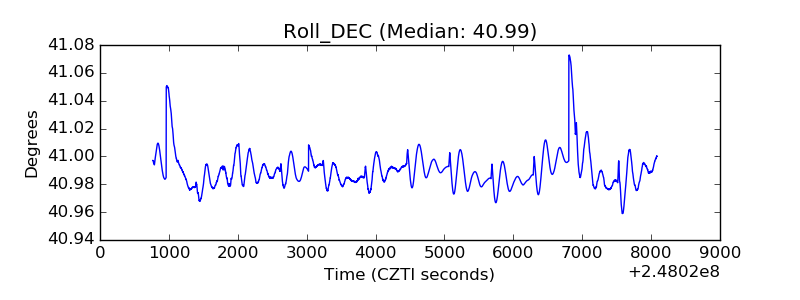 |
| _Roll_RA | 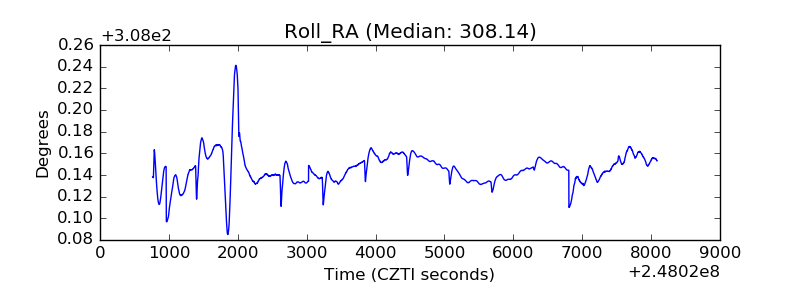 |
| Veto Counter | 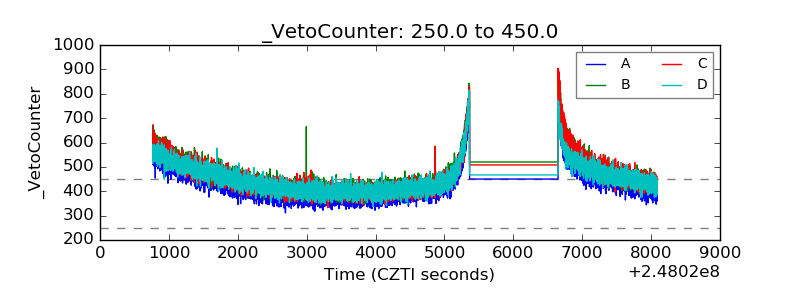 |