| Param | Original file | Final file |
|---|---|---|
| Filename | modeM0/AS1G08_032T01_9000001680_11465cztM0_level2.evt | modeM0/AS1G08_032T01_9000001680_11465cztM0_level2_quad_clean.evt |
| Size (bytes) | 493,787,520 | 89,645,760 |
| Size | 470.9 MB | 85.5 MB |
| Events in quadrant A | 3,112,042 | 582,272 |
| Events in quadrant B | 4,206,705 | 568,277 |
| Events in quadrant C | 3,046,486 | 579,607 |
| Events in quadrant D | 4,159,667 | 542,744 |
| Mode M0 | |||
|---|---|---|---|
| Quadrant | BADHDUFLAG | Total packets | Discarded packets |
| A | 0 | 13437 | 3 |
| B | 0 | 16732 | 2 |
| C | 0 | 13348 | 2 |
| D | 0 | 16558 | 2 |
| Mode M9 | |||
|---|---|---|---|
| Quadrant | BADHDUFLAG | Total packets | Discarded packets |
| A | 0 | 13 | 0 |
| B | 0 | 13 | 0 |
| C | 0 | 13 | 0 |
| D | 0 | 14 | 0 |
| Mode SS | |||
|---|---|---|---|
| Quadrant | BADHDUFLAG | Total packets | Discarded packets |
| A | 0 | 130 | 0 |
| B | 0 | 130 | 0 |
| C | 0 | 130 | 0 |
| D | 0 | 130 | 0 |
| Quadrant | Total seconds | Saturated seconds | Saturation percentage |
|---|---|---|---|
| A | 6325 | 68 | 1.075099% |
| B | 6325 | 235 | 3.715415% |
| C | 6325 | 50 | 0.790514% |
| D | 6325 | 254 | 4.015810% |
Noise dominated data is calculated using 1-second bins in cleaned event files. If a bin has >2000 counts, and if more than 50% of those come from <1% of pixels, then it is considered to be noise-dominated and hence unusable.
| Quadrant | # 1 sec bins | Bins with >0 counts | Bins with >2000 counts | High rate bins dominated by noise | Noise dominated (total time) | Noise dominated (detector-on time) | Marked lightcurve |
|---|---|---|---|---|---|---|---|
| A | 7446 | 6328 | 4 | 4 | 0.05% | 0.06% | 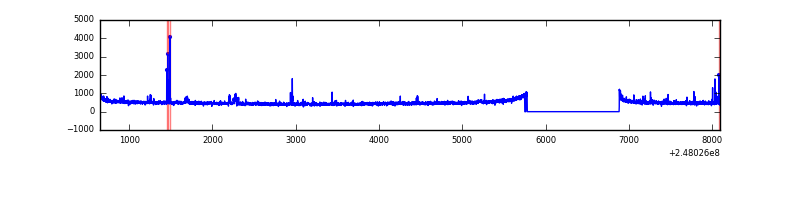 |
| B | 7446 | 6328 | 94 | 94 | 1.26% | 1.49% | 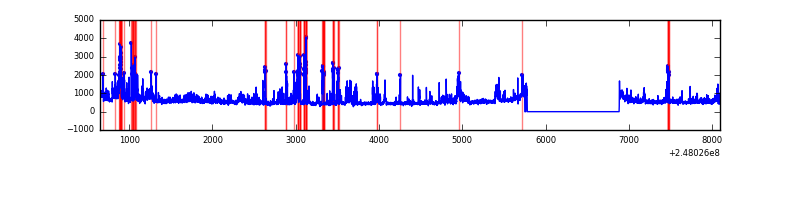 |
| C | 7446 | 6328 | 3 | 3 | 0.04% | 0.05% | 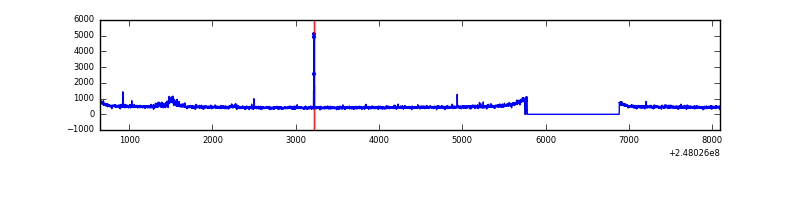 |
| D | 7446 | 6328 | 190 | 190 | 2.55% | 3.00% | 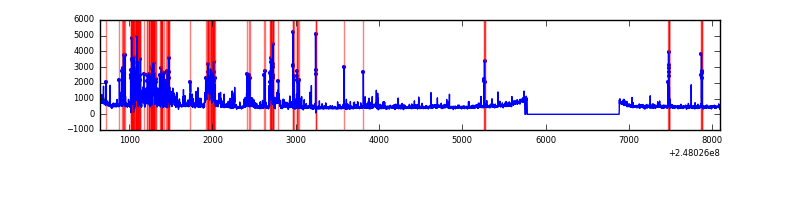 |
Top three noisy pixels from each quadrant. If the there are fewer than three noisy pixels in the level2.evt file, extra rows are filled as -1
| Pixel properties | Quadrant properties | ||||||
|---|---|---|---|---|---|---|---|
| Quadrant | DetID | PixID | Counts | Sigma | Mean | Median | Sigma |
| A | 9 | 143 | 45302 | 285.71 | 771 | 755 | 155.9 |
| A | 13 | 251 | 23889 | 148.38 | 771 | 755 | 155.9 |
| A | 13 | 248 | 14425 | 87.68 | 771 | 755 | 155.9 |
| B | 4 | 239 | 488614 | 3416.81 | 759 | 740 | 142.8 |
| B | 3 | 64 | 273030 | 1906.98 | 759 | 740 | 142.8 |
| B | 15 | 204 | 219426 | 1531.56 | 759 | 740 | 142.8 |
| C | 3 | 9 | 77696 | 437.78 | 756 | 761 | 175.7 |
| C | 5 | 239 | 21325 | 117.02 | 756 | 761 | 175.7 |
| C | 13 | 61 | 5415 | 26.48 | 756 | 761 | 175.7 |
| D | 13 | 104 | 627875 | 3460.17 | 746 | 726 | 181.2 |
| D | 1 | 52 | 503467 | 2773.78 | 746 | 726 | 181.2 |
| D | 2 | 120 | 61617 | 335.95 | 746 | 726 | 181.2 |
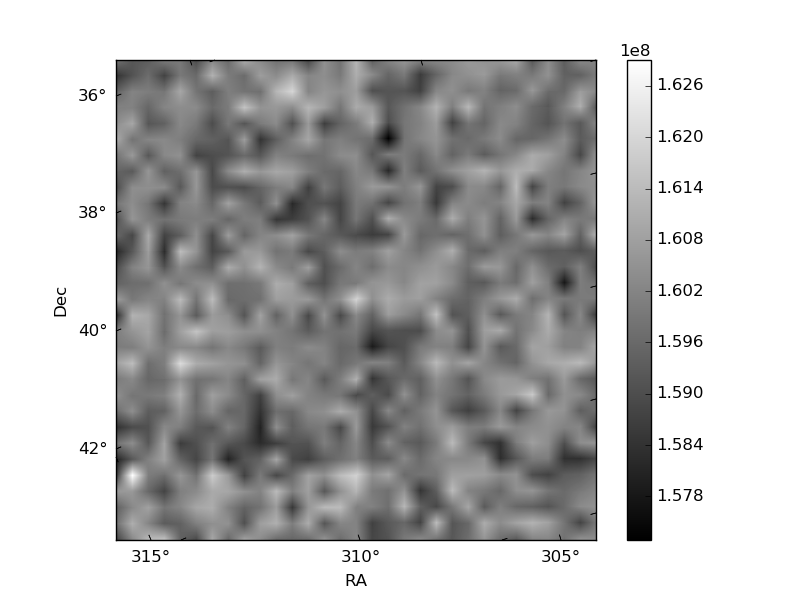
Histogram calculated using DETX and DETY for each event in the final _common_clean file
| Quadrant A | 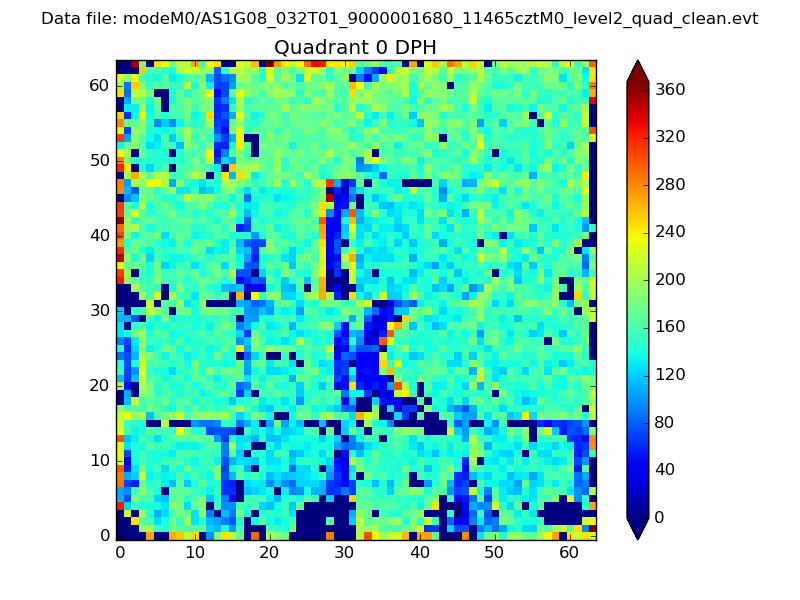 |
 |
Quadrant B |
|---|---|---|---|
| Quadrant D | 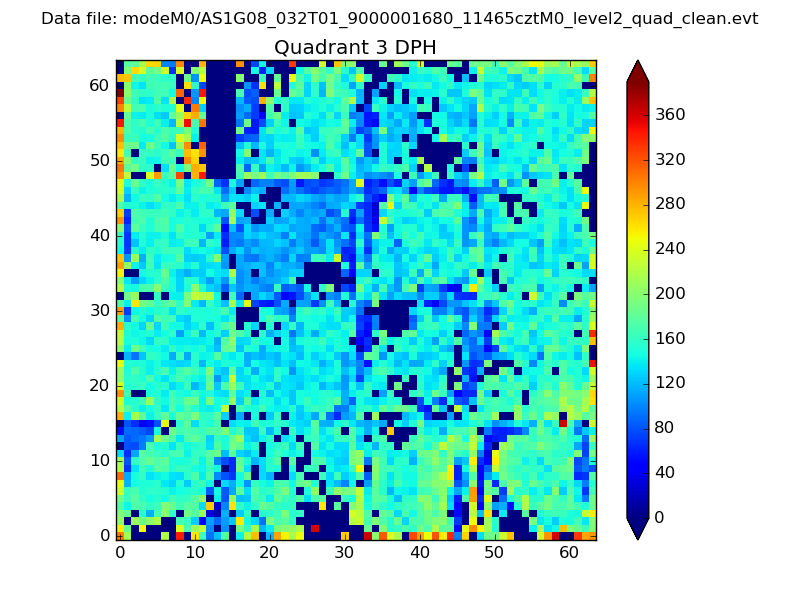 |
 |
Quadrant C |
| Plot type | Count rate plots | Images |
|---|---|---|
| Comparison with Poisson distribution Blue bars denote a histogram of data divided into 1 sec bins. Red curve is a Poisson curve with rate = median count rate of data. |
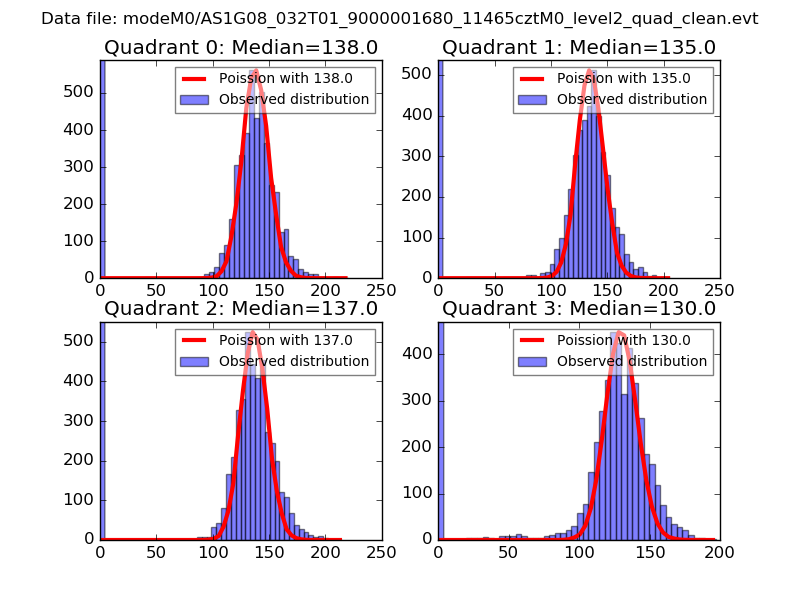 |
 |
| Quadrant-wise count rates Data is divided into 100 sec bins |
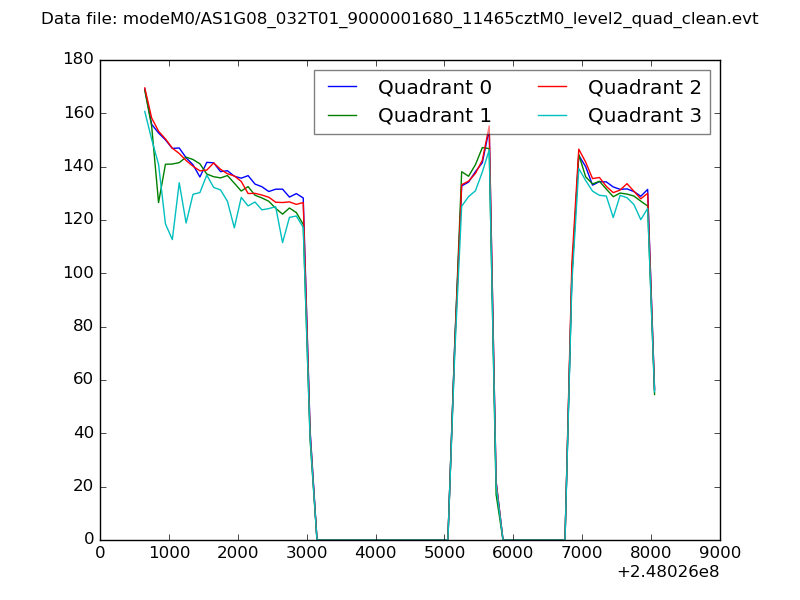 |
|
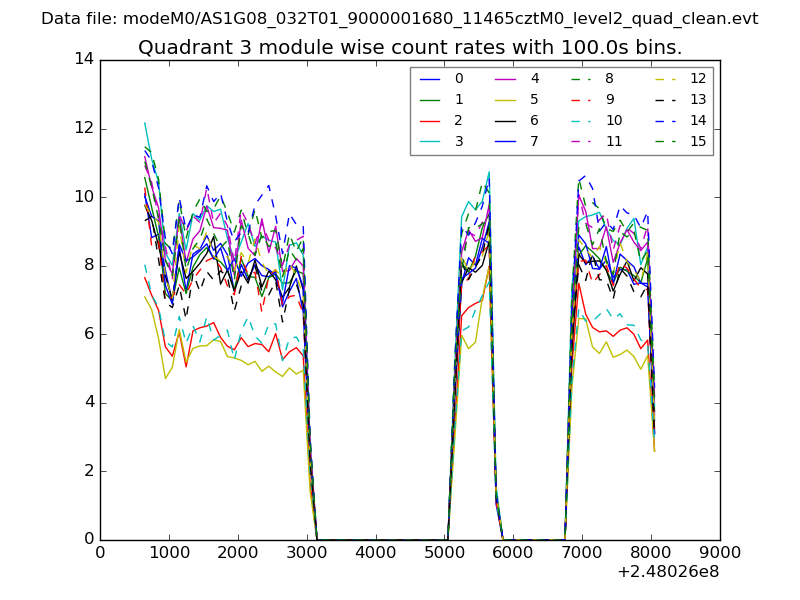
| Module-wise count rates for Quadrant A Data is divided into 100 sec bins |
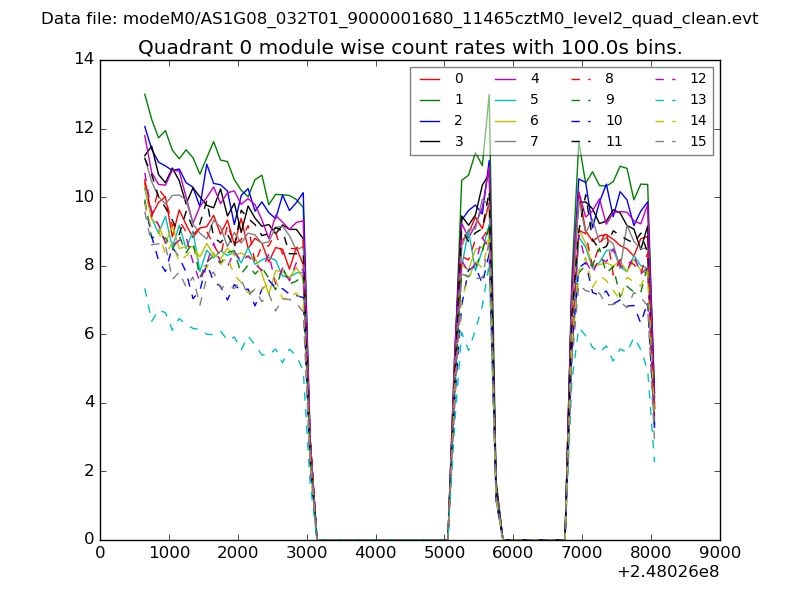 |
 |
| Module-wise count rates for Quadrant B Data is divided into 100 sec bins |
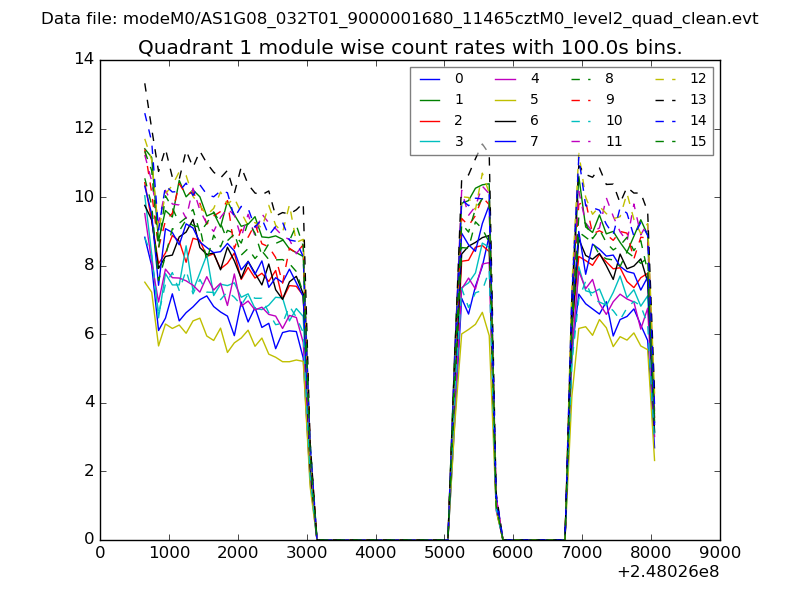 |
 |
| Module-wise count rates for Quadrant C Data is divided into 100 sec bins |
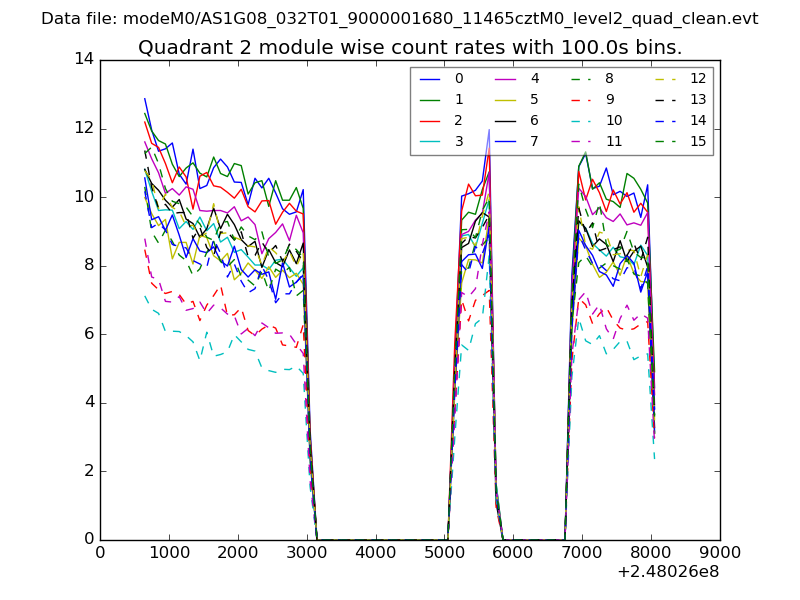 |
 |
| Module-wise count rates for Quadrant D Data is divided into 100 sec bins |
 |
 |
| Parameter | Plot |
|---|---|
| CZT HV Monitor | 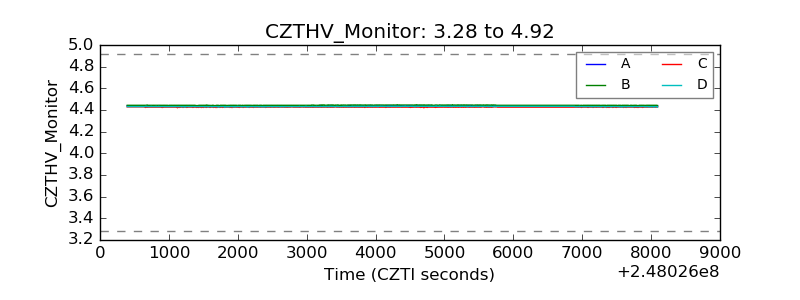 |
| D_VDD | 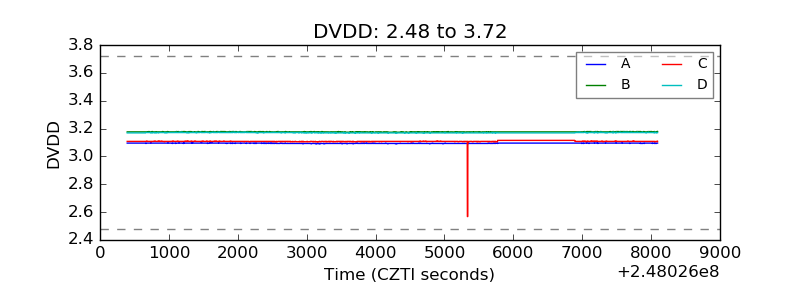 |
| Temperature 1 | 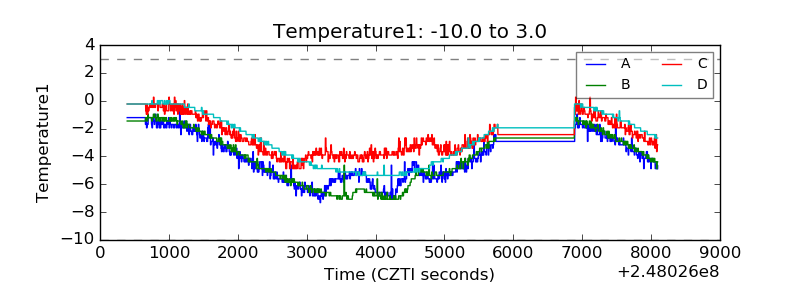 |
| Veto HV Monitor | 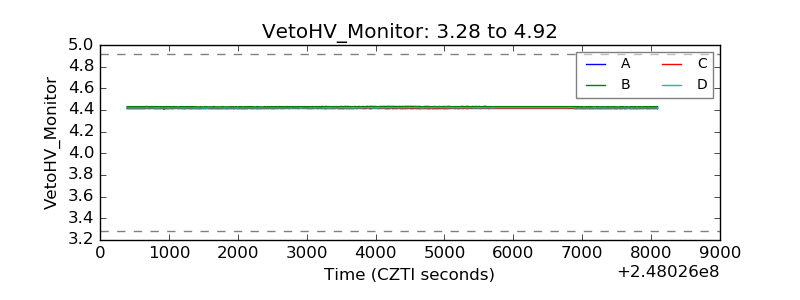 |
| Veto LLD | 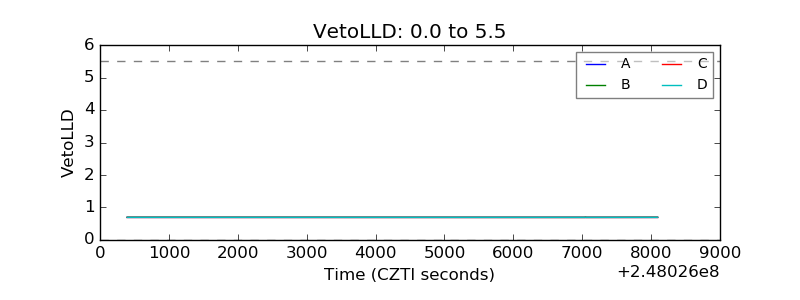 |
| Alpha Counter | 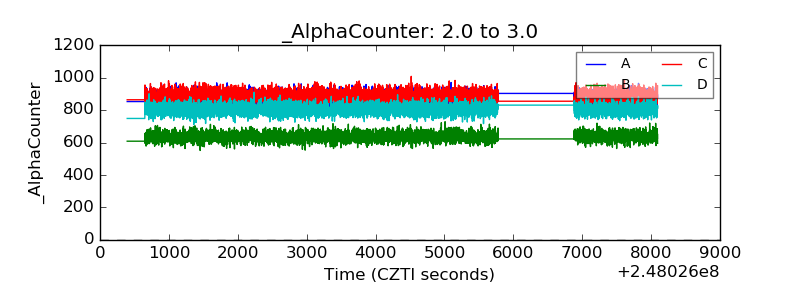 |
| _CPM_Rate | 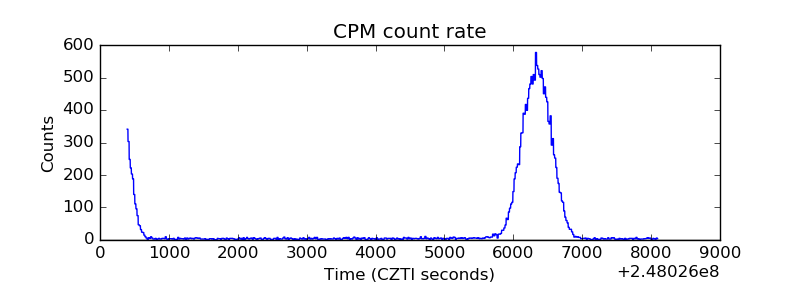 |
| CZT Counter | 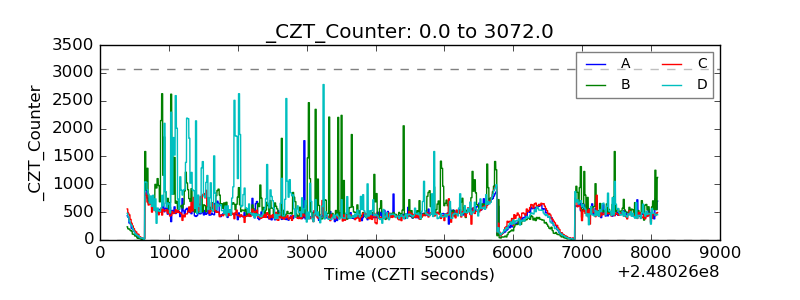 |
| +2.5 Volts monitor |  |
| +5 Volts monitor |  |
| _ROLL_ROT | 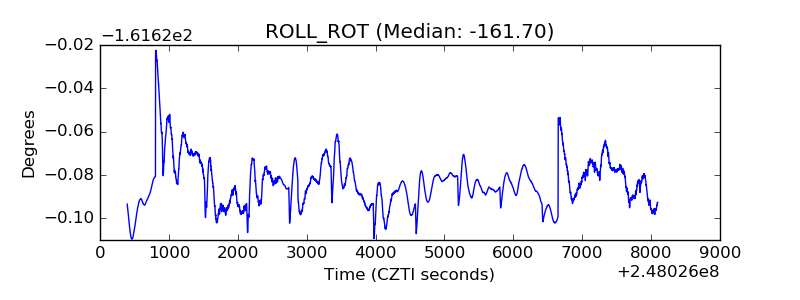 |
| _Roll_DEC | 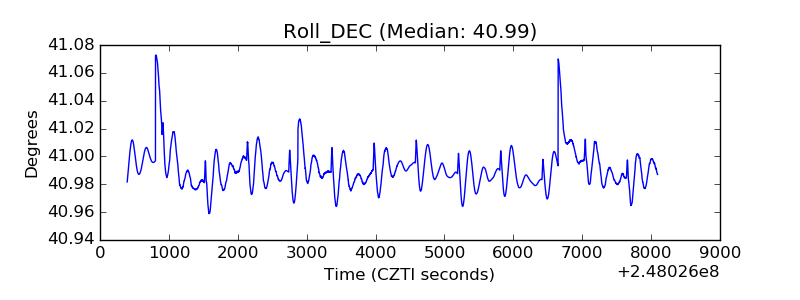 |
| _Roll_RA | 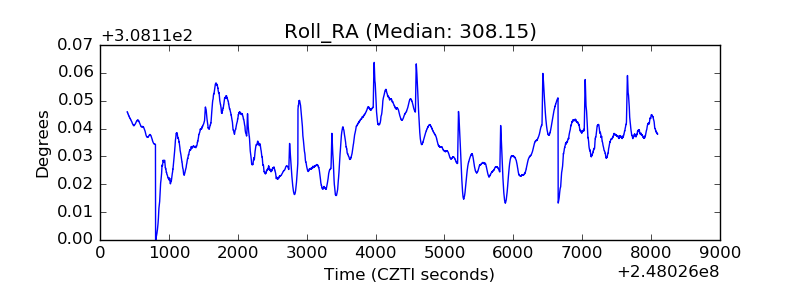 |
| Veto Counter | 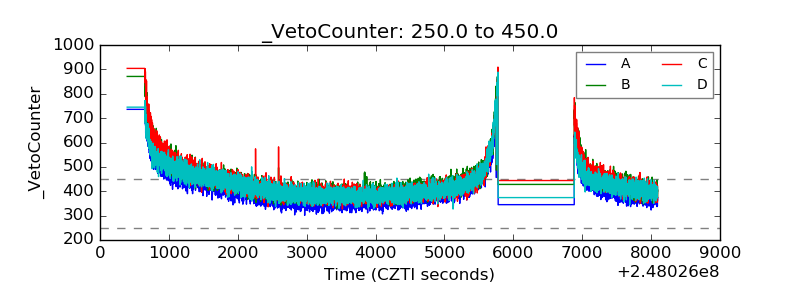 |