| Param | Original file | Final file |
|---|---|---|
| Filename | modeM0/AS1G08_032T01_9000001680_11466cztM0_level2.evt | modeM0/AS1G08_032T01_9000001680_11466cztM0_level2_quad_clean.evt |
| Size (bytes) | 526,334,400 | 97,263,360 |
| Size | 502.0 MB | 92.8 MB |
| Events in quadrant A | 3,396,572 | 632,576 |
| Events in quadrant B | 4,942,381 | 609,716 |
| Events in quadrant C | 3,130,584 | 625,929 |
| Events in quadrant D | 4,004,315 | 598,354 |
| Mode M0 | |||
|---|---|---|---|
| Quadrant | BADHDUFLAG | Total packets | Discarded packets |
| A | 0 | 14711 | 3 |
| B | 0 | 19168 | 2 |
| C | 0 | 14104 | 2 |
| D | 0 | 16655 | 2 |
| Mode M9 | |||
|---|---|---|---|
| Quadrant | BADHDUFLAG | Total packets | Discarded packets |
| A | 0 | 7 | 0 |
| B | 0 | 7 | 0 |
| C | 0 | 7 | 0 |
| D | 0 | 7 | 0 |
| Mode SS | |||
|---|---|---|---|
| Quadrant | BADHDUFLAG | Total packets | Discarded packets |
| A | 0 | 142 | 0 |
| B | 0 | 142 | 0 |
| C | 0 | 142 | 0 |
| D | 0 | 142 | 0 |
| Quadrant | Total seconds | Saturated seconds | Saturation percentage |
|---|---|---|---|
| A | 6861 | 78 | 1.136861% |
| B | 6861 | 417 | 6.077831% |
| C | 6861 | 42 | 0.612156% |
| D | 6862 | 195 | 2.841737% |
Noise dominated data is calculated using 1-second bins in cleaned event files. If a bin has >2000 counts, and if more than 50% of those come from <1% of pixels, then it is considered to be noise-dominated and hence unusable.
| Quadrant | # 1 sec bins | Bins with >0 counts | Bins with >2000 counts | High rate bins dominated by noise | Noise dominated (total time) | Noise dominated (detector-on time) | Marked lightcurve |
|---|---|---|---|---|---|---|---|
| A | 7622 | 6863 | 8 | 8 | 0.10% | 0.12% | 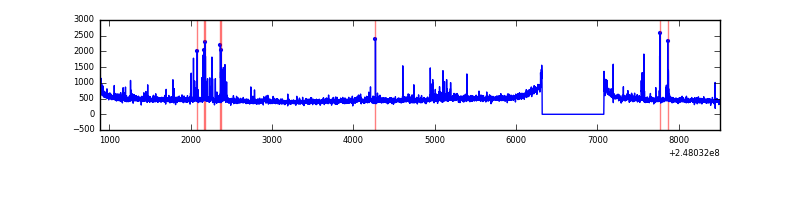 |
| B | 7622 | 6863 | 249 | 249 | 3.27% | 3.63% | 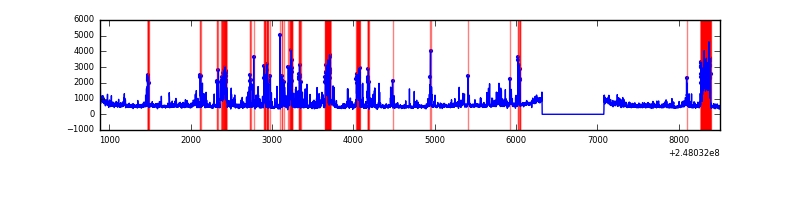 |
| C | 7622 | 6863 | 0 | 0 | 0.00% | 0.00% | 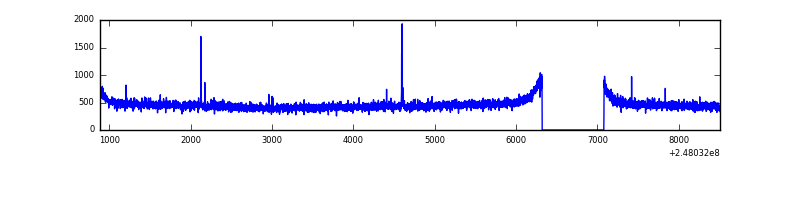 |
| D | 7623 | 6864 | 135 | 135 | 1.77% | 1.97% | 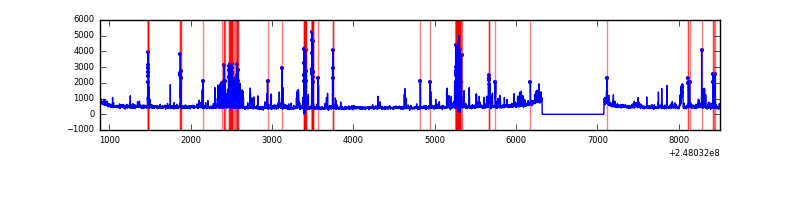 |
Top three noisy pixels from each quadrant. If the there are fewer than three noisy pixels in the level2.evt file, extra rows are filled as -1
| Pixel properties | Quadrant properties | ||||||
|---|---|---|---|---|---|---|---|
| Quadrant | DetID | PixID | Counts | Sigma | Mean | Median | Sigma |
| A | 13 | 248 | 80933 | 486.62 | 815 | 800 | 164.7 |
| A | 14 | 235 | 49391 | 295.08 | 815 | 800 | 164.7 |
| A | 9 | 143 | 32868 | 194.74 | 815 | 800 | 164.7 |
| B | 4 | 239 | 1052038 | 6995.48 | 794 | 777 | 150.3 |
| B | 15 | 204 | 297747 | 1976.15 | 794 | 777 | 150.3 |
| B | 3 | 64 | 264071 | 1752.06 | 794 | 777 | 150.3 |
| C | 5 | 239 | 11035 | 54.76 | 800 | 802 | 186.9 |
| C | 13 | 61 | 5733 | 26.39 | 800 | 802 | 186.9 |
| C | 12 | 4 | 2108 | 6.99 | 800 | 802 | 186.9 |
| D | 1 | 52 | 450853 | 2371.69 | 789 | 768 | 189.8 |
| D | 10 | 253 | 281945 | 1481.64 | 789 | 768 | 189.8 |
| D | 2 | 120 | 142679 | 747.79 | 789 | 768 | 189.8 |
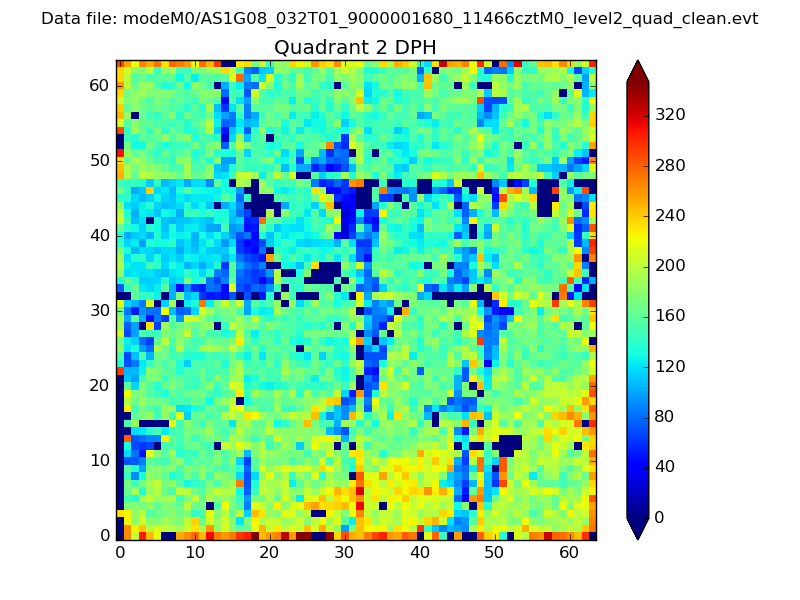
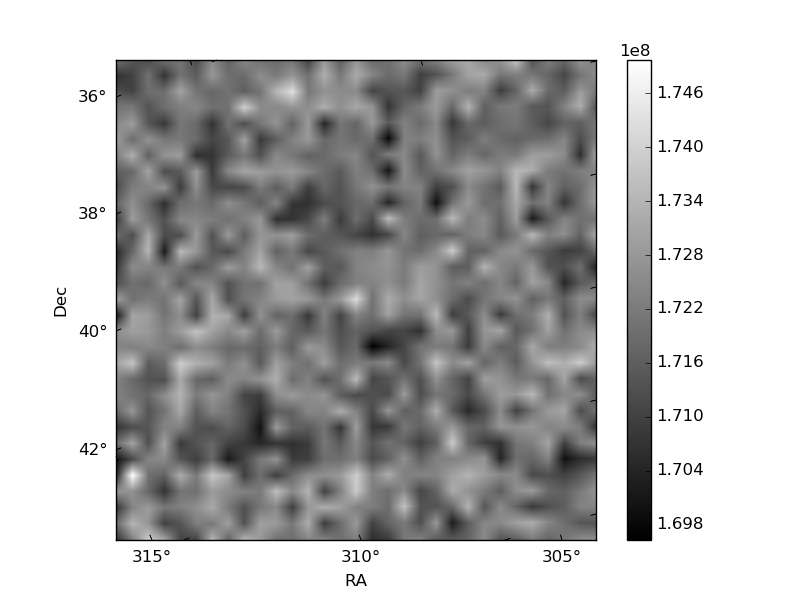
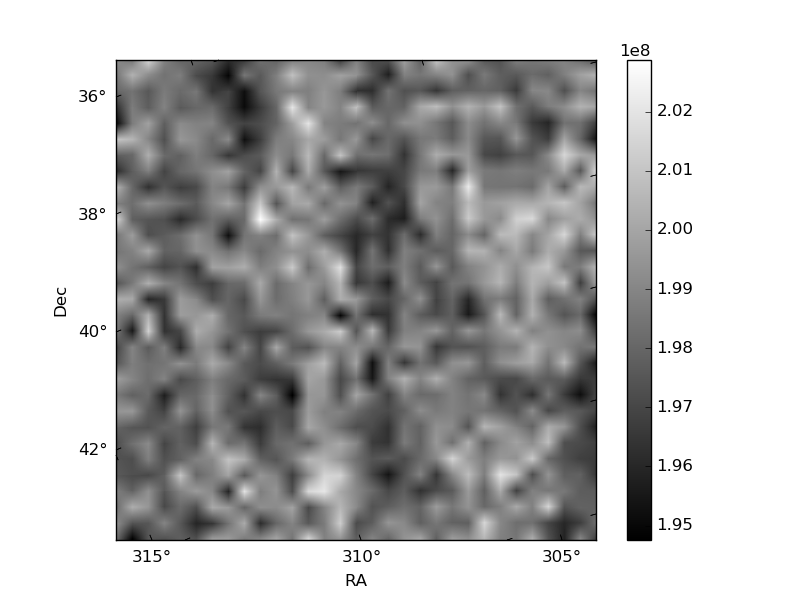
Histogram calculated using DETX and DETY for each event in the final _common_clean file
| Quadrant A | 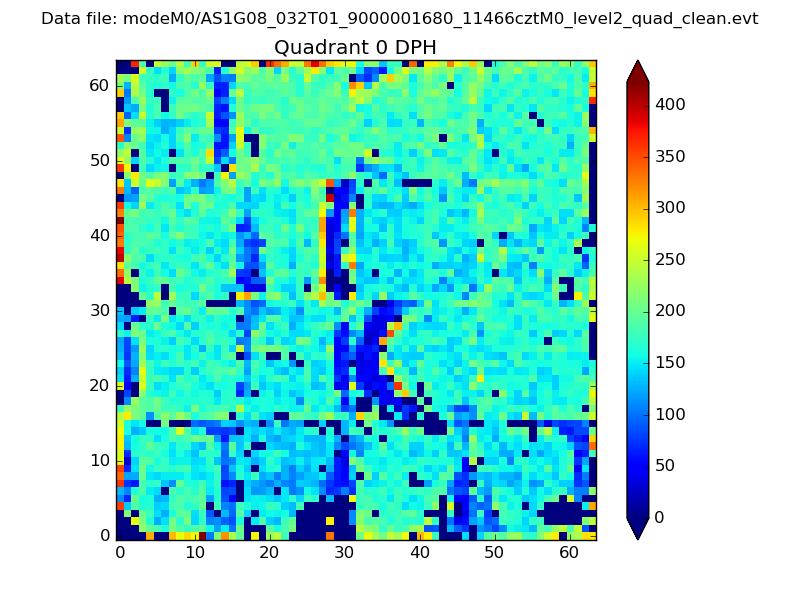 |
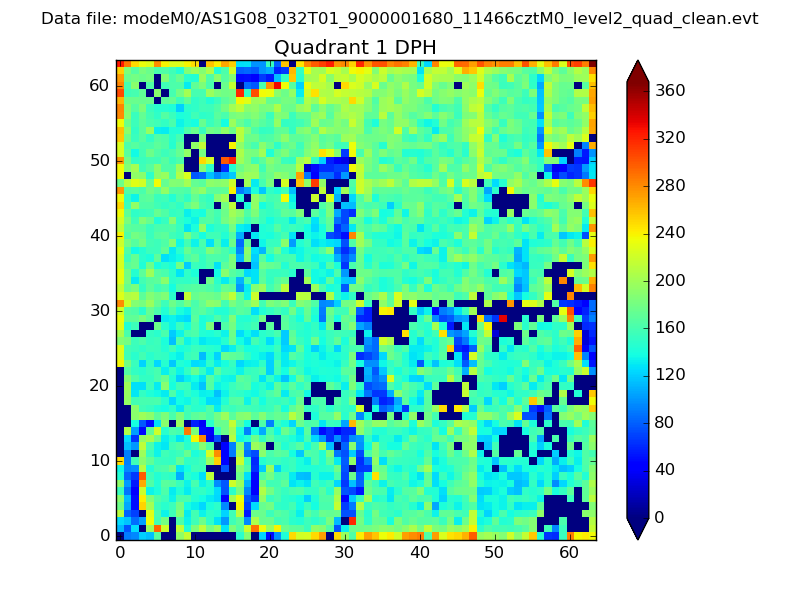 |
Quadrant B |
|---|---|---|---|
| Quadrant D | 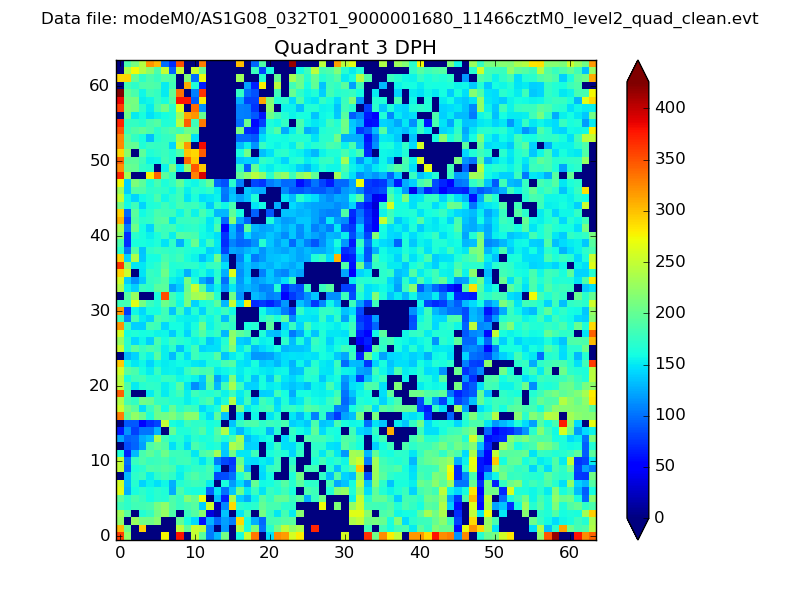 |
 |
Quadrant C |
| Plot type | Count rate plots | Images |
|---|---|---|
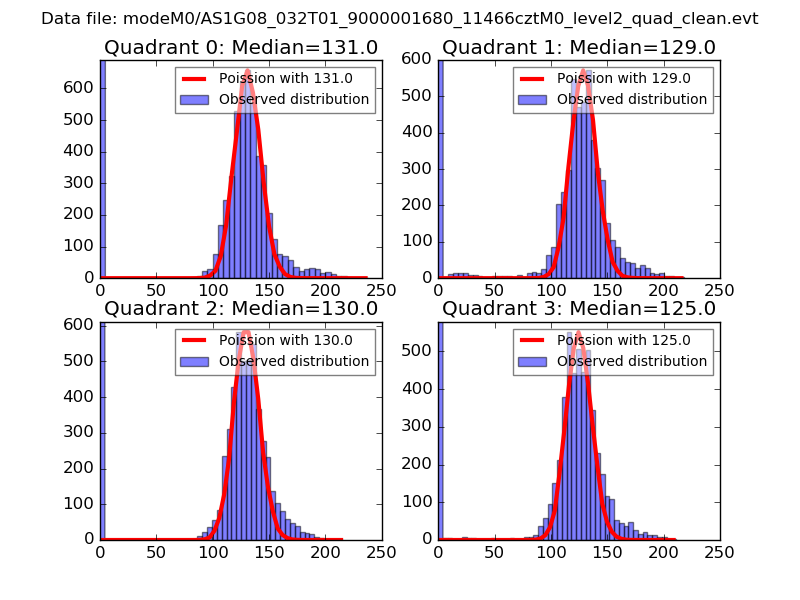
| Comparison with Poisson distribution Blue bars denote a histogram of data divided into 1 sec bins. Red curve is a Poisson curve with rate = median count rate of data. |
 |
 |
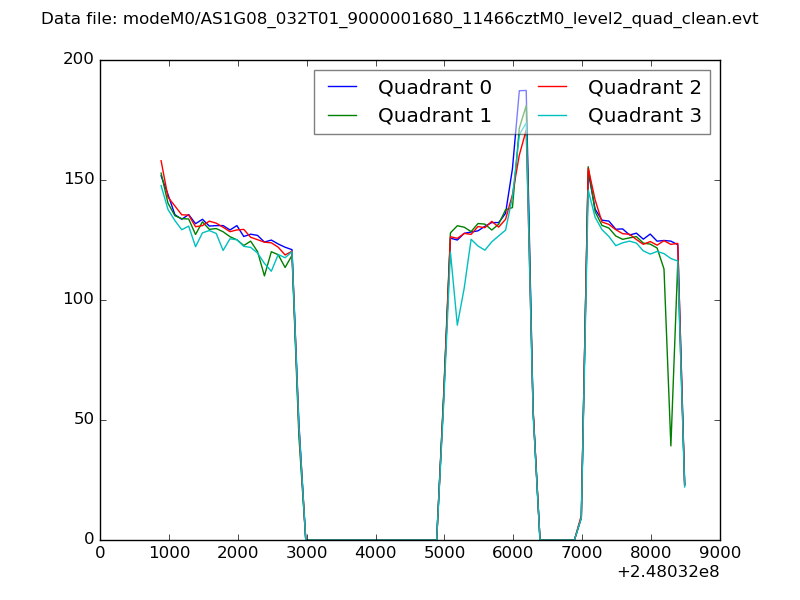
| Quadrant-wise count rates Data is divided into 100 sec bins |
 |
|
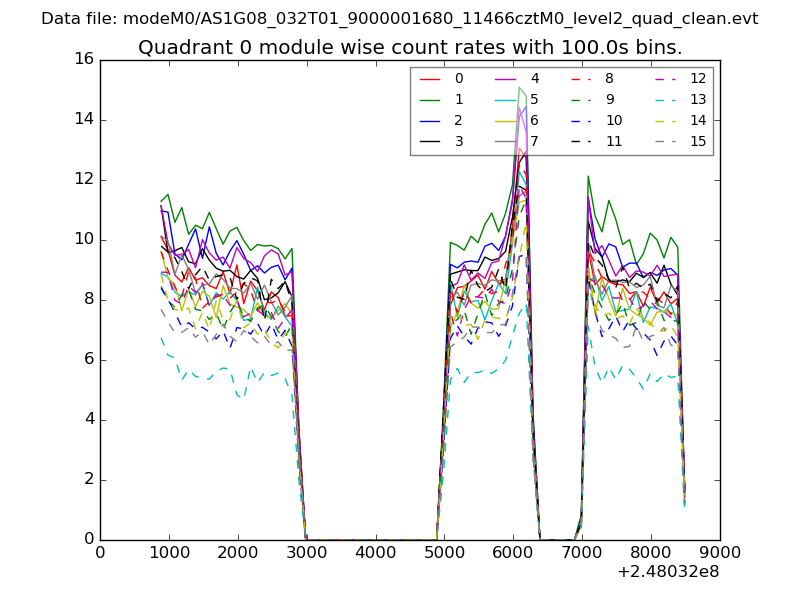
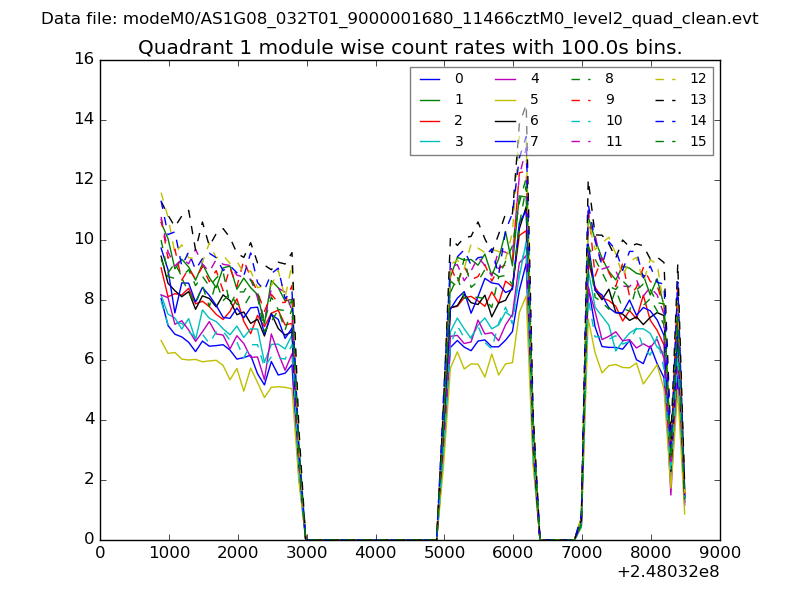
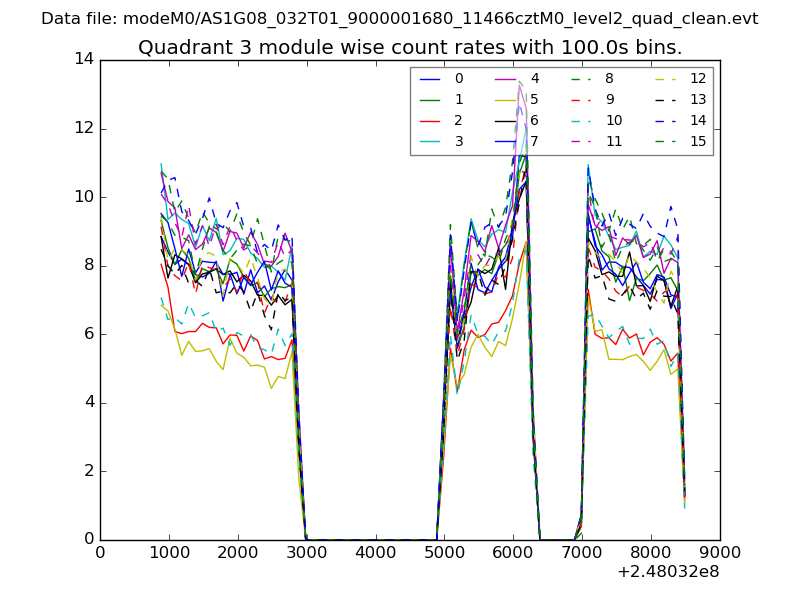
| Module-wise count rates for Quadrant A Data is divided into 100 sec bins |
 |
 |
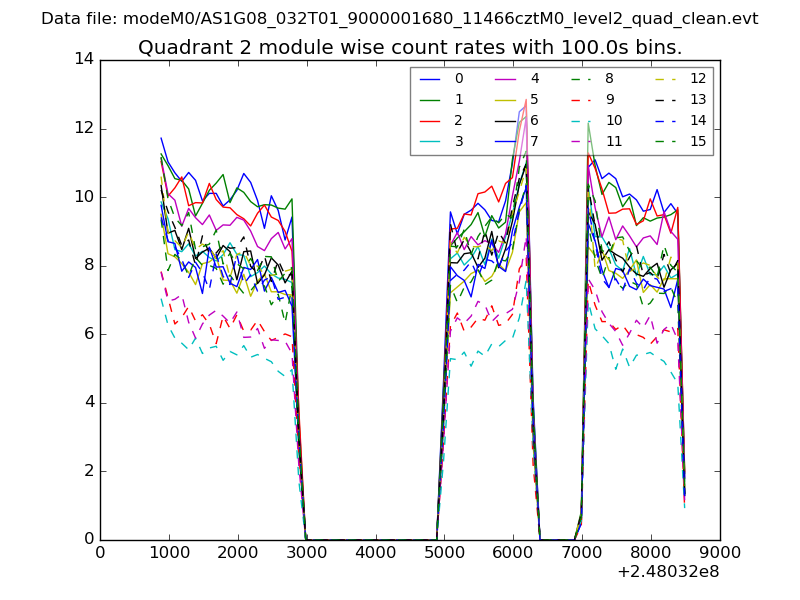
| Module-wise count rates for Quadrant B Data is divided into 100 sec bins |
 |
 |
| Module-wise count rates for Quadrant C Data is divided into 100 sec bins |
 |
 |
| Module-wise count rates for Quadrant D Data is divided into 100 sec bins |
 |
 |
| Parameter | Plot |
|---|---|
| CZT HV Monitor | 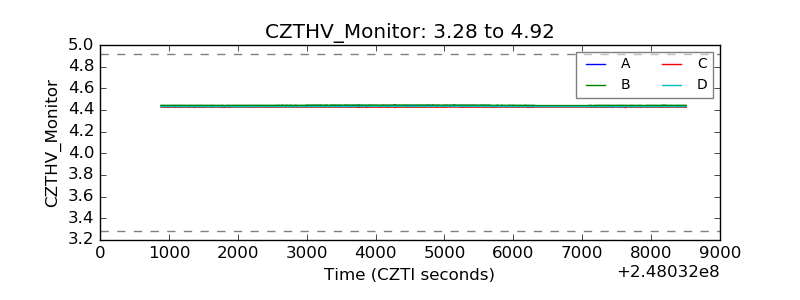 |
| D_VDD | 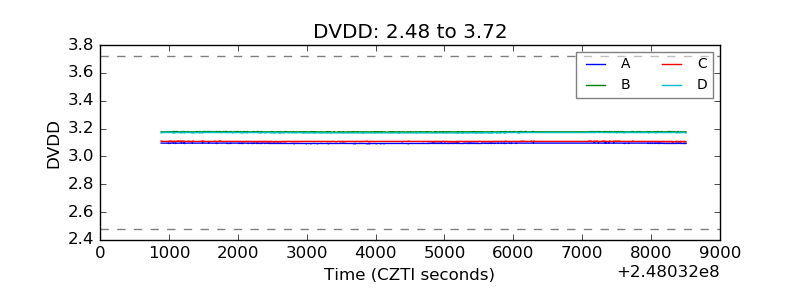 |
| Temperature 1 | 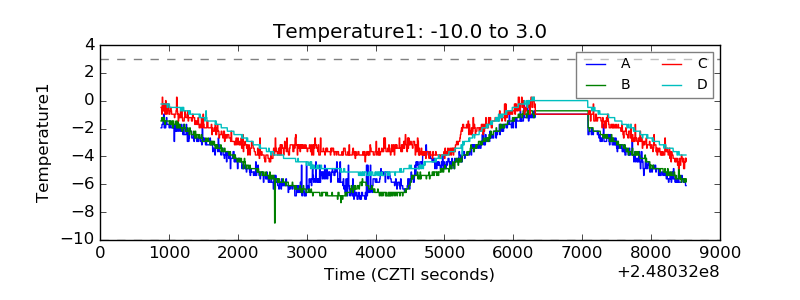 |
| Veto HV Monitor | 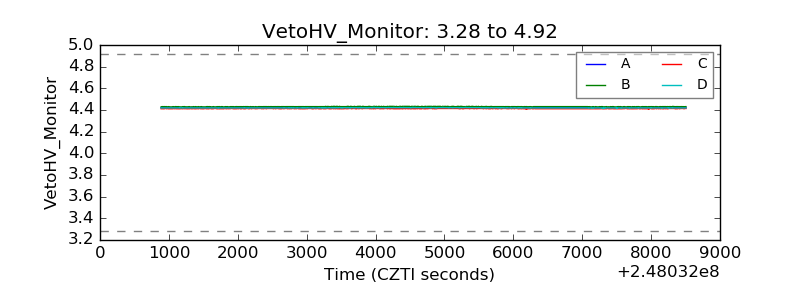 |
| Veto LLD | 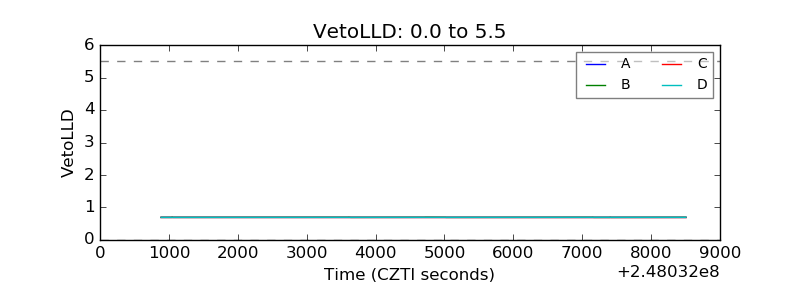 |
| Alpha Counter | 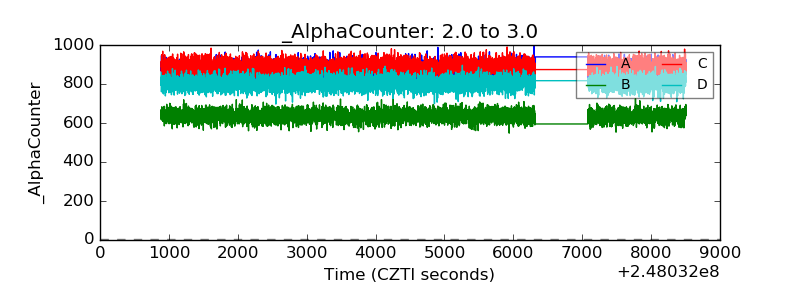 |
| _CPM_Rate | 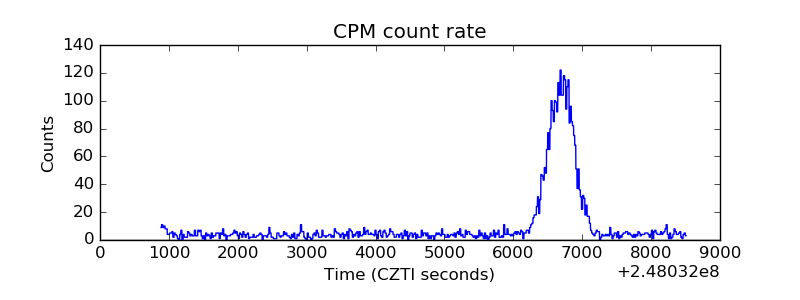 |
| CZT Counter | 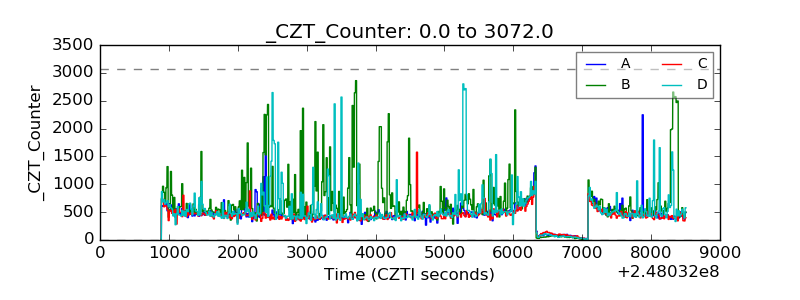 |
| +2.5 Volts monitor |  |
| +5 Volts monitor | 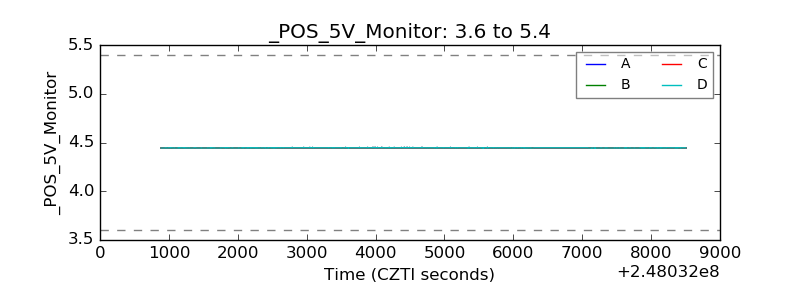 |
| _ROLL_ROT | 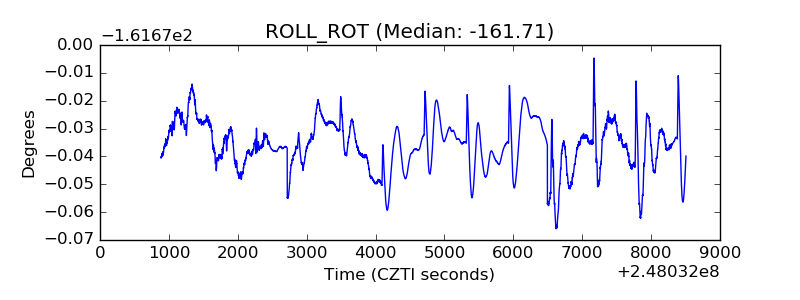 |
| _Roll_DEC | 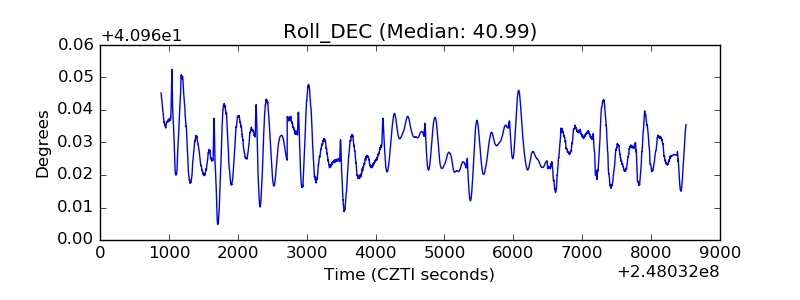 |
| _Roll_RA | 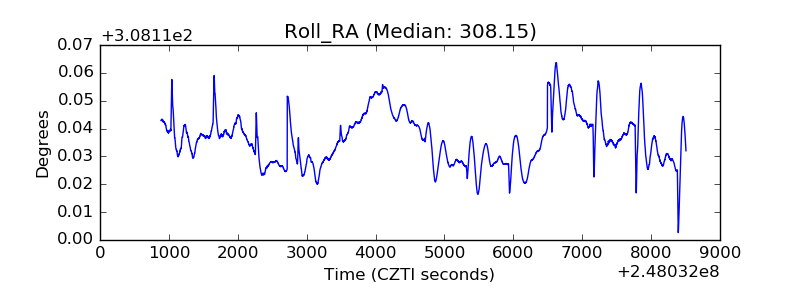 |
| Veto Counter | 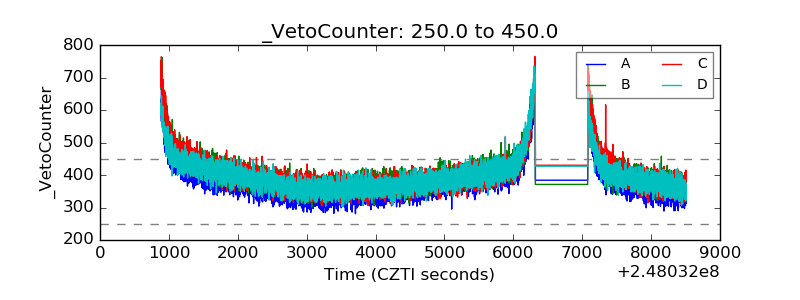 |