| Param | Original file | Final file |
|---|---|---|
| Filename | modeM0/AS1G08_032T01_9000001680_11467cztM0_level2.evt | modeM0/AS1G08_032T01_9000001680_11467cztM0_level2_quad_clean.evt |
| Size (bytes) | 571,178,880 | 102,859,200 |
| Size | 544.7 MB | 98.1 MB |
| Events in quadrant A | 3,520,025 | 667,752 |
| Events in quadrant B | 5,825,272 | 629,998 |
| Events in quadrant C | 3,373,371 | 661,666 |
| Events in quadrant D | 4,075,346 | 638,131 |
| Mode M0 | |||
|---|---|---|---|
| Quadrant | BADHDUFLAG | Total packets | Discarded packets |
| A | 0 | 15593 | 3 |
| B | 0 | 22208 | 2 |
| C | 0 | 15294 | 2 |
| D | 0 | 17199 | 2 |
| Mode M9 | |||
|---|---|---|---|
| Quadrant | BADHDUFLAG | Total packets | Discarded packets |
| A | 0 | 9 | 0 |
| B | 0 | 9 | 0 |
| C | 0 | 9 | 0 |
| D | 0 | 9 | 0 |
| Mode SS | |||
|---|---|---|---|
| Quadrant | BADHDUFLAG | Total packets | Discarded packets |
| A | 0 | 152 | 0 |
| B | 0 | 152 | 0 |
| C | 0 | 152 | 0 |
| D | 0 | 152 | 0 |
| Quadrant | Total seconds | Saturated seconds | Saturation percentage |
|---|---|---|---|
| A | 7429 | 66 | 0.888410% |
| B | 7429 | 676 | 9.099475% |
| C | 7429 | 30 | 0.403823% |
| D | 7429 | 86 | 1.157626% |
Noise dominated data is calculated using 1-second bins in cleaned event files. If a bin has >2000 counts, and if more than 50% of those come from <1% of pixels, then it is considered to be noise-dominated and hence unusable.
| Quadrant | # 1 sec bins | Bins with >0 counts | Bins with >2000 counts | High rate bins dominated by noise | Noise dominated (total time) | Noise dominated (detector-on time) | Marked lightcurve |
|---|---|---|---|---|---|---|---|
| A | 7730 | 7431 | 5 | 5 | 0.06% | 0.07% | 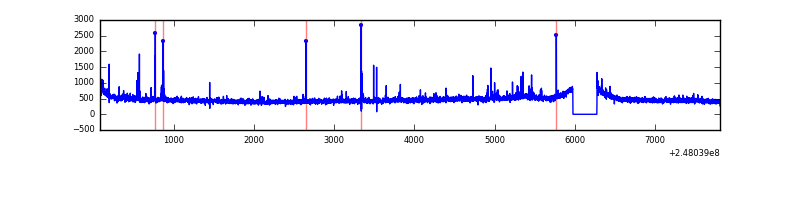 |
| B | 7730 | 7431 | 368 | 368 | 4.76% | 4.95% | 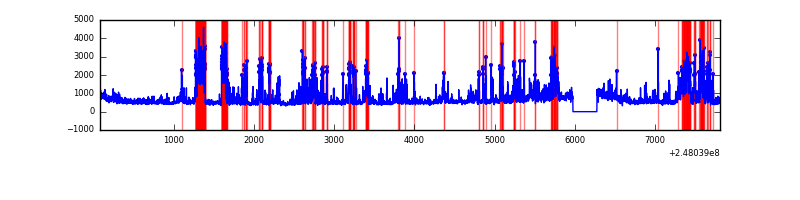 |
| C | 7730 | 7431 | 3 | 3 | 0.04% | 0.04% | 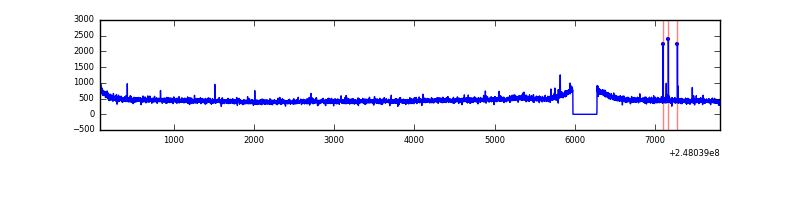 |
| D | 7730 | 7431 | 71 | 71 | 0.92% | 0.96% | 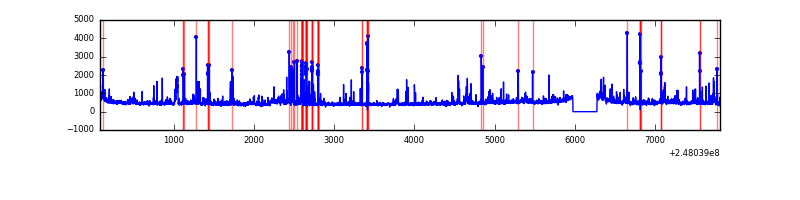 |
Top three noisy pixels from each quadrant. If the there are fewer than three noisy pixels in the level2.evt file, extra rows are filled as -1
| Pixel properties | Quadrant properties | ||||||
|---|---|---|---|---|---|---|---|
| Quadrant | DetID | PixID | Counts | Sigma | Mean | Median | Sigma |
| A | 9 | 143 | 43865 | 240.8 | 879 | 859 | 178.6 |
| A | 3 | 1 | 15606 | 82.57 | 879 | 859 | 178.6 |
| A | 1 | 162 | 15283 | 80.76 | 879 | 859 | 178.6 |
| B | 4 | 239 | 1717025 | 10585.52 | 848 | 829 | 162.1 |
| B | 15 | 204 | 393090 | 2419.47 | 848 | 829 | 162.1 |
| B | 3 | 64 | 179046 | 1099.24 | 848 | 829 | 162.1 |
| C | 14 | 234 | 11769 | 54.71 | 859 | 864 | 199.3 |
| C | 0 | 207 | 6120 | 26.37 | 859 | 864 | 199.3 |
| C | 13 | 61 | 6116 | 26.35 | 859 | 864 | 199.3 |
| D | 1 | 52 | 364889 | 1751.94 | 858 | 834 | 207.8 |
| D | 2 | 120 | 156899 | 751.03 | 858 | 834 | 207.8 |
| D | 8 | 195 | 52982 | 250.95 | 858 | 834 | 207.8 |
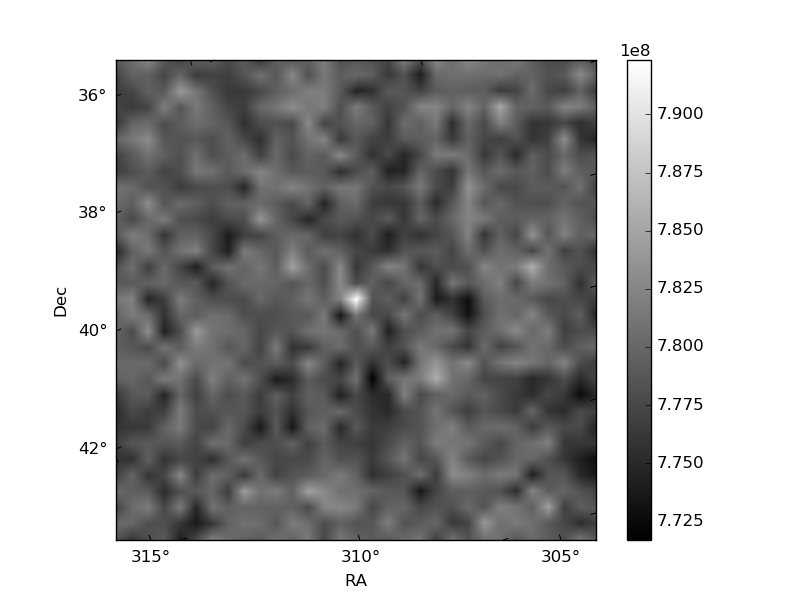
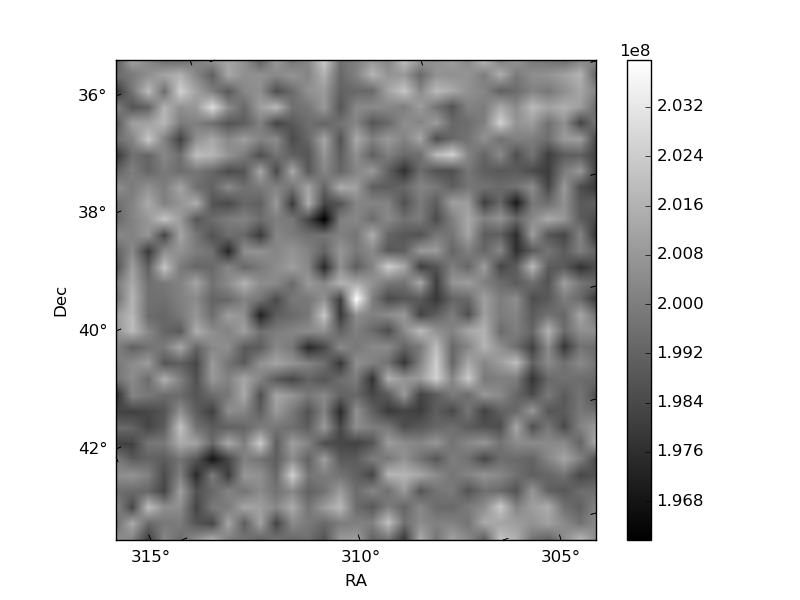
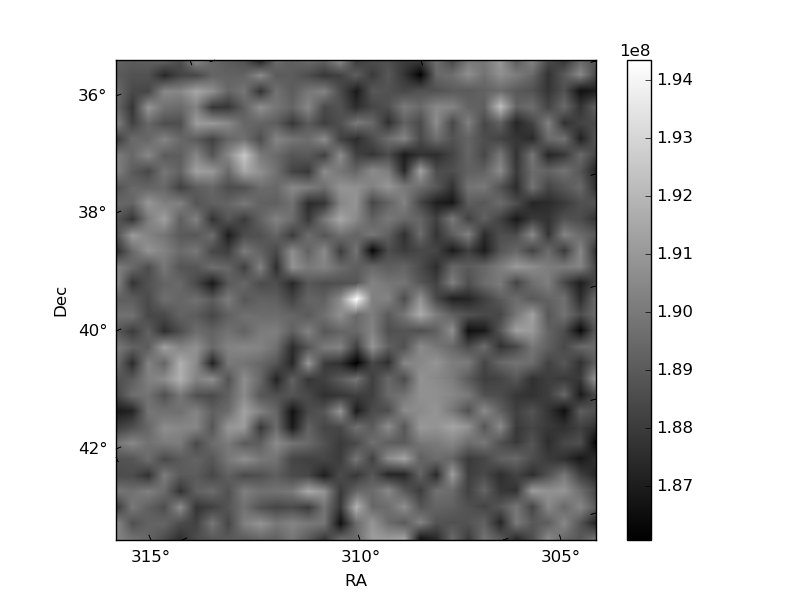
Histogram calculated using DETX and DETY for each event in the final _common_clean file
| Quadrant A | 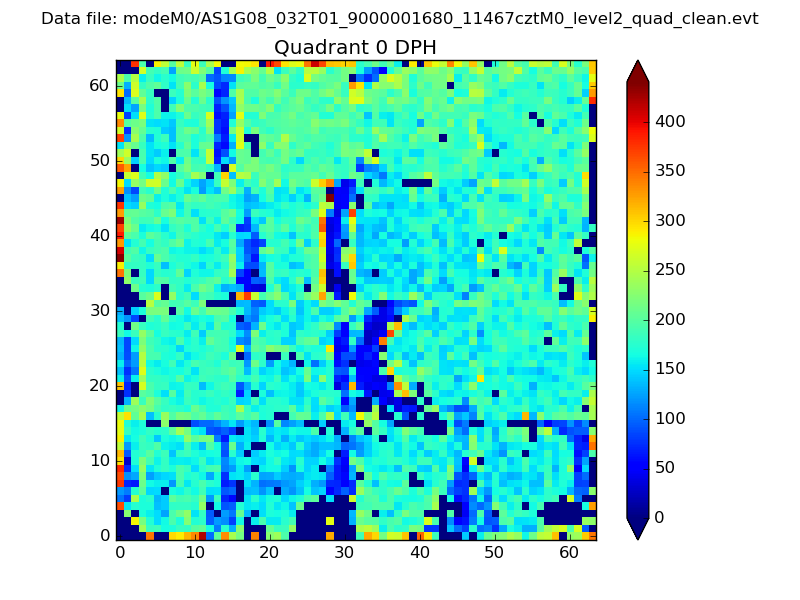 |
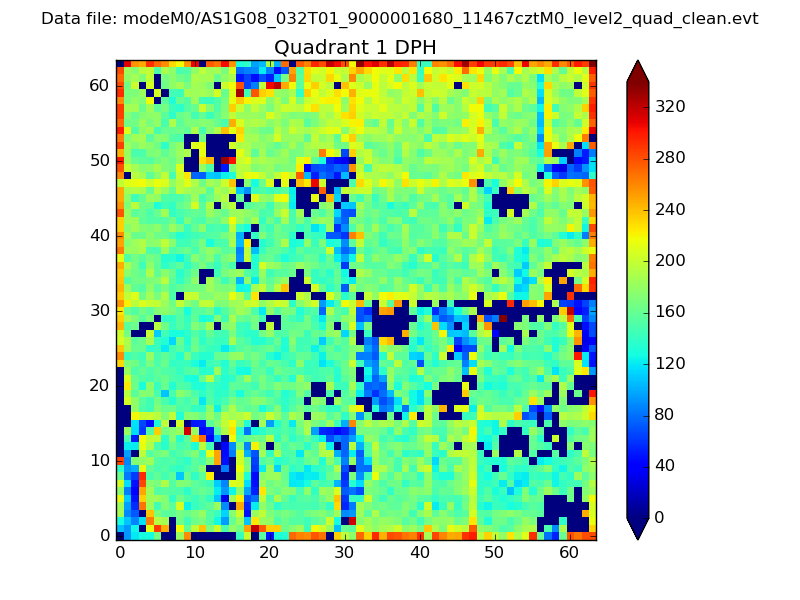 |
Quadrant B |
|---|---|---|---|
| Quadrant D | 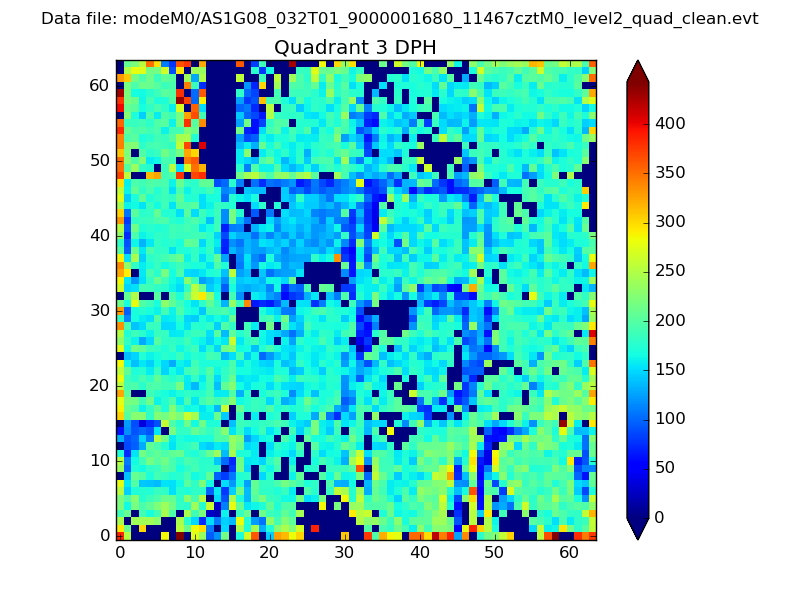 |
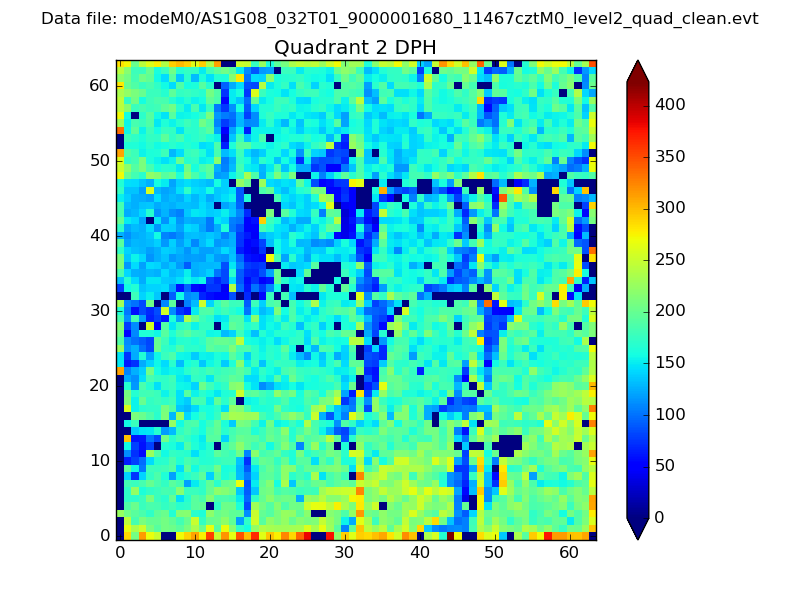 |
Quadrant C |
| Plot type | Count rate plots | Images |
|---|---|---|
| Comparison with Poisson distribution Blue bars denote a histogram of data divided into 1 sec bins. Red curve is a Poisson curve with rate = median count rate of data. |
 |
 |
| Quadrant-wise count rates Data is divided into 100 sec bins |
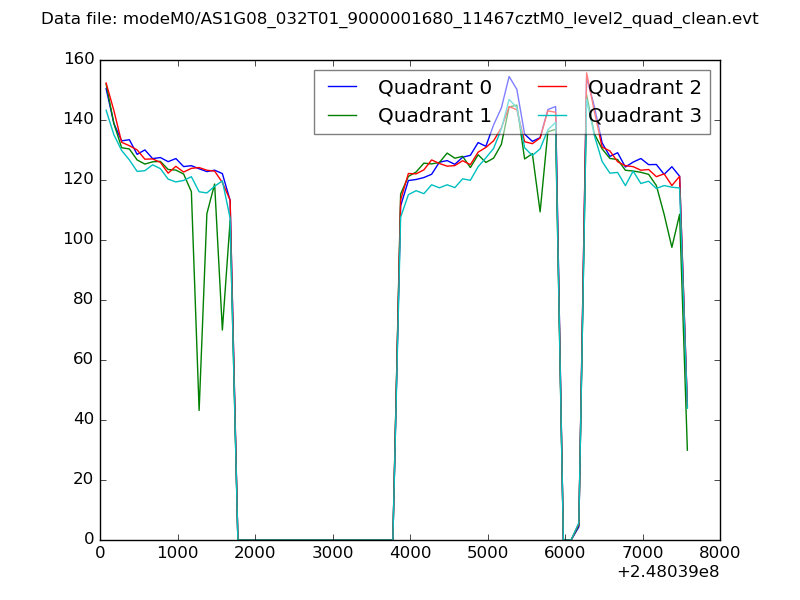 |
|
| Module-wise count rates for Quadrant A Data is divided into 100 sec bins |
 |
 |
| Module-wise count rates for Quadrant B Data is divided into 100 sec bins |
 |
 |
| Module-wise count rates for Quadrant C Data is divided into 100 sec bins |
 |
 |
| Module-wise count rates for Quadrant D Data is divided into 100 sec bins |
 |
 |
| Parameter | Plot |
|---|---|
| CZT HV Monitor |  |
| D_VDD | 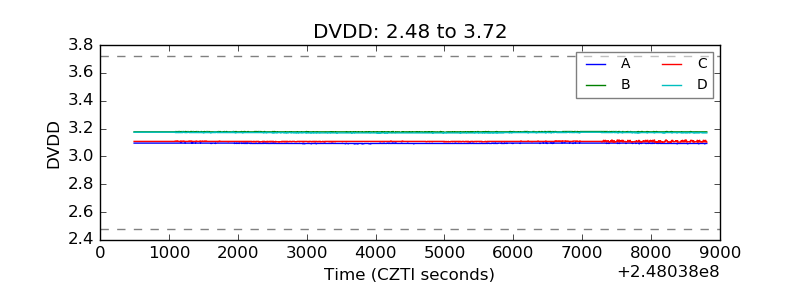 |
| Temperature 1 |  |
| Veto HV Monitor | 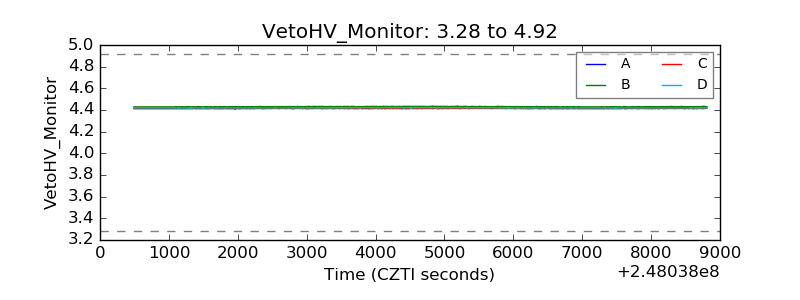 |
| Veto LLD |  |
| Alpha Counter | 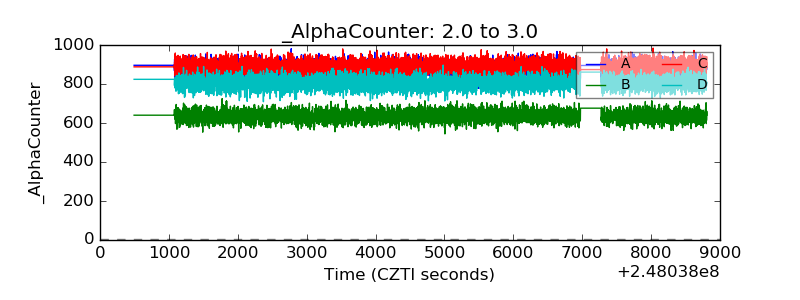 |
| _CPM_Rate | 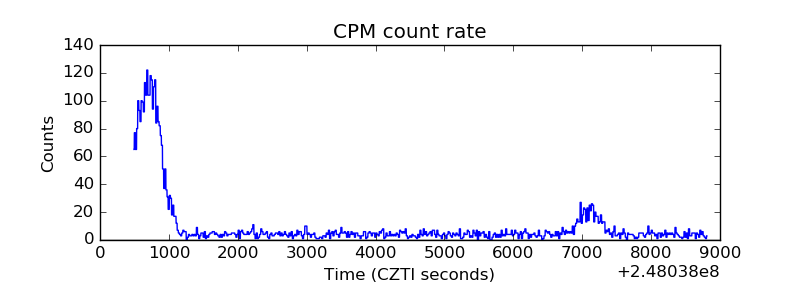 |
| CZT Counter | 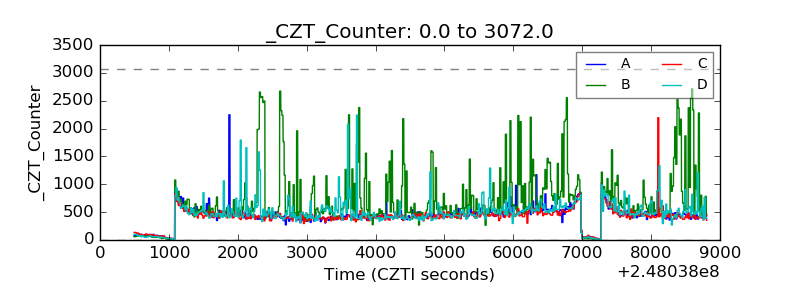 |
| +2.5 Volts monitor |  |
| +5 Volts monitor |  |
| _ROLL_ROT |  |
| _Roll_DEC |  |
| _Roll_RA | 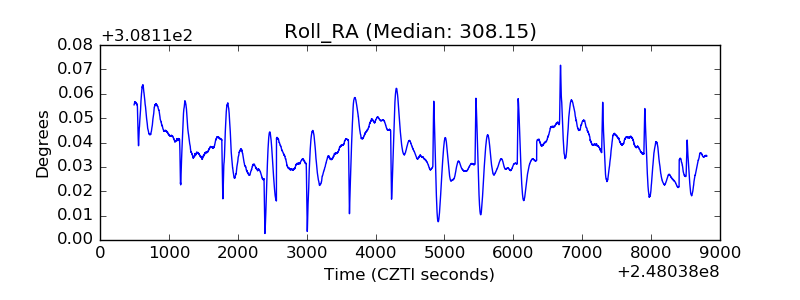 |
| Veto Counter |  |