| Param | Original file | Final file |
|---|---|---|
| Filename | modeM0/AS1G08_032T01_9000001680_11469cztM0_level2.evt | modeM0/AS1G08_032T01_9000001680_11469cztM0_level2_quad_clean.evt |
| Size (bytes) | 636,549,120 | 95,855,040 |
| Size | 607.1 MB | 91.4 MB |
| Events in quadrant A | 3,808,431 | 602,321 |
| Events in quadrant B | 6,007,695 | 578,600 |
| Events in quadrant C | 3,682,768 | 600,474 |
| Events in quadrant D | 5,235,710 | 563,946 |
| Mode M0 | |||
|---|---|---|---|
| Quadrant | BADHDUFLAG | Total packets | Discarded packets |
| A | 0 | 16782 | 3 |
| B | 0 | 23205 | 2 |
| C | 0 | 16643 | 2 |
| D | 0 | 21074 | 2 |
| Mode M9 | |||
|---|---|---|---|
| Quadrant | BADHDUFLAG | Total packets | Discarded packets |
| A | 0 | 4 | 0 |
| B | 0 | 4 | 0 |
| C | 0 | 4 | 0 |
| D | 0 | 4 | 0 |
| Mode SS | |||
|---|---|---|---|
| Quadrant | BADHDUFLAG | Total packets | Discarded packets |
| A | 0 | 164 | 0 |
| B | 0 | 164 | 0 |
| C | 0 | 164 | 0 |
| D | 0 | 164 | 0 |
| Quadrant | Total seconds | Saturated seconds | Saturation percentage |
|---|---|---|---|
| A | 8017 | 139 | 1.733816% |
| B | 8017 | 729 | 9.093177% |
| C | 8017 | 77 | 0.960459% |
| D | 8017 | 350 | 4.365723% |
Noise dominated data is calculated using 1-second bins in cleaned event files. If a bin has >2000 counts, and if more than 50% of those come from <1% of pixels, then it is considered to be noise-dominated and hence unusable.
| Quadrant | # 1 sec bins | Bins with >0 counts | Bins with >2000 counts | High rate bins dominated by noise | Noise dominated (total time) | Noise dominated (detector-on time) | Marked lightcurve |
|---|---|---|---|---|---|---|---|
| A | 8403 | 8021 | 0 | 0 | 0.00% | 0.00% | 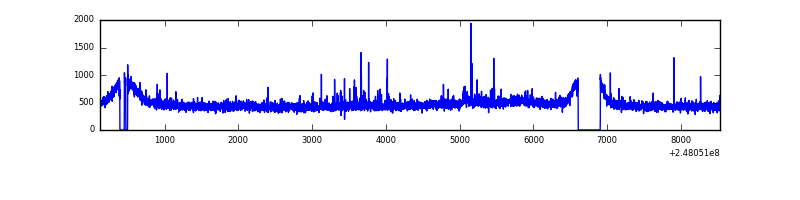 |
| B | 8403 | 8021 | 284 | 284 | 3.38% | 3.54% | 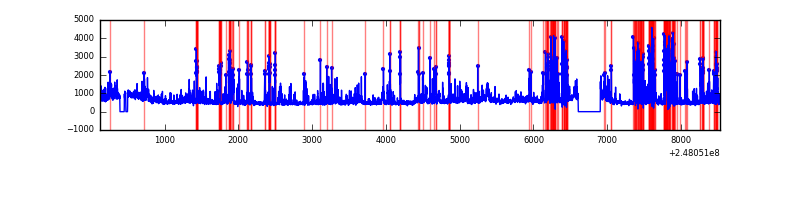 |
| C | 8403 | 8021 | 2 | 2 | 0.02% | 0.02% | 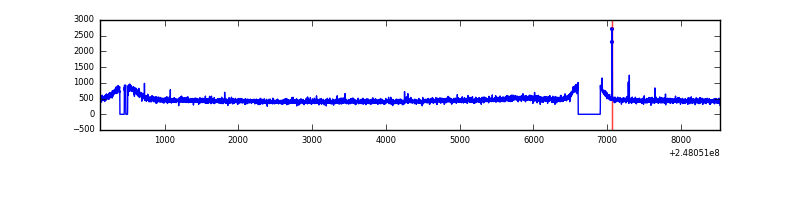 |
| D | 8403 | 8021 | 177 | 177 | 2.11% | 2.21% | 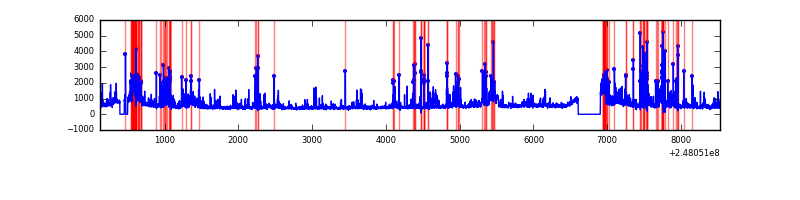 |
Top three noisy pixels from each quadrant. If the there are fewer than three noisy pixels in the level2.evt file, extra rows are filled as -1
| Pixel properties | Quadrant properties | ||||||
|---|---|---|---|---|---|---|---|
| Quadrant | DetID | PixID | Counts | Sigma | Mean | Median | Sigma |
| A | 9 | 143 | 19257 | 92.75 | 959 | 934 | 197.5 |
| A | 1 | 162 | 18248 | 87.64 | 959 | 934 | 197.5 |
| A | 15 | 174 | 15627 | 74.38 | 959 | 934 | 197.5 |
| B | 4 | 239 | 967401 | 5387.9 | 931 | 907 | 179.4 |
| B | 3 | 64 | 908855 | 5061.52 | 931 | 907 | 179.4 |
| B | 15 | 204 | 269622 | 1498.0 | 931 | 907 | 179.4 |
| C | 12 | 4 | 14279 | 60.84 | 941 | 946 | 219.1 |
| C | 13 | 61 | 6970 | 27.49 | 941 | 946 | 219.1 |
| C | 14 | 234 | 3130 | 9.97 | 941 | 946 | 219.1 |
| D | 1 | 52 | 894558 | 3998.19 | 920 | 892 | 223.5 |
| D | 10 | 253 | 192784 | 858.51 | 920 | 892 | 223.5 |
| D | 8 | 195 | 166686 | 741.75 | 920 | 892 | 223.5 |
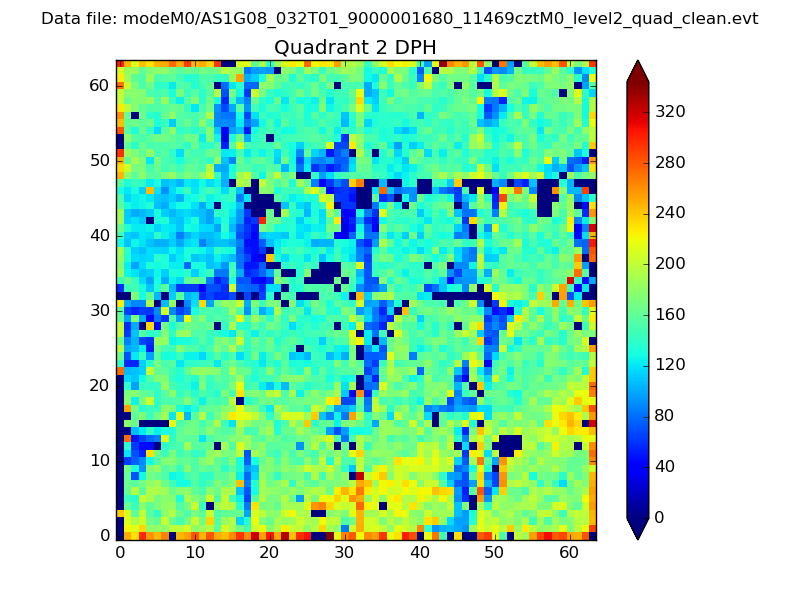
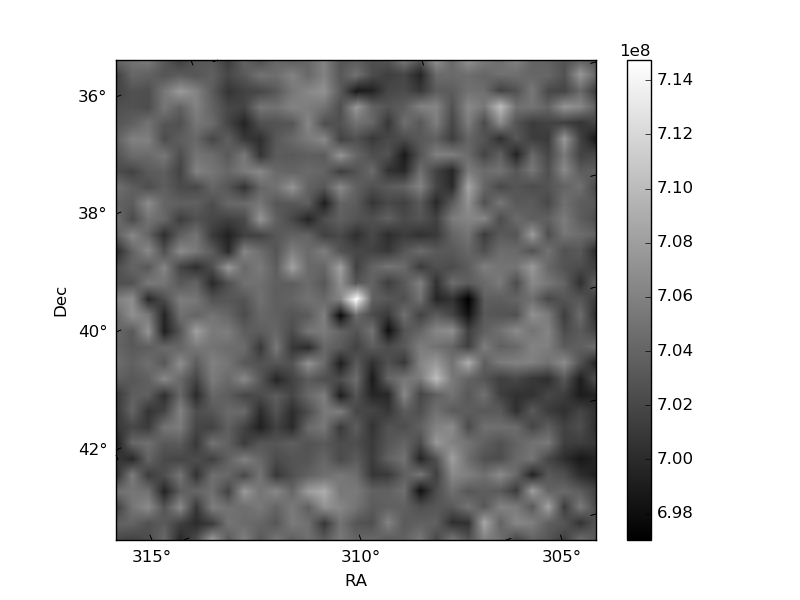
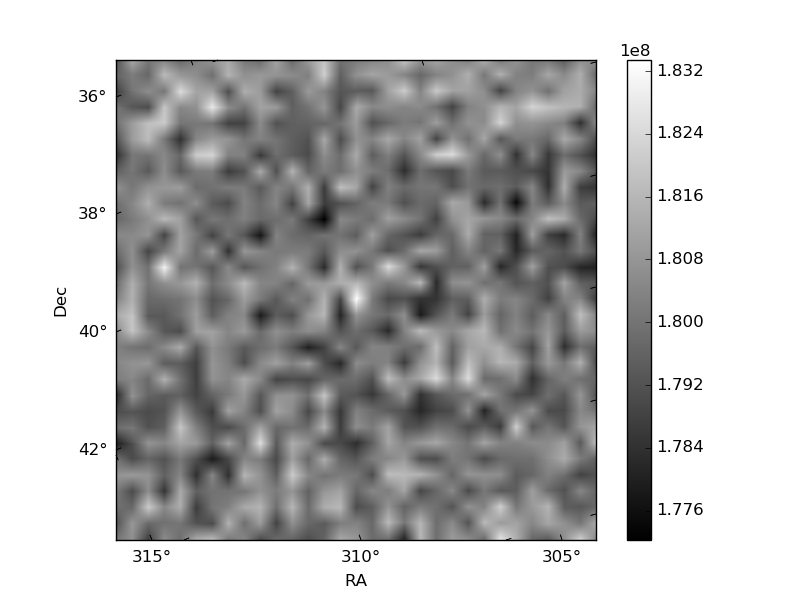
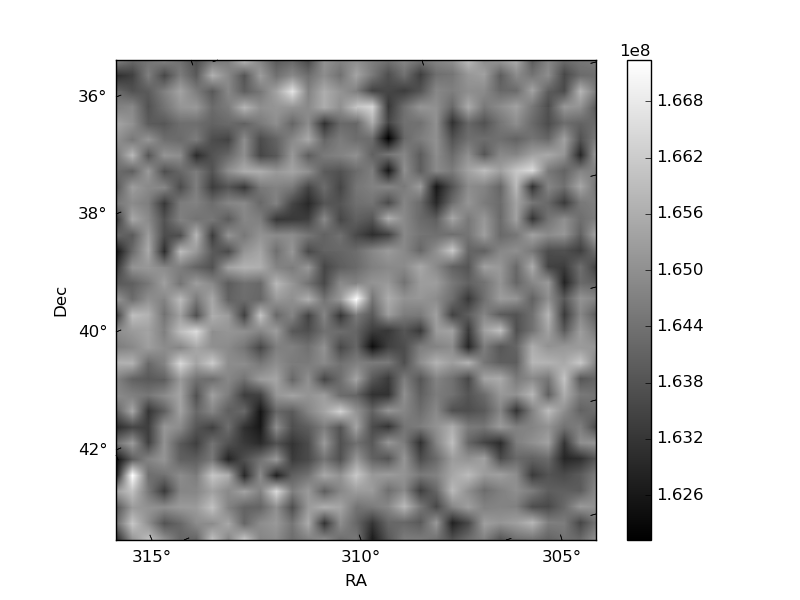
Histogram calculated using DETX and DETY for each event in the final _common_clean file
| Quadrant A | 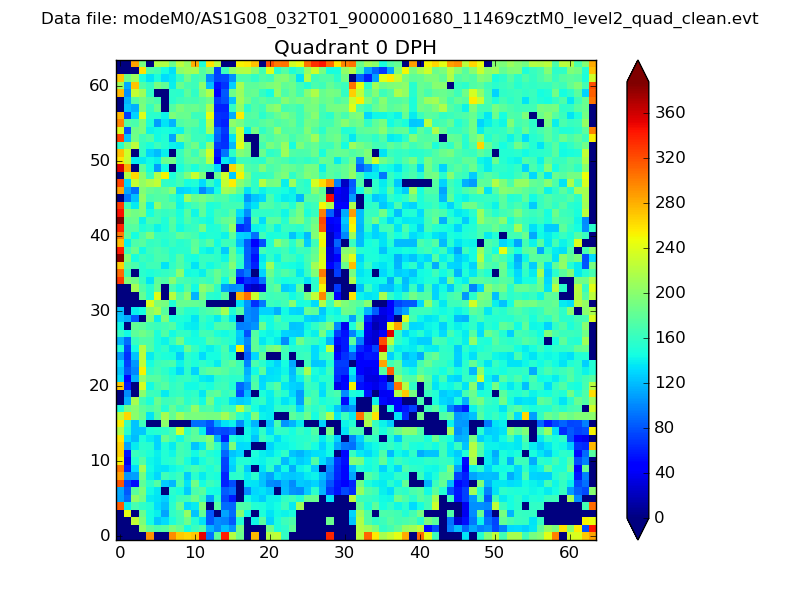 |
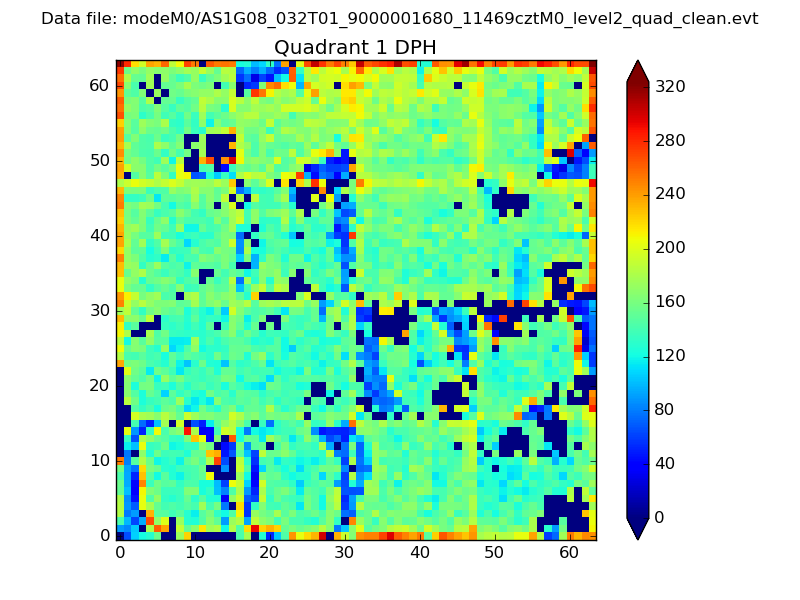 |
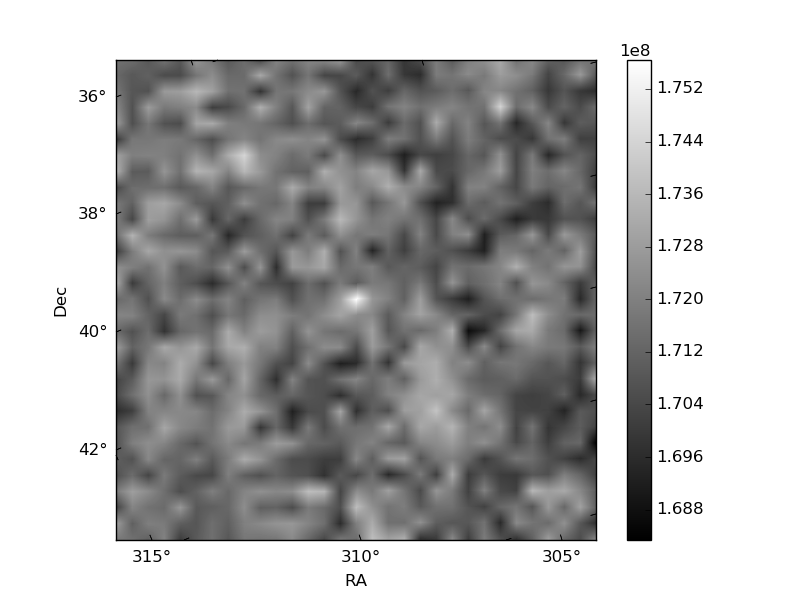
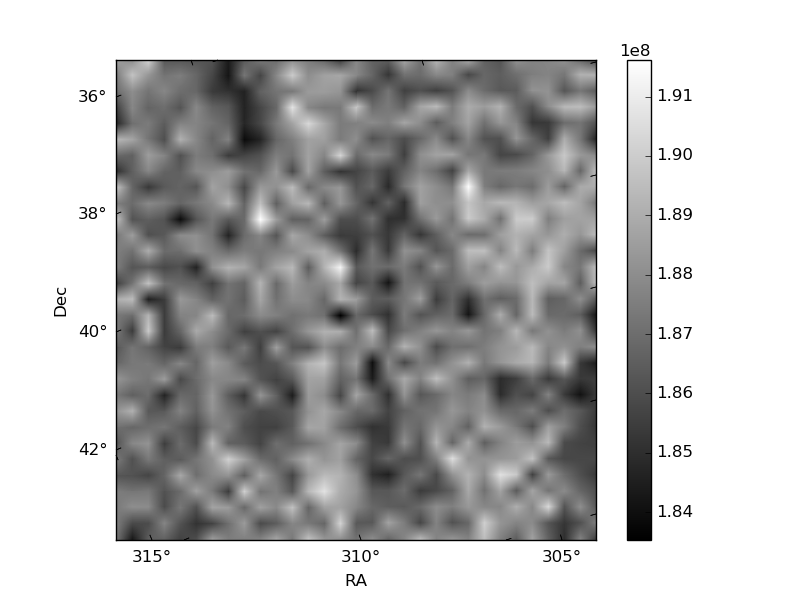
Quadrant B |
|---|---|---|---|
| Quadrant D | 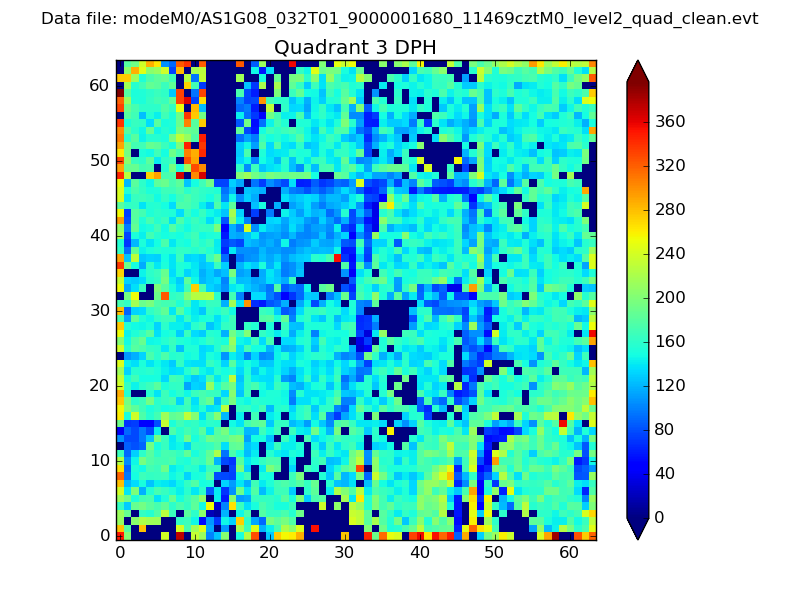 |
 |
Quadrant C |
| Plot type | Count rate plots | Images |
|---|---|---|
| Comparison with Poisson distribution Blue bars denote a histogram of data divided into 1 sec bins. Red curve is a Poisson curve with rate = median count rate of data. |
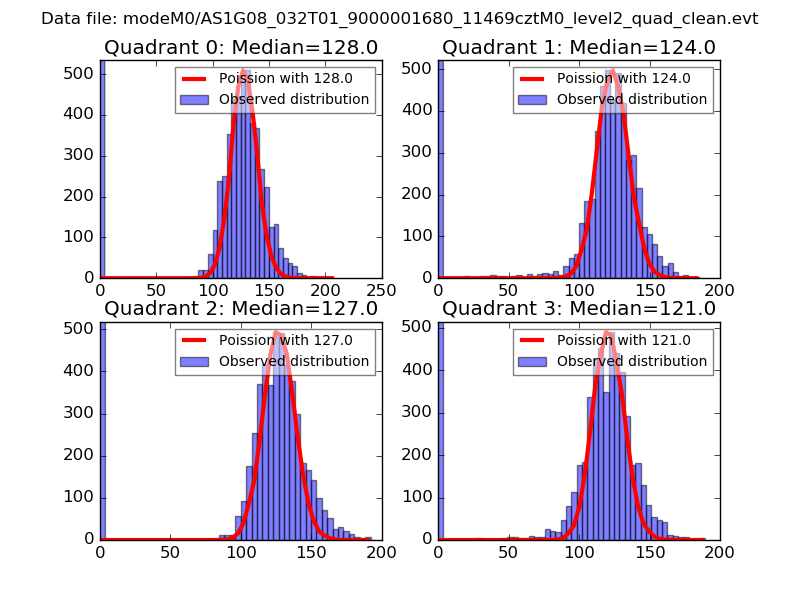 |
 |
| Quadrant-wise count rates Data is divided into 100 sec bins |
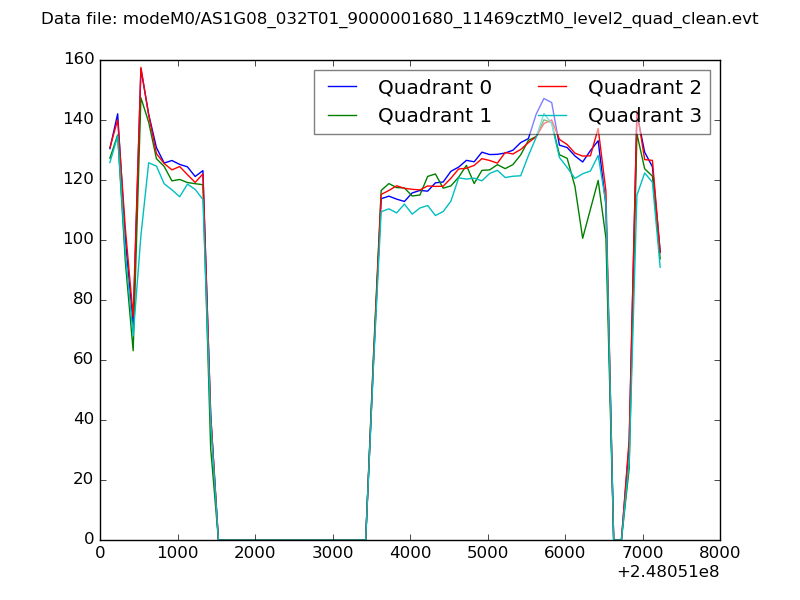 |
|
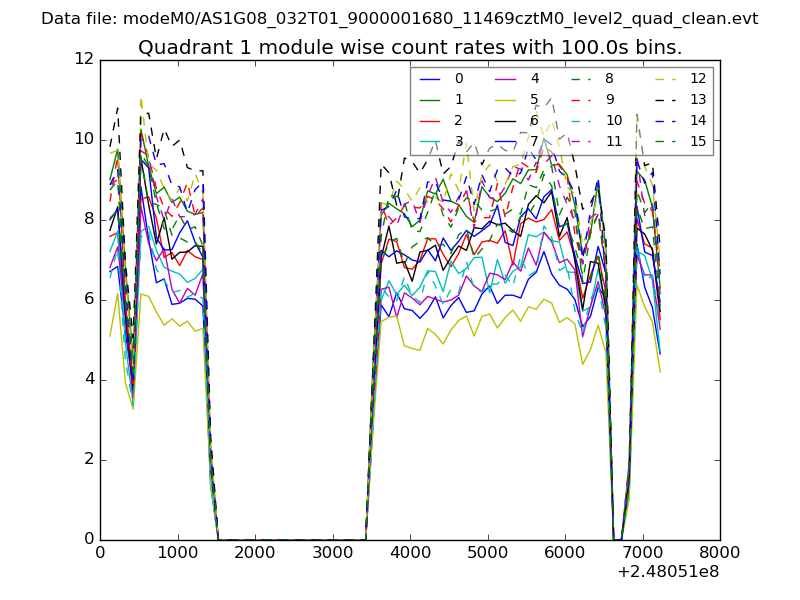
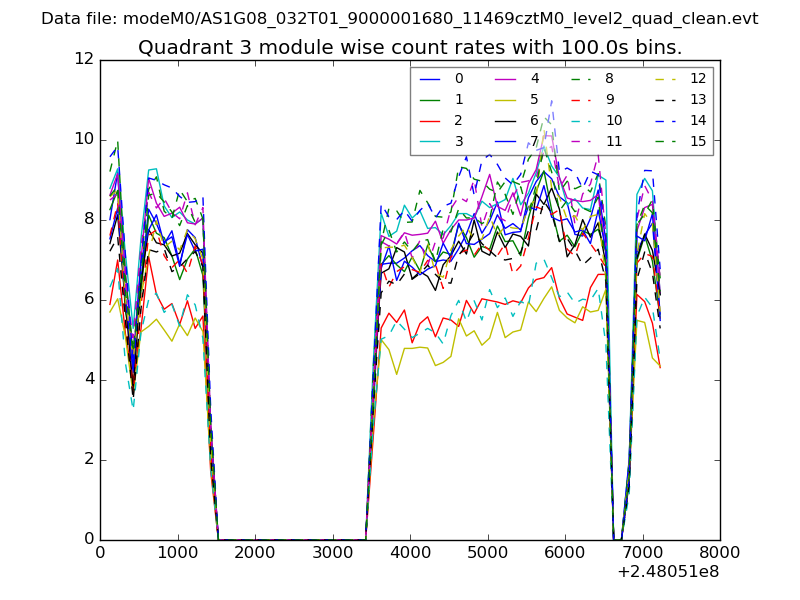
| Module-wise count rates for Quadrant A Data is divided into 100 sec bins |
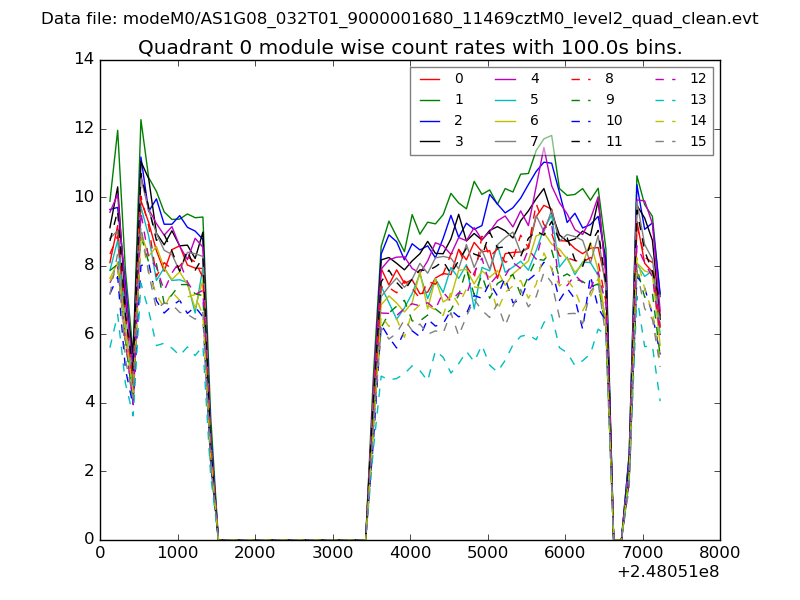 |
 |
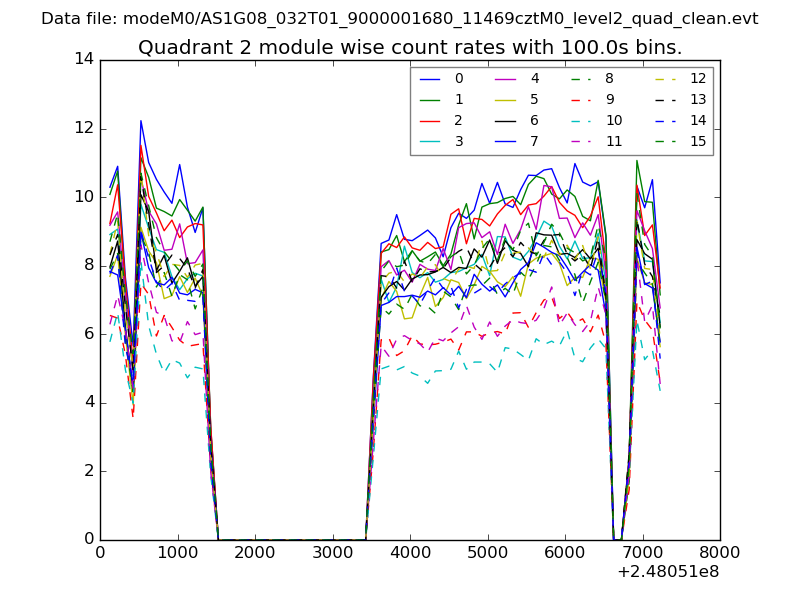
| Module-wise count rates for Quadrant B Data is divided into 100 sec bins |
 |
 |
| Module-wise count rates for Quadrant C Data is divided into 100 sec bins |
 |
 |
| Module-wise count rates for Quadrant D Data is divided into 100 sec bins |
 |
 |
| Parameter | Plot |
|---|---|
| CZT HV Monitor | 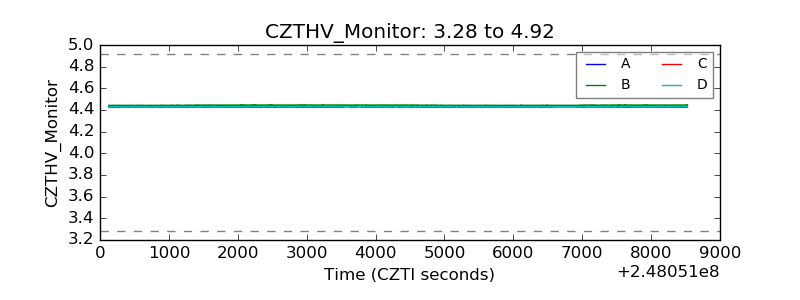 |
| D_VDD | 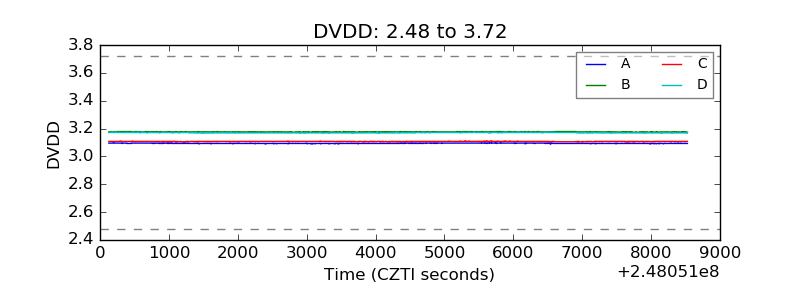 |
| Temperature 1 | 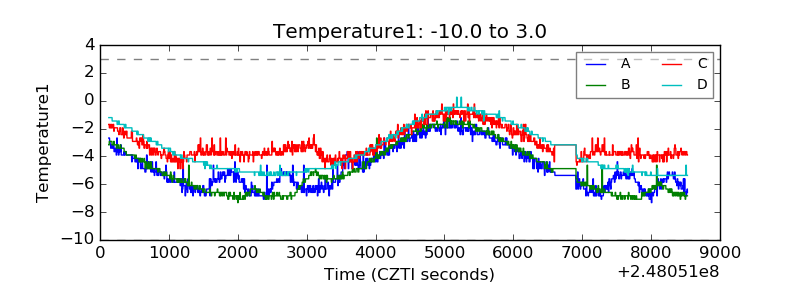 |
| Veto HV Monitor | 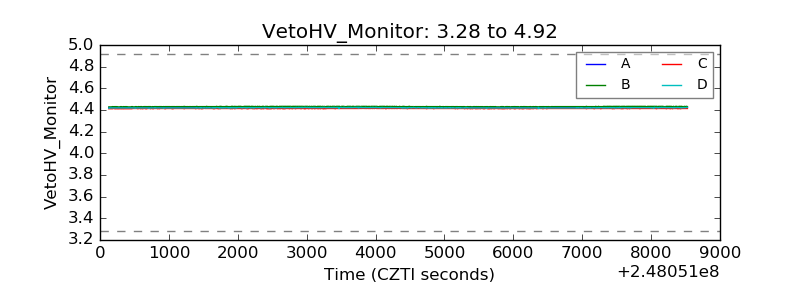 |
| Veto LLD | 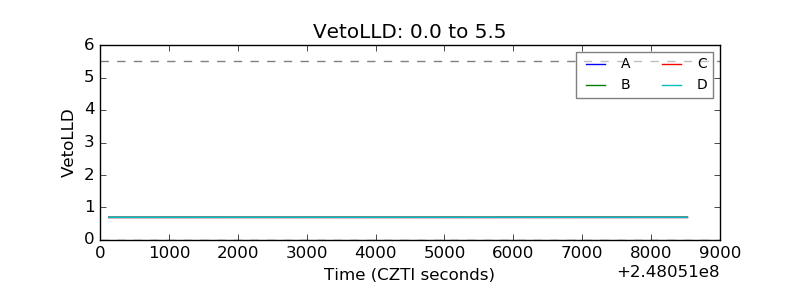 |
| Alpha Counter | 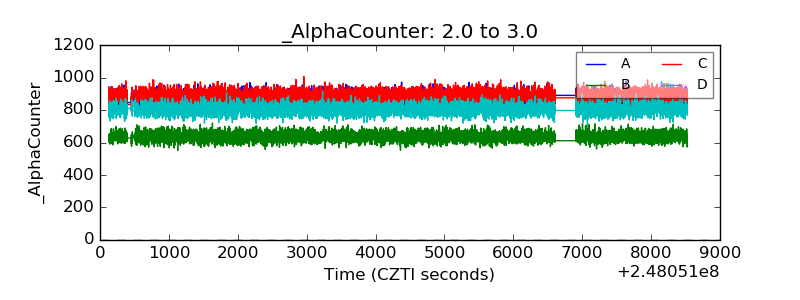 |
| _CPM_Rate | 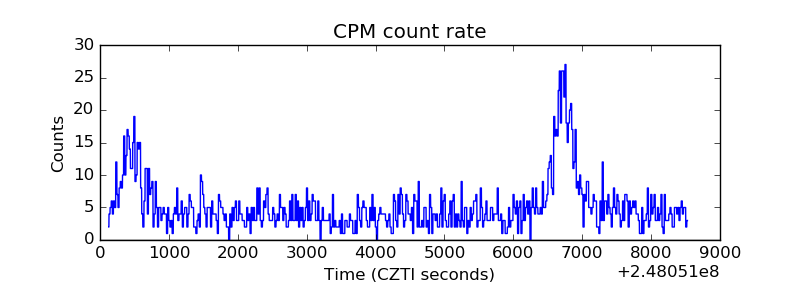 |
| CZT Counter |  |
| +2.5 Volts monitor |  |
| +5 Volts monitor |  |
| _ROLL_ROT | 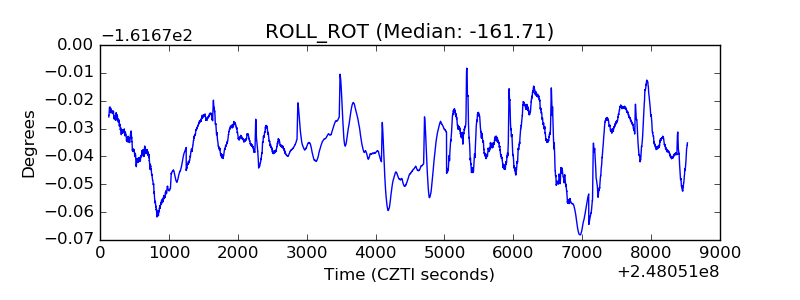 |
| _Roll_DEC | 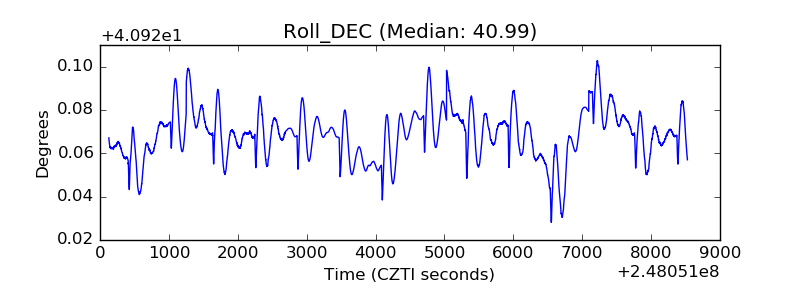 |
| _Roll_RA | 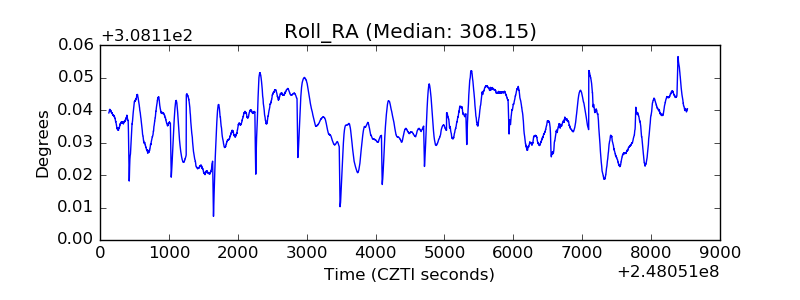 |
| Veto Counter | 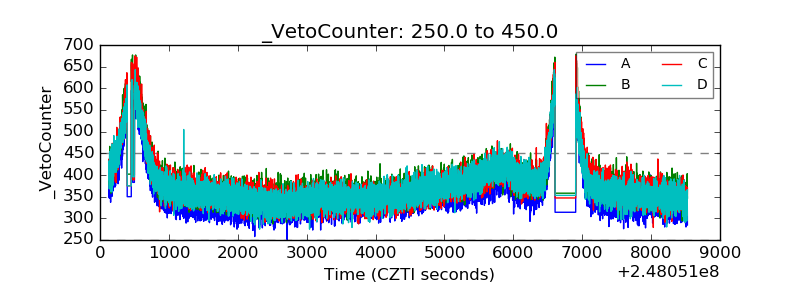 |