| Param | Original file | Final file |
|---|---|---|
| Filename | modeM0/AS1G08_032T01_9000001680_11471cztM0_level2.evt | modeM0/AS1G08_032T01_9000001680_11471cztM0_level2_quad_clean.evt |
| Size (bytes) | 219,211,200 | 19,820,160 |
| Size | 209.1 MB | 18.9 MB |
| Events in quadrant A | 1,284,102 | 98,415 |
| Events in quadrant B | 2,080,207 | 99,215 |
| Events in quadrant C | 1,263,565 | 99,727 |
| Events in quadrant D | 1,809,250 | 92,483 |
| Mode M0 | |||
|---|---|---|---|
| Quadrant | BADHDUFLAG | Total packets | Discarded packets |
| A | 0 | 5980 | 1 |
| B | 0 | 8165 | 1 |
| C | 0 | 5956 | 1 |
| D | 0 | 7439 | 1 |
| Mode SS | |||
|---|---|---|---|
| Quadrant | BADHDUFLAG | Total packets | Discarded packets |
| A | 0 | 58 | 0 |
| B | 0 | 58 | 0 |
| C | 0 | 58 | 0 |
| D | 0 | 58 | 0 |
| Quadrant | Total seconds | Saturated seconds | Saturation percentage |
|---|---|---|---|
| A | 2940 | 4 | 0.136054% |
| B | 2940 | 273 | 9.285714% |
| C | 2940 | 4 | 0.136054% |
| D | 2940 | 91 | 3.095238% |
Noise dominated data is calculated using 1-second bins in cleaned event files. If a bin has >2000 counts, and if more than 50% of those come from <1% of pixels, then it is considered to be noise-dominated and hence unusable.
| Quadrant | # 1 sec bins | Bins with >0 counts | Bins with >2000 counts | High rate bins dominated by noise | Noise dominated (total time) | Noise dominated (detector-on time) | Marked lightcurve |
|---|---|---|---|---|---|---|---|
| A | 2941 | 2941 | 1 | 1 | 0.03% | 0.03% | 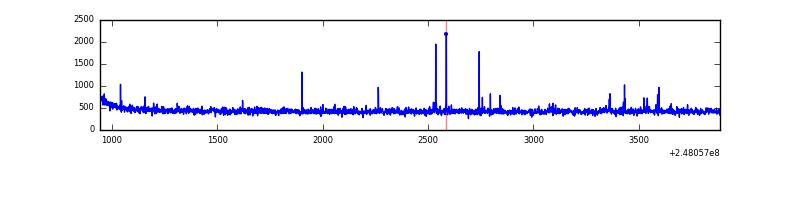 |
| B | 2941 | 2941 | 152 | 152 | 5.17% | 5.17% | 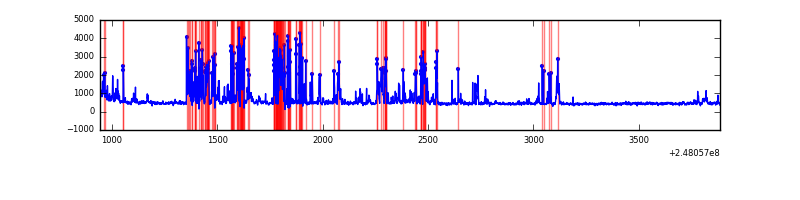 |
| C | 2941 | 2941 | 2 | 2 | 0.07% | 0.07% |  |
| D | 2941 | 2941 | 67 | 67 | 2.28% | 2.28% | 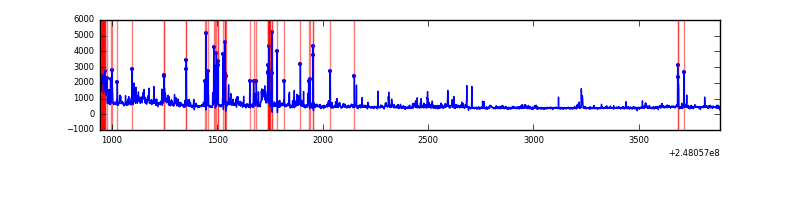 |
Top three noisy pixels from each quadrant. If the there are fewer than three noisy pixels in the level2.evt file, extra rows are filled as -1
| Pixel properties | Quadrant properties | ||||||
|---|---|---|---|---|---|---|---|
| Quadrant | DetID | PixID | Counts | Sigma | Mean | Median | Sigma |
| A | 14 | 235 | 14600 | 208.3 | 325 | 318 | 68.6 |
| A | 9 | 143 | 5259 | 72.06 | 325 | 318 | 68.6 |
| A | 13 | 254 | 4528 | 61.4 | 325 | 318 | 68.6 |
| B | 4 | 239 | 412366 | 6655.36 | 314 | 306 | 61.9 |
| B | 3 | 64 | 394497 | 6366.75 | 314 | 306 | 61.9 |
| B | 0 | 214 | 13722 | 216.69 | 314 | 306 | 61.9 |
| C | 12 | 4 | 10213 | 129.22 | 321 | 323 | 76.5 |
| C | 13 | 61 | 2437 | 27.62 | 321 | 323 | 76.5 |
| C | 3 | 202 | 820 | 6.49 | 321 | 323 | 76.5 |
| D | 1 | 52 | 161491 | 2083.82 | 311 | 302 | 77.4 |
| D | 5 | 222 | 150648 | 1943.64 | 311 | 302 | 77.4 |
| D | 10 | 253 | 137101 | 1768.51 | 311 | 302 | 77.4 |
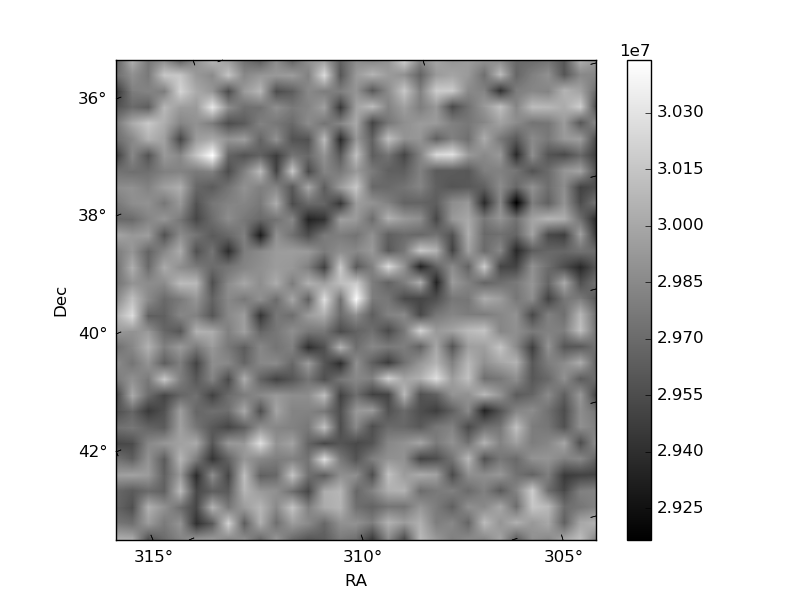
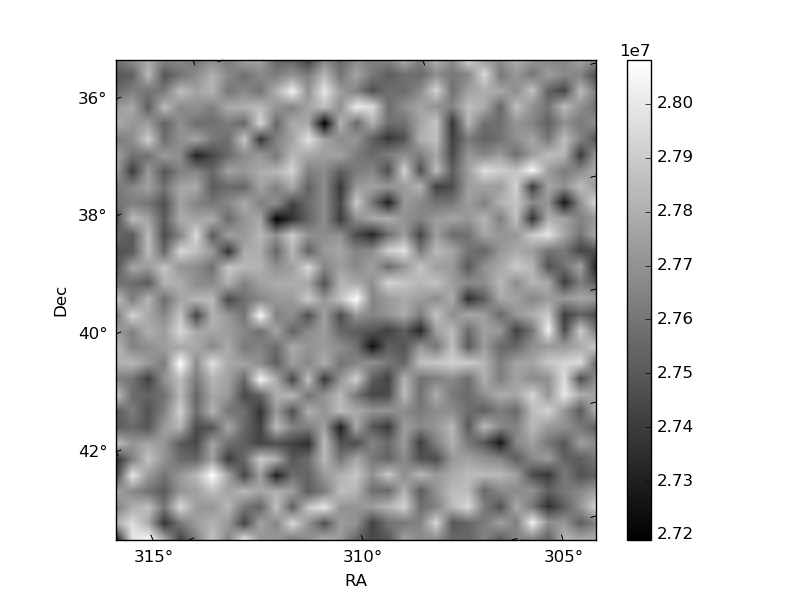
Histogram calculated using DETX and DETY for each event in the final _common_clean file
| Quadrant A |  |
 |
Quadrant B |
|---|---|---|---|
| Quadrant D | 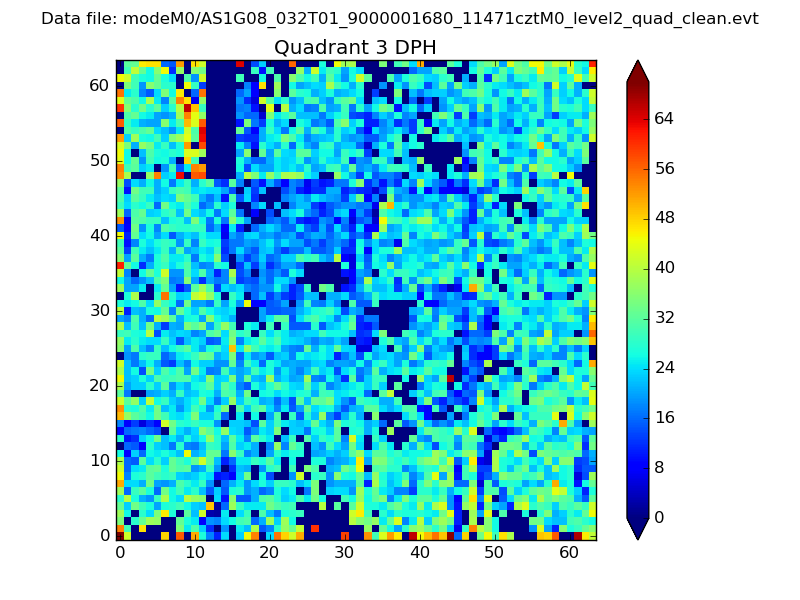 |
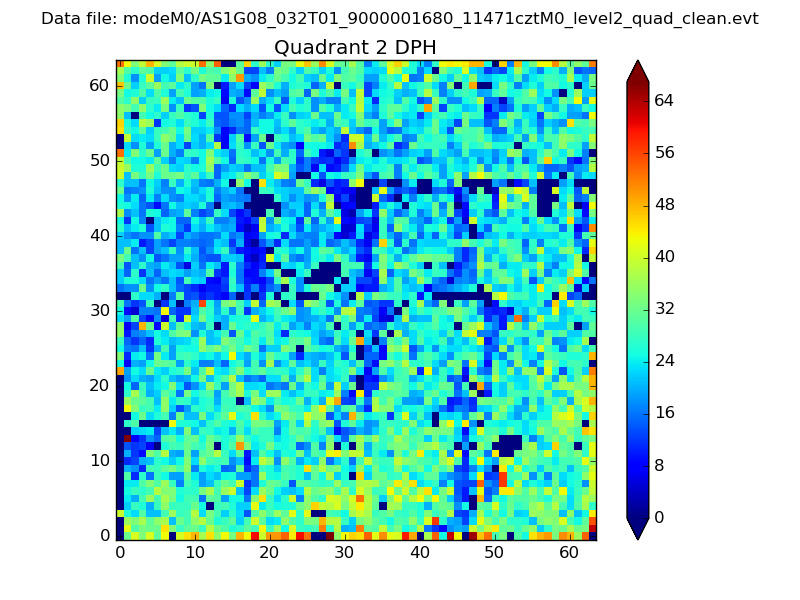 |
Quadrant C |
| Plot type | Count rate plots | Images |
|---|---|---|
| Comparison with Poisson distribution Blue bars denote a histogram of data divided into 1 sec bins. Red curve is a Poisson curve with rate = median count rate of data. |
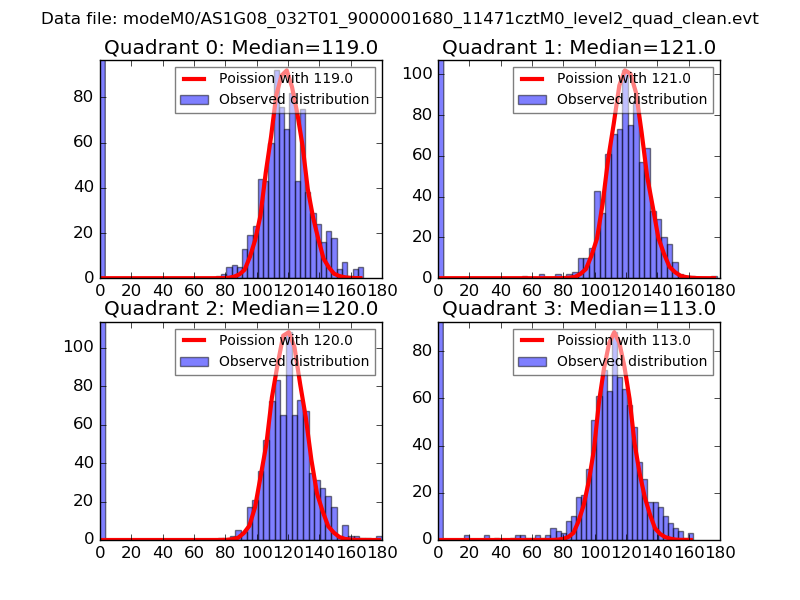 |
 |
| Quadrant-wise count rates Data is divided into 100 sec bins |
 |
|
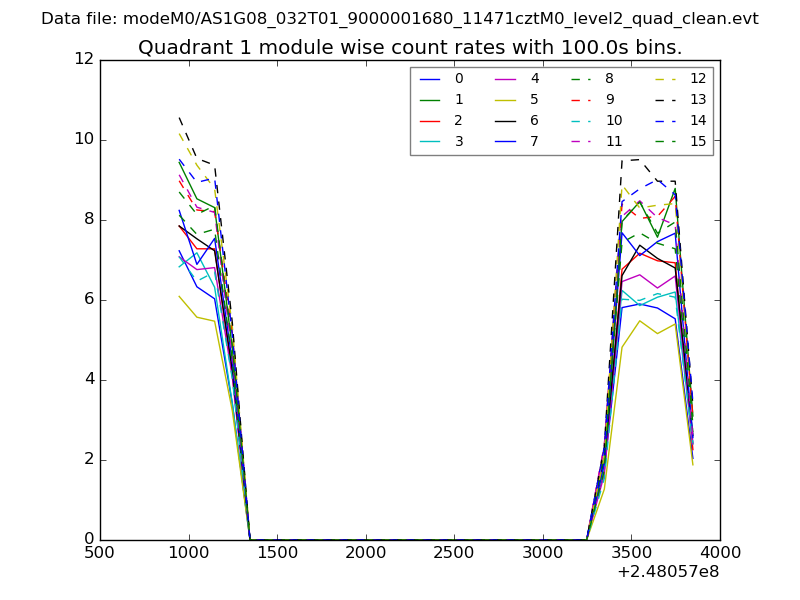
| Module-wise count rates for Quadrant A Data is divided into 100 sec bins |
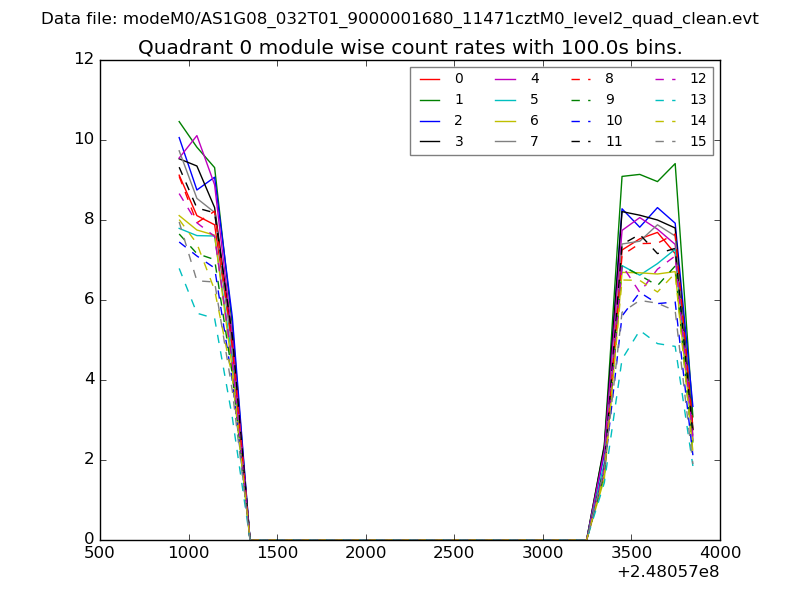 |
 |
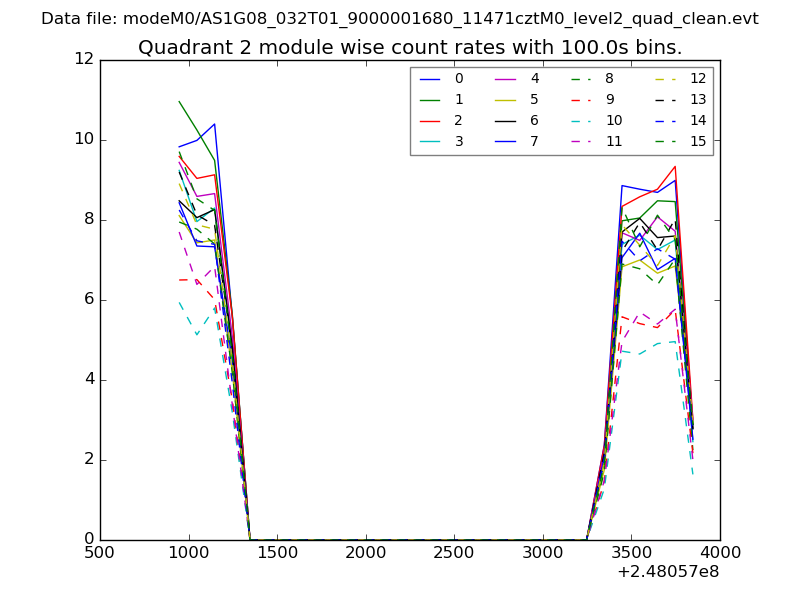
| Module-wise count rates for Quadrant B Data is divided into 100 sec bins |
 |
 |
| Module-wise count rates for Quadrant C Data is divided into 100 sec bins |
 |
 |
| Module-wise count rates for Quadrant D Data is divided into 100 sec bins |
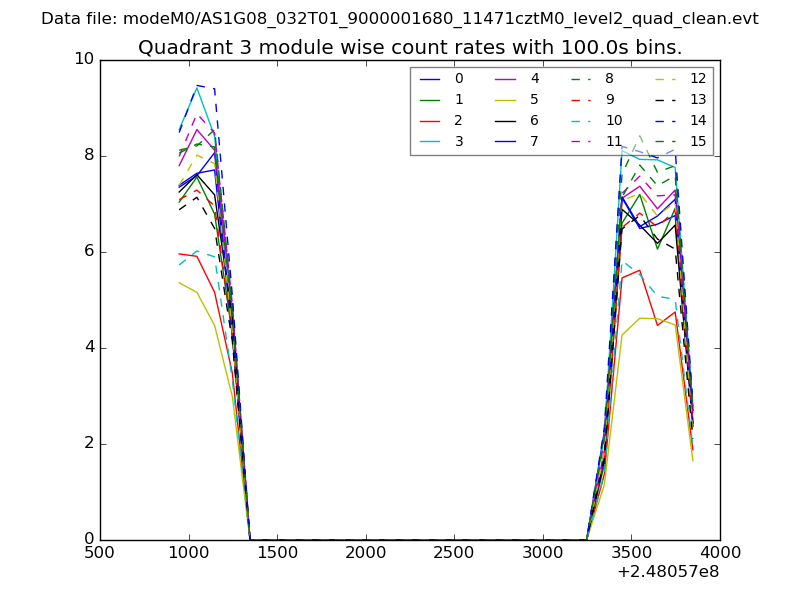 |
 |
| Parameter | Plot |
|---|---|
| CZT HV Monitor | 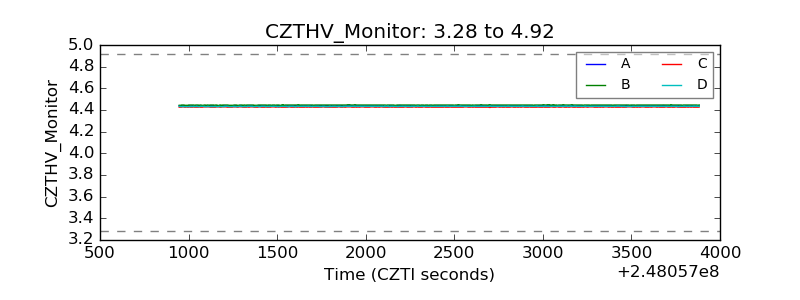 |
| D_VDD | 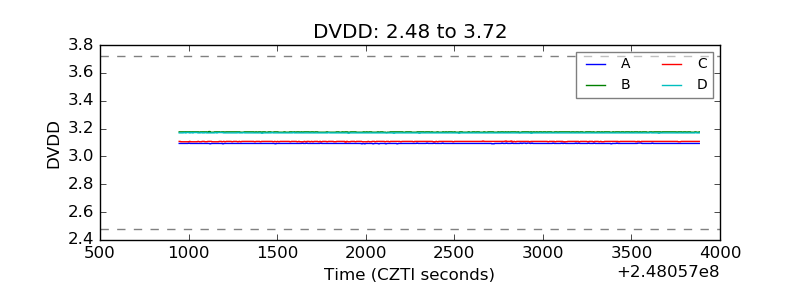 |
| Temperature 1 | 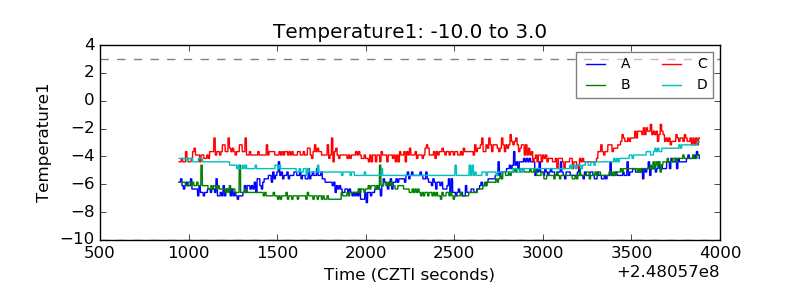 |
| Veto HV Monitor | 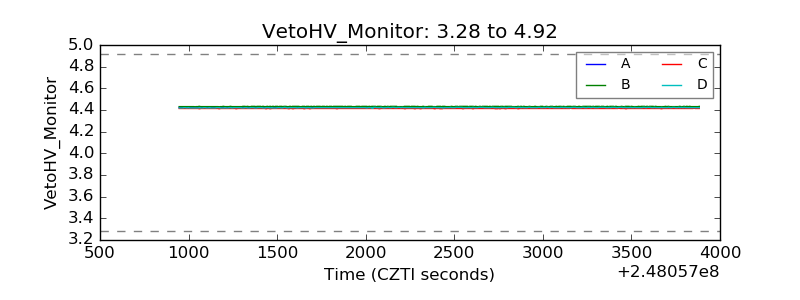 |
| Veto LLD | 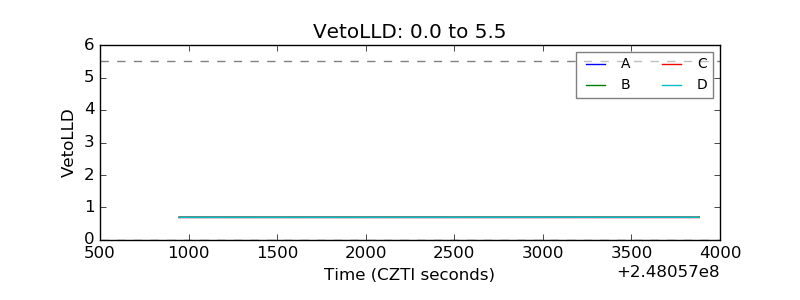 |
| Alpha Counter | 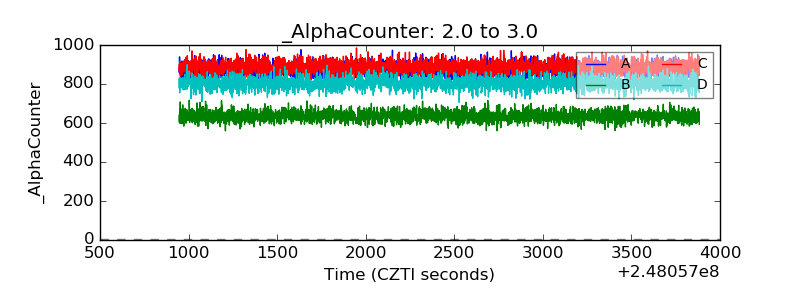 |
| _CPM_Rate | 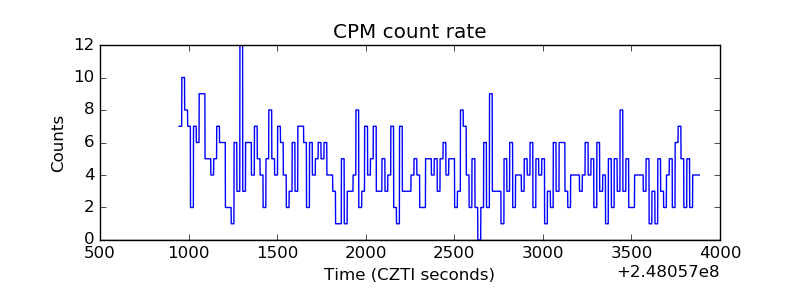 |
| CZT Counter |  |
| +2.5 Volts monitor |  |
| +5 Volts monitor |  |
| _ROLL_ROT | 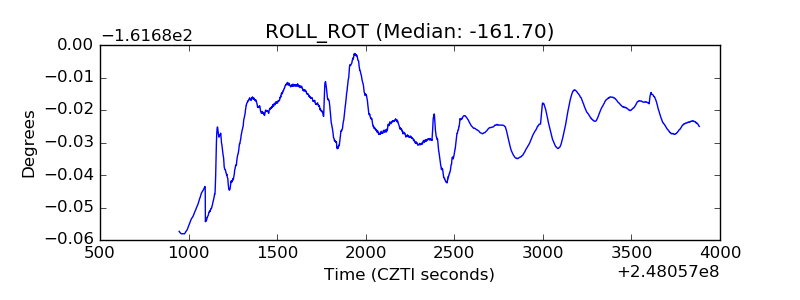 |
| _Roll_DEC | 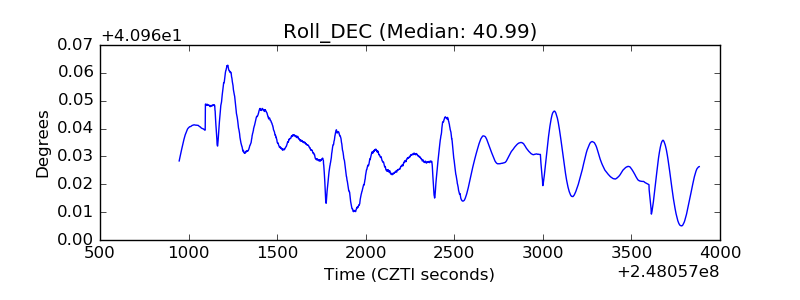 |
| _Roll_RA | 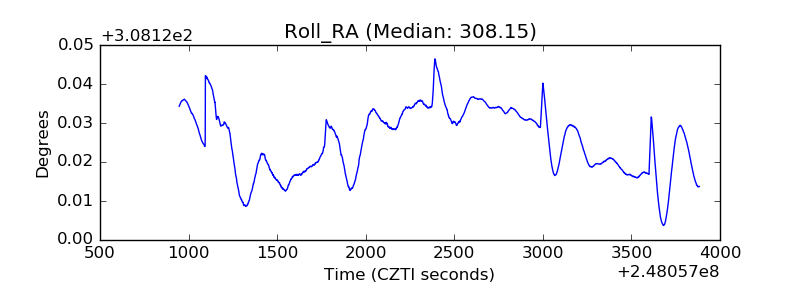 |
| Veto Counter | 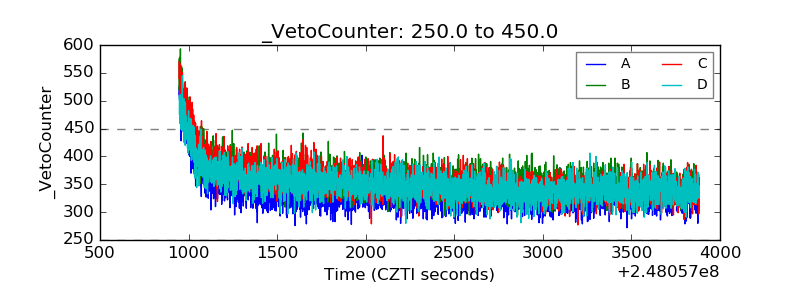 |