| Param | Original file | Final file |
|---|---|---|
| Filename | modeM0/AS1A04_021T04_9000001682cztM0_level2.fits | modeM0/AS1A04_021T04_9000001682cztM0_level2_quad_clean.evt |
| Size (bytes) | 479,407,680 | 472,636,800 |
| Size | 457.2 MB | 450.7 MB |
| Events in quadrant A | 2,810,096 | 2,677,880 |
| Events in quadrant B | 2,691,772 | 2,506,691 |
| Events in quadrant C | 2,961,422 | 2,993,978 |
| Events in quadrant D | 2,546,688 | 2,631,651 |
| Mode M0 | |||
|---|---|---|---|
| Quadrant | BADHDUFLAG | Total packets | Discarded packets |
| A | 0 | 172958 | 0 |
| B | 0 | 174622 | 0 |
| C | 0 | 105125 | 0 |
| D | 0 | 130834 | 0 |
| Mode SS | |||
|---|---|---|---|
| Quadrant | BADHDUFLAG | Total packets | Discarded packets |
| A | 0 | 1038 | 0 |
| B | 0 | 1038 | 0 |
| C | 0 | 1038 | 0 |
| D | 0 | 1038 | 0 |
| Mode M9 | |||
|---|---|---|---|
| Quadrant | BADHDUFLAG | Total packets | Discarded packets |
| A | 0 | 102 | 0 |
| B | 0 | 102 | 0 |
| C | 0 | 102 | 0 |
| D | 0 | 102 | 0 |
| Quadrant | Total seconds | Saturated seconds | Saturation percentage |
|---|---|---|---|
| A | 51050 | 6413 | 12.562194% |
| B | 51050 | 7315 | 14.329089% |
| C | 51050 | 443 | 0.867777% |
| D | 51050 | 1955 | 3.829579% |
Noise dominated data is calculated using 1-second bins in cleaned event files. If a bin has >2000 counts, and if more than 50% of those come from <1% of pixels, then it is considered to be noise-dominated and hence unusable.
| Quadrant | # 1 sec bins | Bins with >0 counts | Bins with >2000 counts | High rate bins dominated by noise | Noise dominated (total time) | Noise dominated (detector-on time) | Marked lightcurve |
|---|---|---|---|---|---|---|---|
| A | 61120 | 51023 | 0 | 0 | 0.00% | 0.00% |  |
| B | 61120 | 51017 | 0 | 0 | 0.00% | 0.00% |  |
| C | 61120 | 51050 | 0 | 0 | 0.00% | 0.00% |  |
| D | 61120 | 50983 | 0 | 0 | 0.00% | 0.00% |  |
Top three noisy pixels from each quadrant. If the there are fewer than three noisy pixels in the level2.evt file, extra rows are filled as -1
| Pixel properties | Quadrant properties | ||||||
|---|---|---|---|---|---|---|---|
| Quadrant | DetID | PixID | Counts | Sigma | Mean | Median | Sigma |
| A | 0 | 29 | 2692 | 10.99 | 732 | 686 | 182.6 |
| A | 7 | 110 | 2274 | 8.7 | 732 | 686 | 182.6 |
| A | 0 | 30 | 2135 | 7.94 | 732 | 686 | 182.6 |
| B | 2 | 9 | 2320 | 11.56 | 711 | 678 | 142.0 |
| B | 2 | 8 | 1790 | 7.83 | 711 | 678 | 142.0 |
| B | 14 | 254 | 1776 | 7.73 | 711 | 678 | 142.0 |
| C | 1 | 80 | 2208 | 7.34 | 780 | 728 | 201.6 |
| C | 1 | 81 | 2203 | 7.32 | 780 | 728 | 201.6 |
| C | 12 | 250 | 2092 | 6.76 | 780 | 728 | 201.6 |
| D | 3 | 14 | 1872 | 6.25 | 726 | 660 | 194.0 |
| D | 6 | 231 | 1861 | 6.19 | 726 | 660 | 194.0 |
| D | 7 | 5 | 1789 | 5.82 | 726 | 660 | 194.0 |
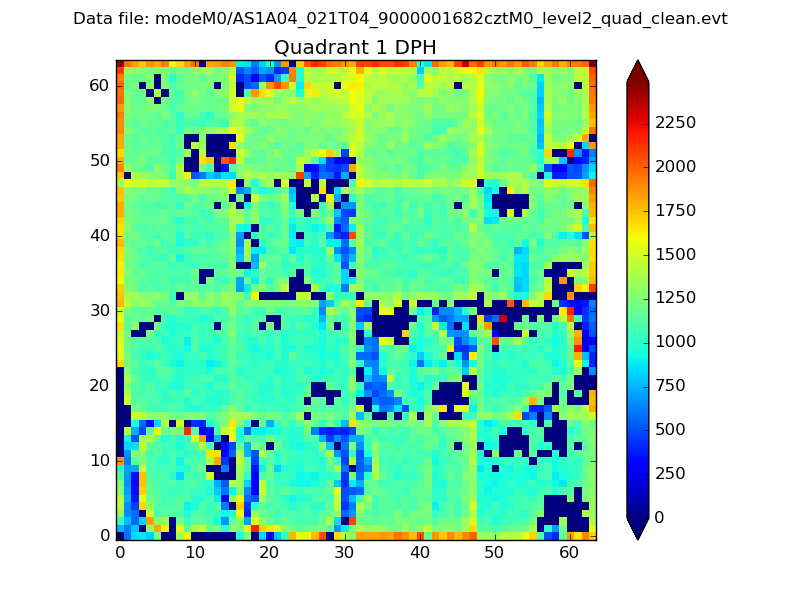
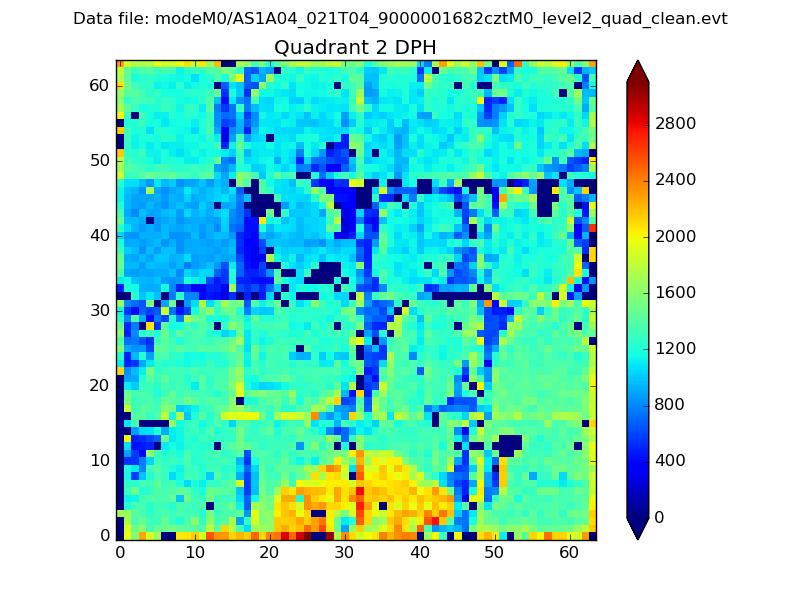
Histogram calculated using DETX and DETY for each event in the final _common_clean file
| Quadrant A |  |
 |
Quadrant B |
|---|---|---|---|
| Quadrant D |  |
 |
Quadrant C |
| Plot type | Count rate plots | Images |
|---|---|---|
| Comparison with Poisson distribution Blue bars denote a histogram of data divided into 1 sec bins. Red curve is a Poisson curve with rate = median count rate of data. |
 |
 |
| Quadrant-wise count rates Data is divided into 100 sec bins |
 |
|
| Module-wise count rates for Quadrant A Data is divided into 100 sec bins |
 |
 |
| Module-wise count rates for Quadrant B Data is divided into 100 sec bins |
 |
 |
| Module-wise count rates for Quadrant C Data is divided into 100 sec bins |
 |
 |
| Module-wise count rates for Quadrant D Data is divided into 100 sec bins |
 |
 |
| Parameter | Plot |
|---|---|
| CZT HV Monitor |  |
| D_VDD |  |
| Temperature 1 |  |
| Veto HV Monitor |  |
| Veto LLD |  |
| Alpha Counter |  |
| _CPM_Rate |  |
| CZT Counter |  |
| +2.5 Volts monitor |  |
| +5 Volts monitor |  |
| _ROLL_ROT |  |
| _Roll_DEC |  |
| _Roll_RA |  |
| Veto Counter |  |