| Param | Original file | Final file |
|---|---|---|
| Filename | modeM0/AS1A04_021T04_9000001682_11471cztM0_level2.evt | modeM0/AS1A04_021T04_9000001682_11471cztM0_level2_quad_clean.evt |
| Size (bytes) | 780,192,000 | 120,458,880 |
| Size | 744.0 MB | 114.9 MB |
| Events in quadrant A | 4,622,903 | 745,143 |
| Events in quadrant B | 7,862,494 | 718,938 |
| Events in quadrant C | 4,299,186 | 802,934 |
| Events in quadrant D | 6,212,253 | 733,436 |
| Mode M0 | |||
|---|---|---|---|
| Quadrant | BADHDUFLAG | Total packets | Discarded packets |
| A | 0 | 19762 | 3 |
| B | 0 | 29710 | 2 |
| C | 0 | 19091 | 2 |
| D | 0 | 24748 | 2 |
| Mode SS | |||
|---|---|---|---|
| Quadrant | BADHDUFLAG | Total packets | Discarded packets |
| A | 0 | 190 | 0 |
| B | 0 | 190 | 0 |
| C | 0 | 190 | 0 |
| D | 0 | 190 | 0 |
| Mode M9 | |||
|---|---|---|---|
| Quadrant | BADHDUFLAG | Total packets | Discarded packets |
| A | 0 | 12 | 0 |
| B | 0 | 12 | 0 |
| C | 0 | 12 | 0 |
| D | 0 | 12 | 0 |
| Quadrant | Total seconds | Saturated seconds | Saturation percentage |
|---|---|---|---|
| A | 9335 | 116 | 1.242635% |
| B | 9335 | 895 | 9.587574% |
| C | 9335 | 35 | 0.374933% |
| D | 9335 | 358 | 3.835029% |
Noise dominated data is calculated using 1-second bins in cleaned event files. If a bin has >2000 counts, and if more than 50% of those come from <1% of pixels, then it is considered to be noise-dominated and hence unusable.
| Quadrant | # 1 sec bins | Bins with >0 counts | Bins with >2000 counts | High rate bins dominated by noise | Noise dominated (total time) | Noise dominated (detector-on time) | Marked lightcurve |
|---|---|---|---|---|---|---|---|
| A | 10516 | 9338 | 15 | 15 | 0.14% | 0.16% |  |
| B | 10516 | 9338 | 458 | 458 | 4.36% | 4.90% |  |
| C | 10516 | 9338 | 4 | 4 | 0.04% | 0.04% | 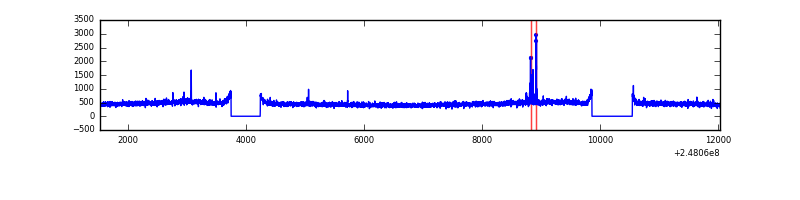 |
| D | 10516 | 9338 | 300 | 300 | 2.85% | 3.21% | 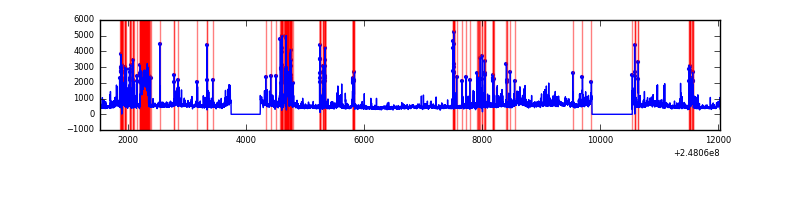 |
Top three noisy pixels from each quadrant. If the there are fewer than three noisy pixels in the level2.evt file, extra rows are filled as -1
| Pixel properties | Quadrant properties | ||||||
|---|---|---|---|---|---|---|---|
| Quadrant | DetID | PixID | Counts | Sigma | Mean | Median | Sigma |
| A | 1 | 162 | 105585 | 463.68 | 1091 | 1065 | 225.4 |
| A | 14 | 235 | 62111 | 270.82 | 1091 | 1065 | 225.4 |
| A | 1 | 178 | 60218 | 262.42 | 1091 | 1065 | 225.4 |
| B | 4 | 81 | 1285432 | 6305.46 | 1064 | 1035 | 203.7 |
| B | 4 | 239 | 1256050 | 6161.22 | 1064 | 1035 | 203.7 |
| B | 15 | 204 | 538574 | 2638.93 | 1064 | 1035 | 203.7 |
| C | 0 | 207 | 37990 | 144.47 | 1091 | 1095 | 255.4 |
| C | 13 | 61 | 7900 | 26.65 | 1091 | 1095 | 255.4 |
| C | 12 | 4 | 5577 | 17.55 | 1091 | 1095 | 255.4 |
| D | 1 | 52 | 1030654 | 4015.5 | 1063 | 1032 | 256.4 |
| D | 10 | 253 | 249133 | 967.59 | 1063 | 1032 | 256.4 |
| D | 2 | 120 | 247563 | 961.46 | 1063 | 1032 | 256.4 |
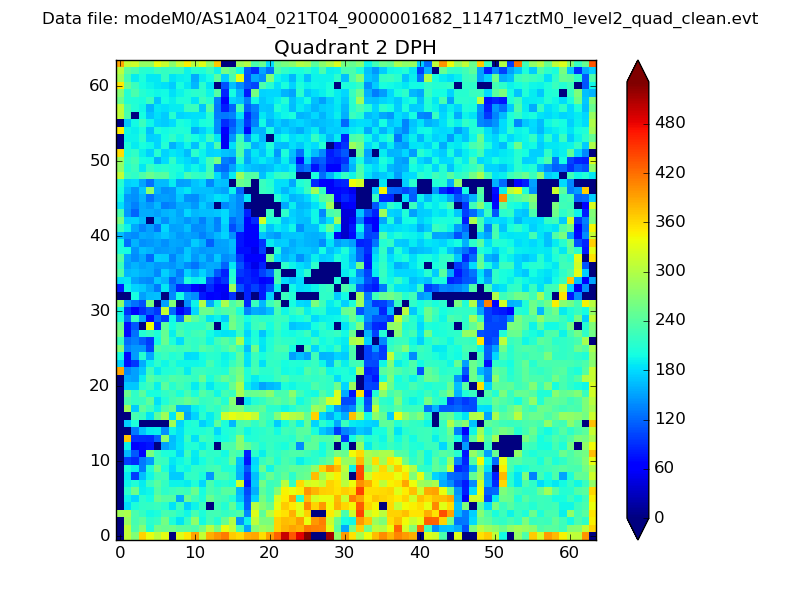
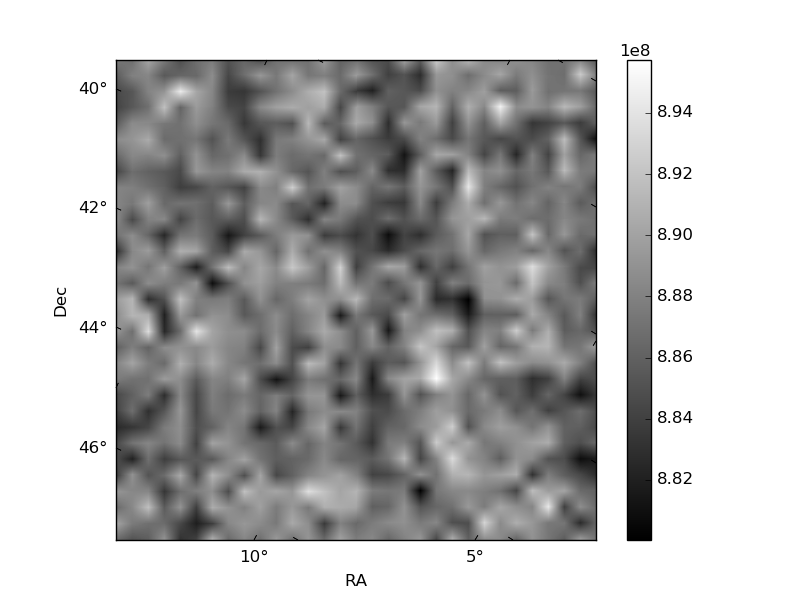
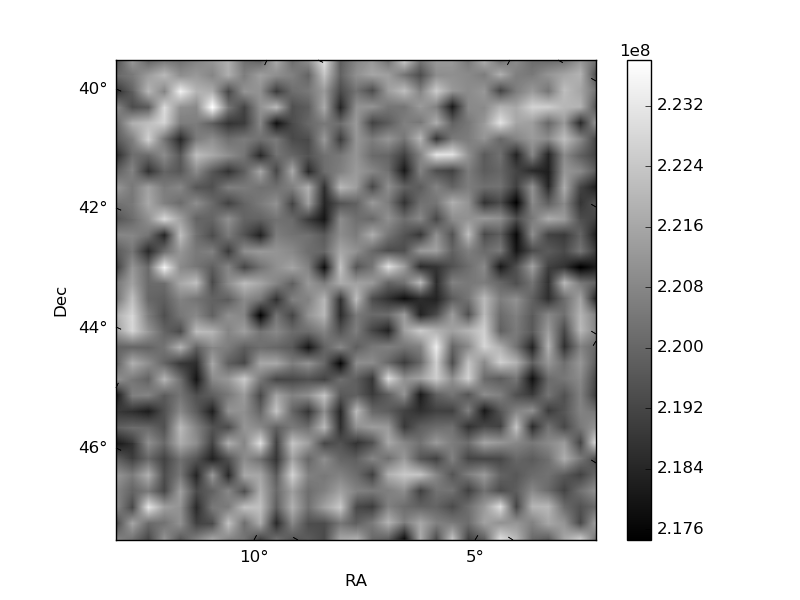
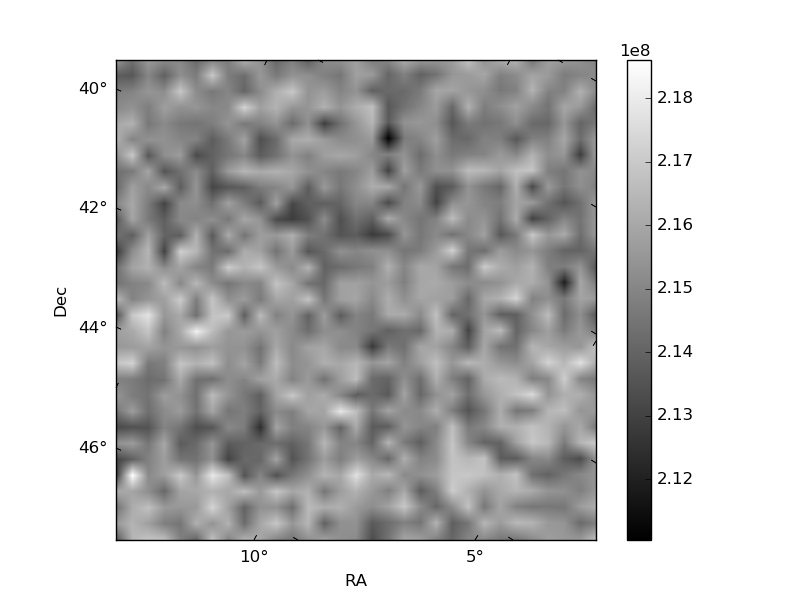
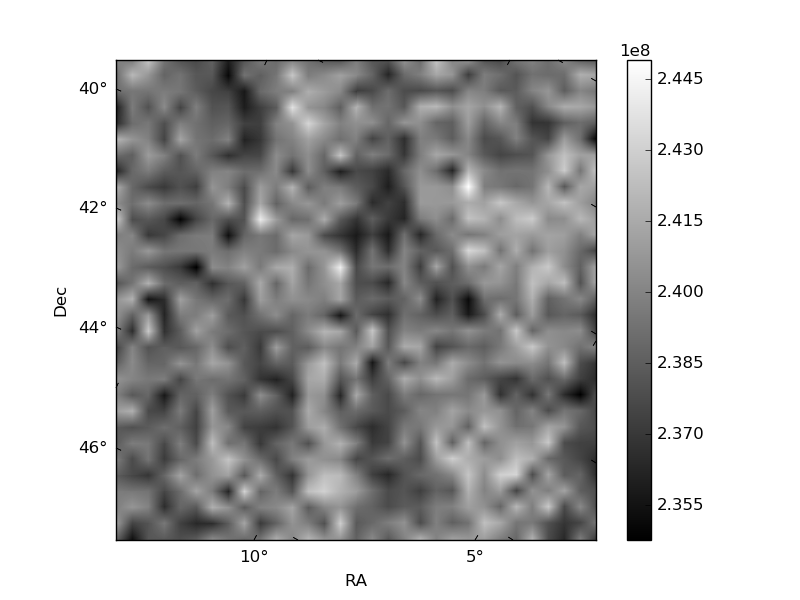
Histogram calculated using DETX and DETY for each event in the final _common_clean file
| Quadrant A |  |
 |
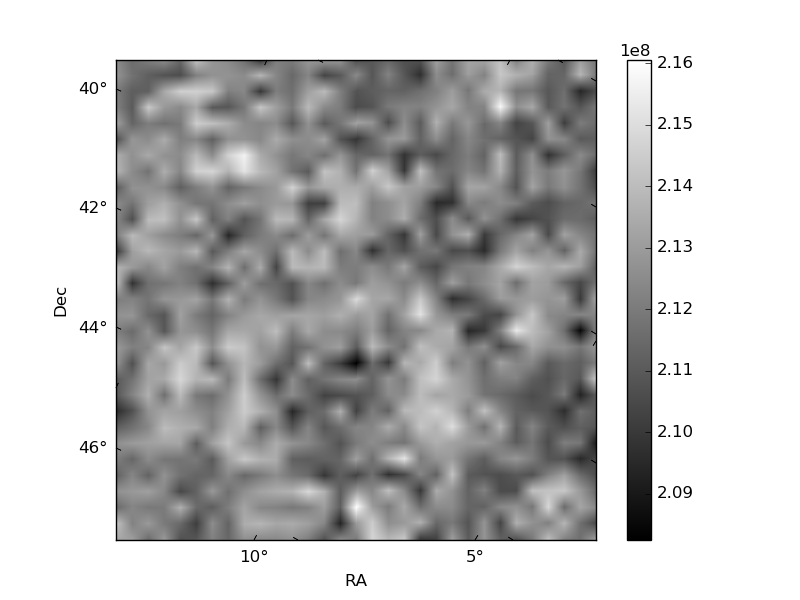
Quadrant B |
|---|---|---|---|
| Quadrant D | 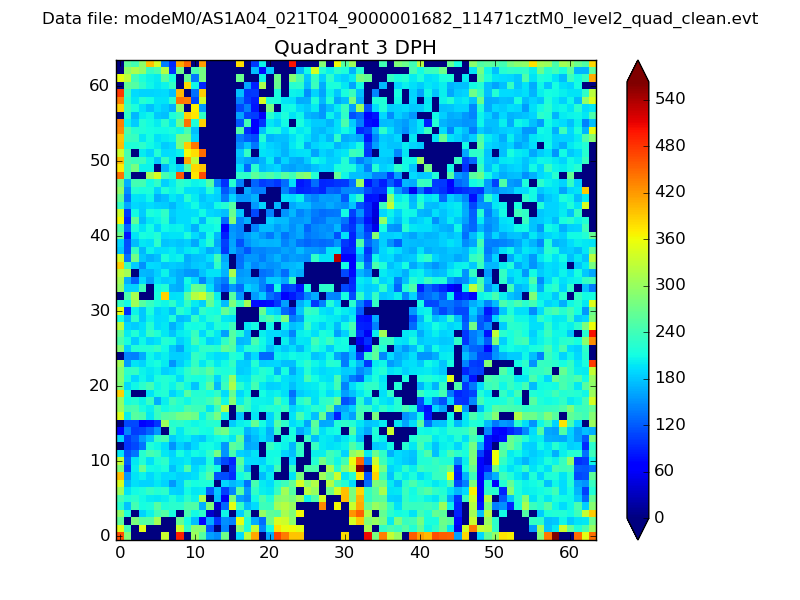 |
 |
Quadrant C |
| Plot type | Count rate plots | Images |
|---|---|---|
| Comparison with Poisson distribution Blue bars denote a histogram of data divided into 1 sec bins. Red curve is a Poisson curve with rate = median count rate of data. |
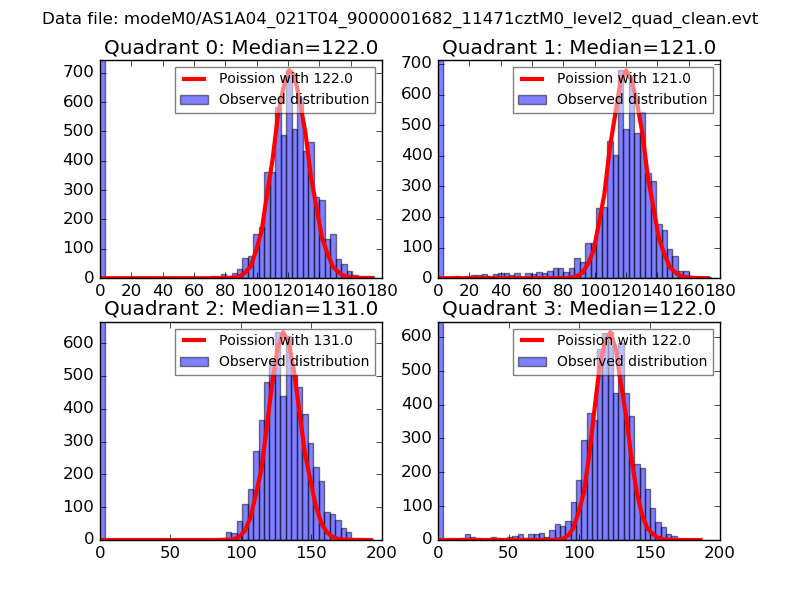 |
 |
| Quadrant-wise count rates Data is divided into 100 sec bins |
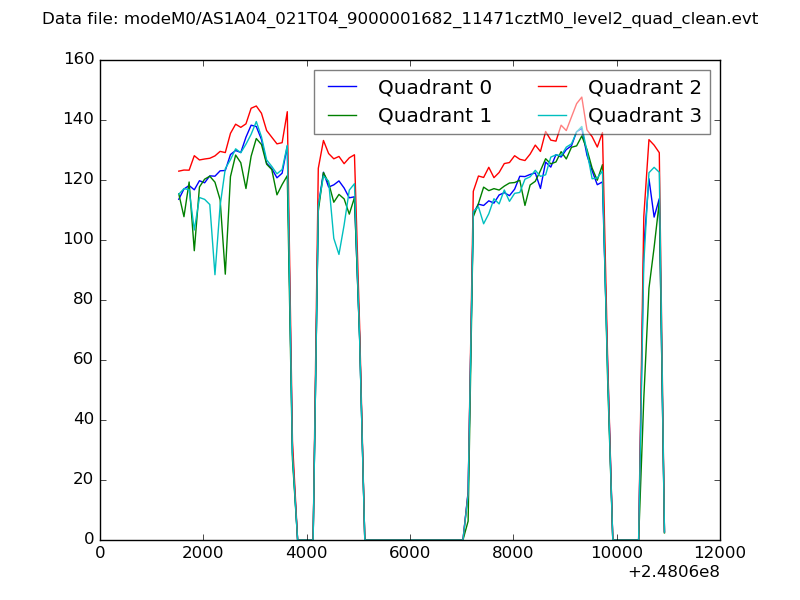 |
|
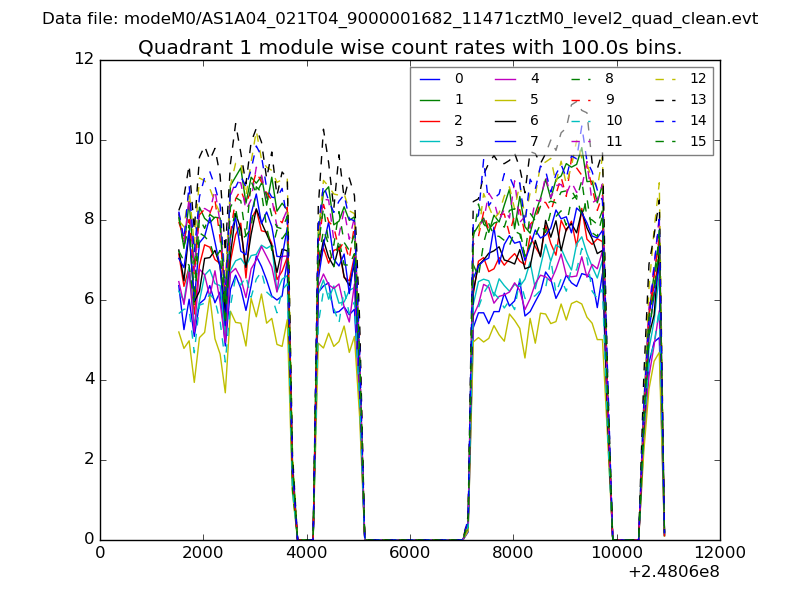
| Module-wise count rates for Quadrant A Data is divided into 100 sec bins |
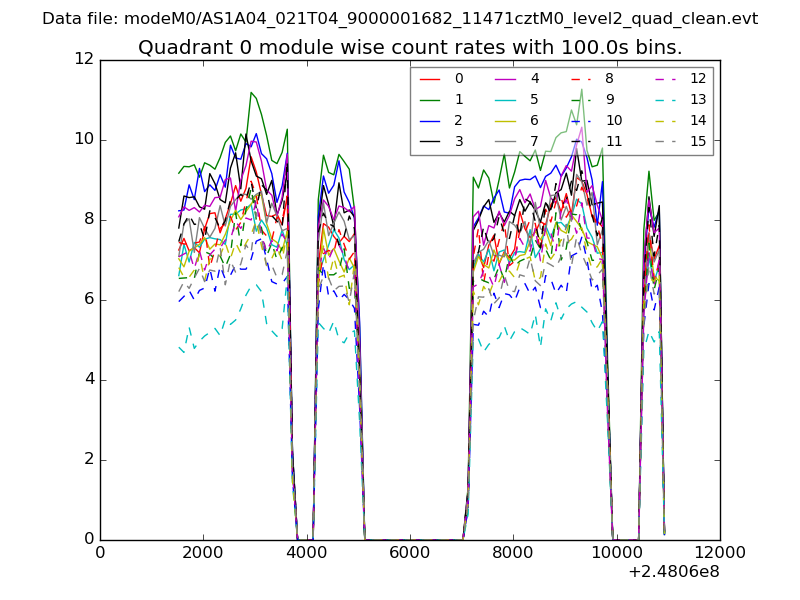 |
 |
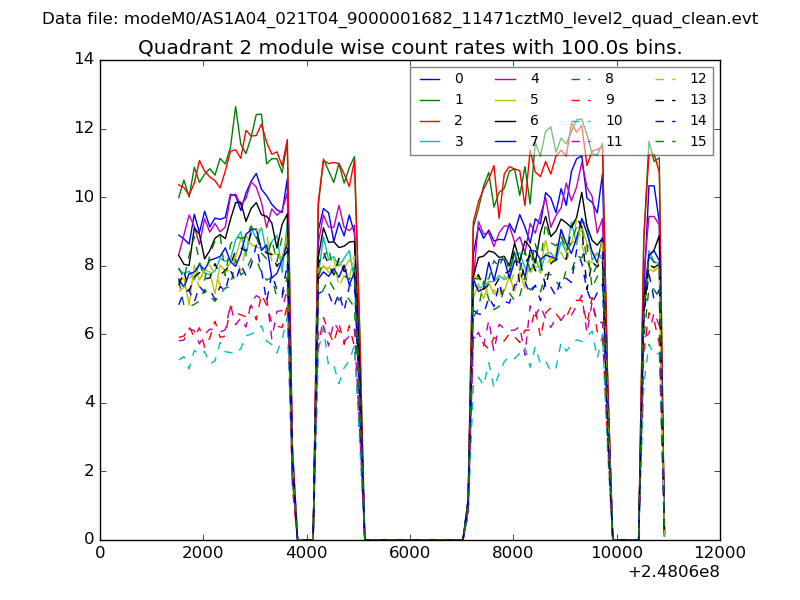
| Module-wise count rates for Quadrant B Data is divided into 100 sec bins |
 |
 |
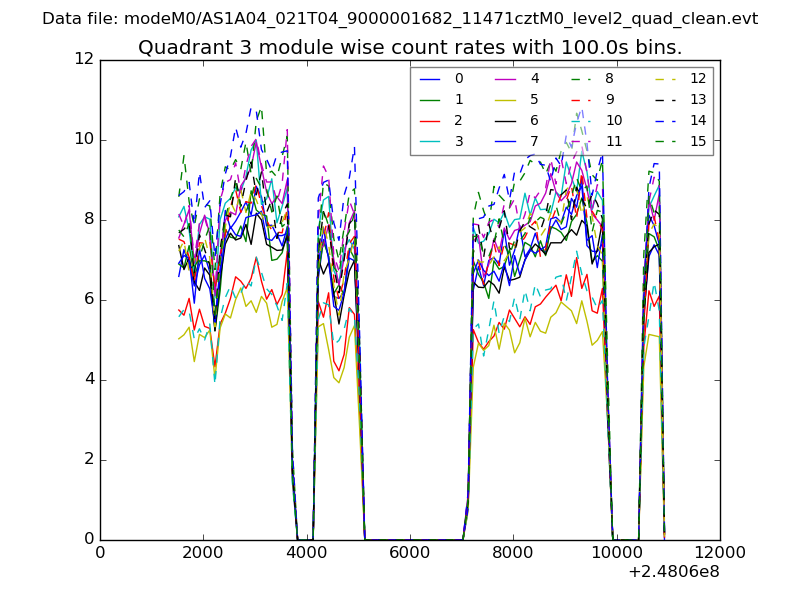
| Module-wise count rates for Quadrant C Data is divided into 100 sec bins |
 |
 |
| Module-wise count rates for Quadrant D Data is divided into 100 sec bins |
 |
 |
| Parameter | Plot |
|---|---|
| CZT HV Monitor | 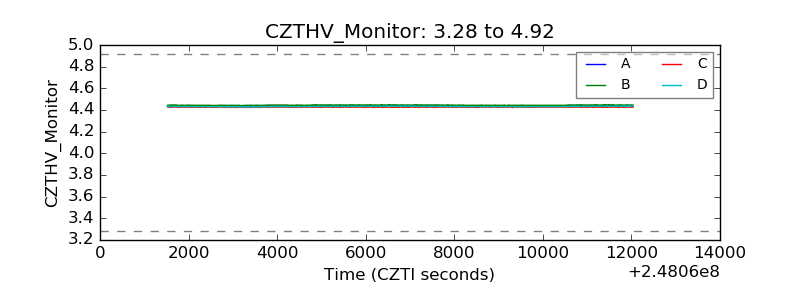 |
| D_VDD | 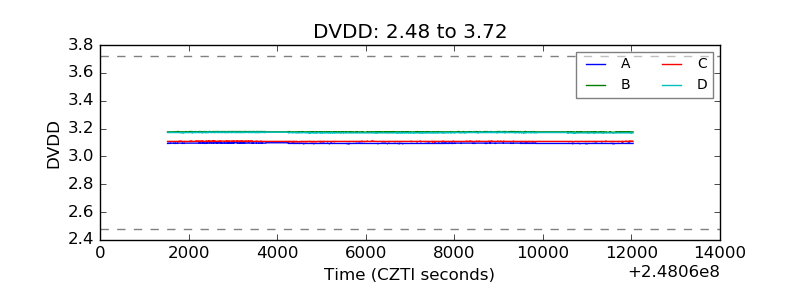 |
| Temperature 1 | 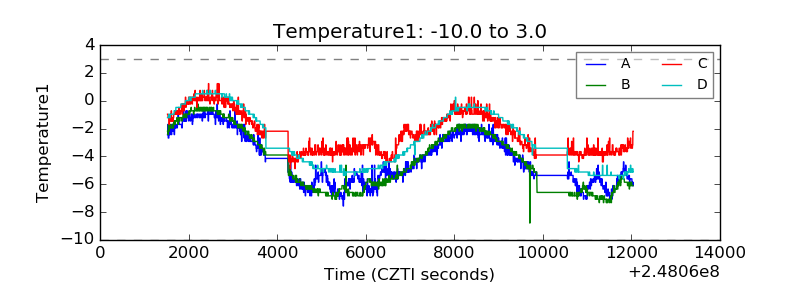 |
| Veto HV Monitor | 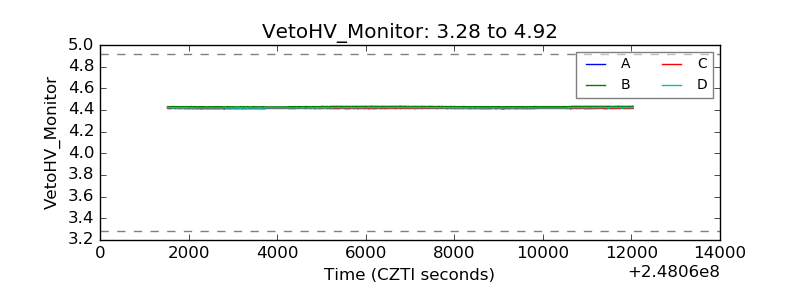 |
| Veto LLD | 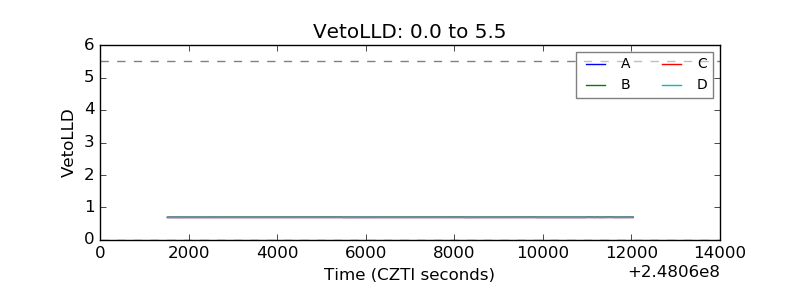 |
| Alpha Counter | 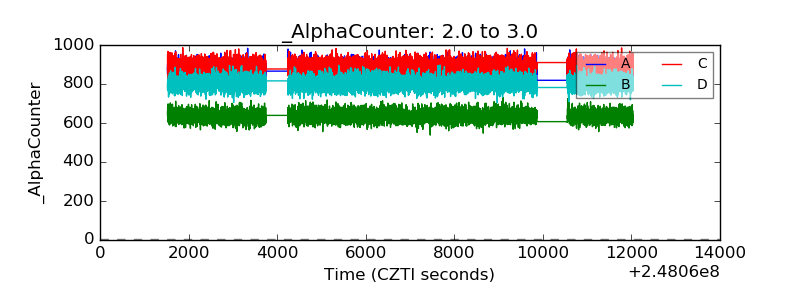 |
| _CPM_Rate | 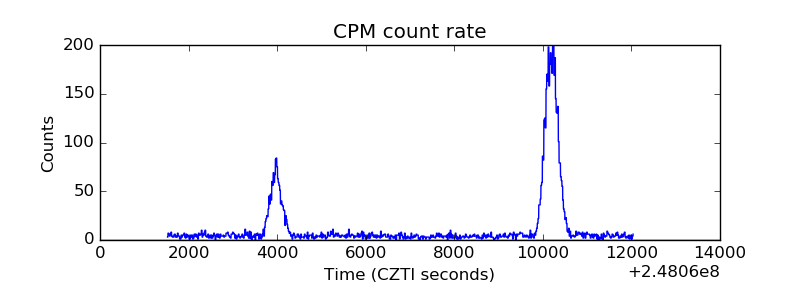 |
| CZT Counter | 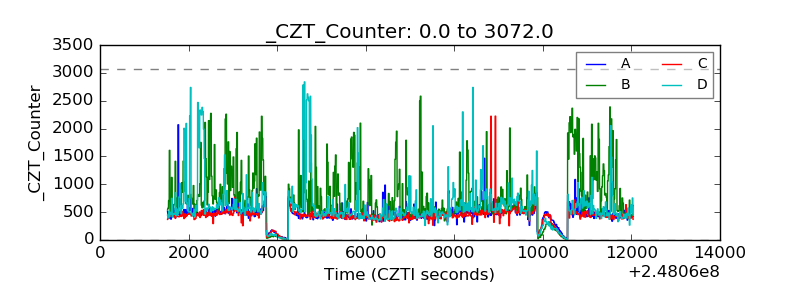 |
| +2.5 Volts monitor | 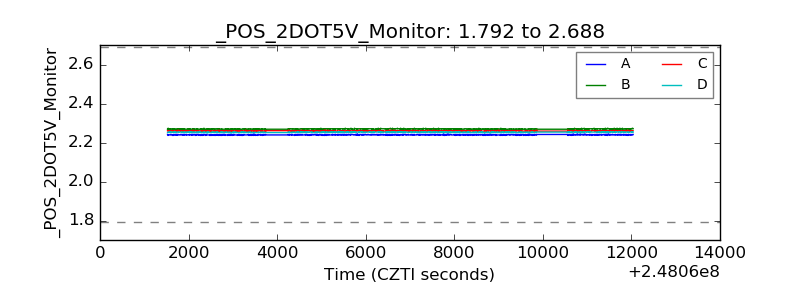 |
| +5 Volts monitor |  |
| _ROLL_ROT | 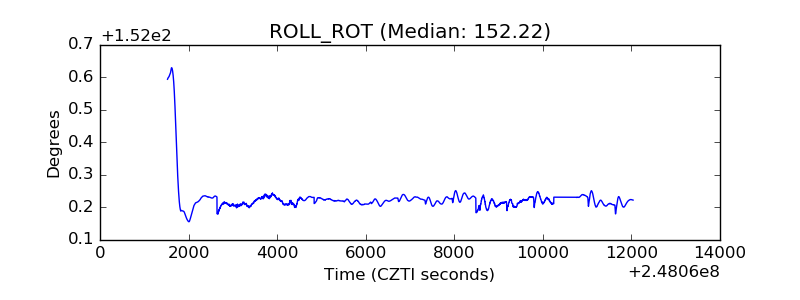 |
| _Roll_DEC | 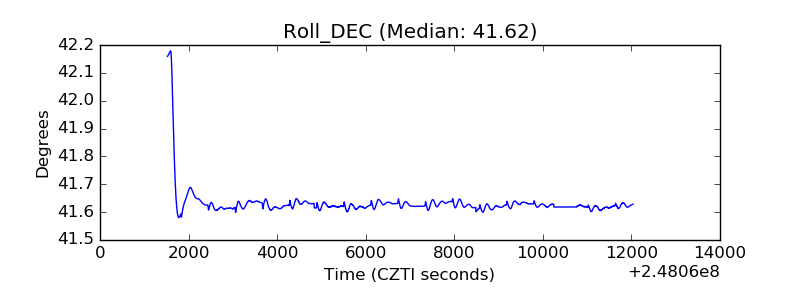 |
| _Roll_RA | 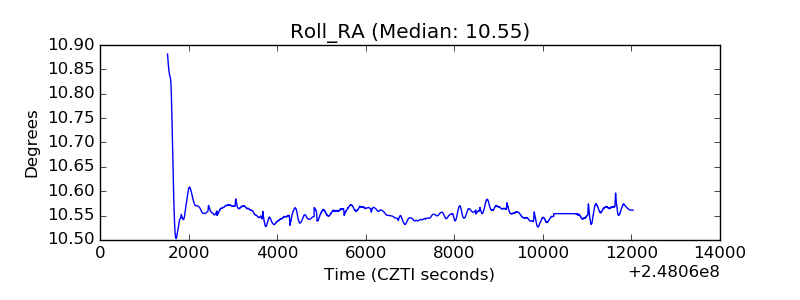 |
| Veto Counter | 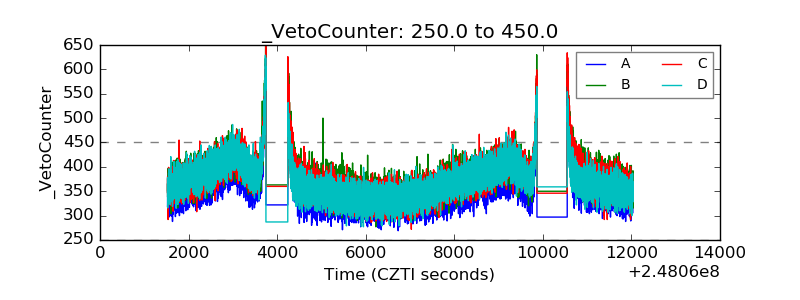 |